0Demo scenario: InsufficientStockException
The demo app keeps hitting GET /demo/checkout. When inventory runs out, service-b throws InsufficientStockException: inventory unavailable for skuId=…. OTLP logs land in Doris with trace_id / span_id.
Every screenshot below comes from the same incident window (last 1 hour), walked in on-call order three ways:
- Path A — You know the exception class: facet search on the global Logs page
- Path B — You have a slow trace: span logs on the flame graph + deep link back to global logs
- Path C — One sentence to AI, dispatching
log.queryLog*tools for ERROR logs
1Path A: global Log Analysis search
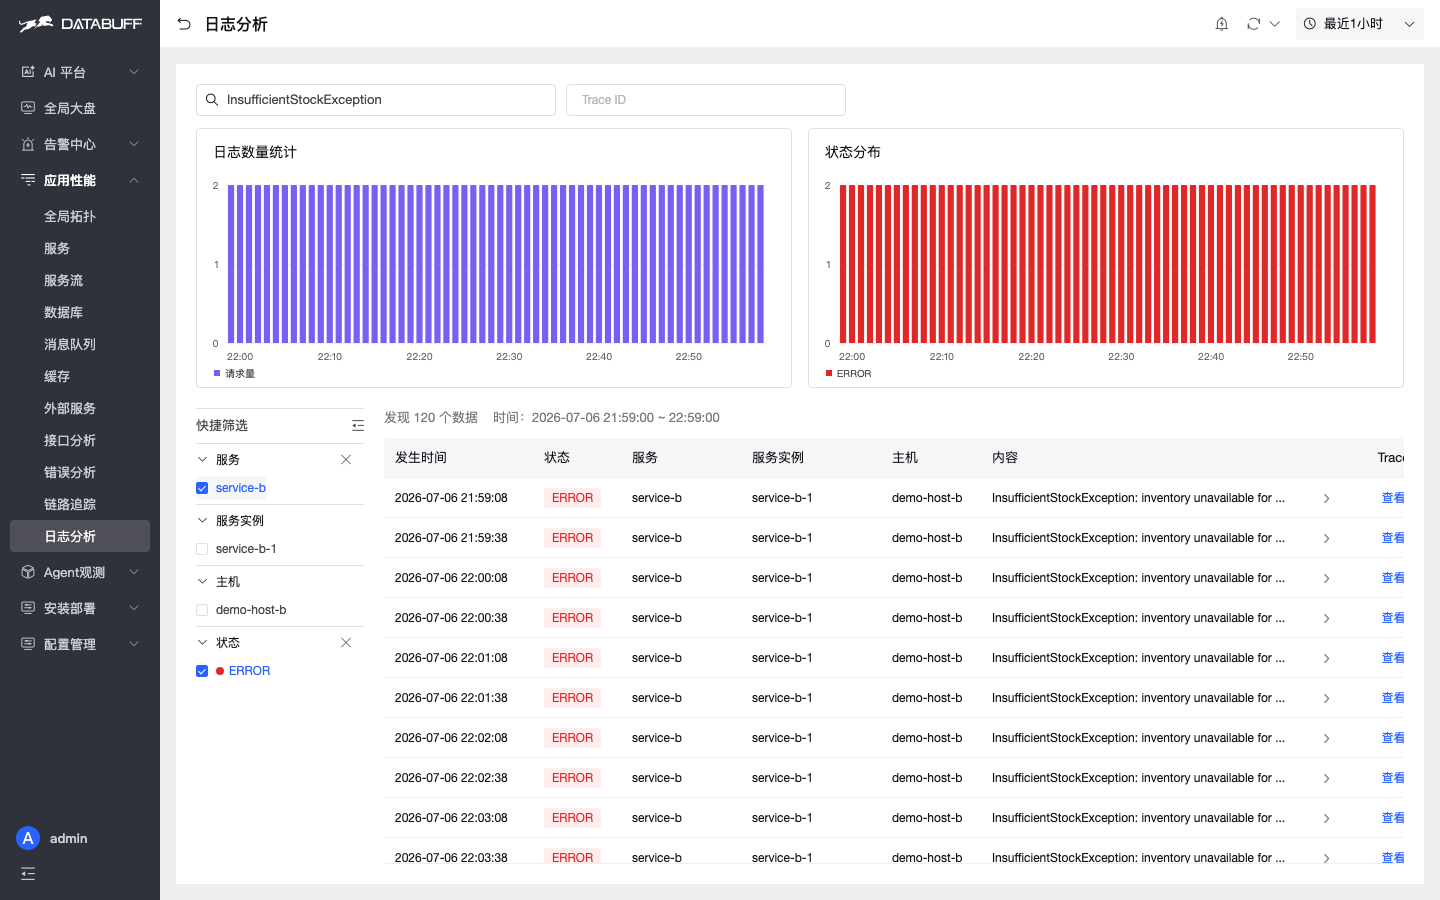
Menu: Application Performance → Log Analysis. No LogQL required — keywords + facets are enough.
Steps: search InsufficientStockException → filter ERROR + service-b → 95 log lines, bar chart shows ERROR spike windows.
2Path B: span logs in Trace + bidirectional deep links
B1 · Trace header: Log Analysis next to TraceID
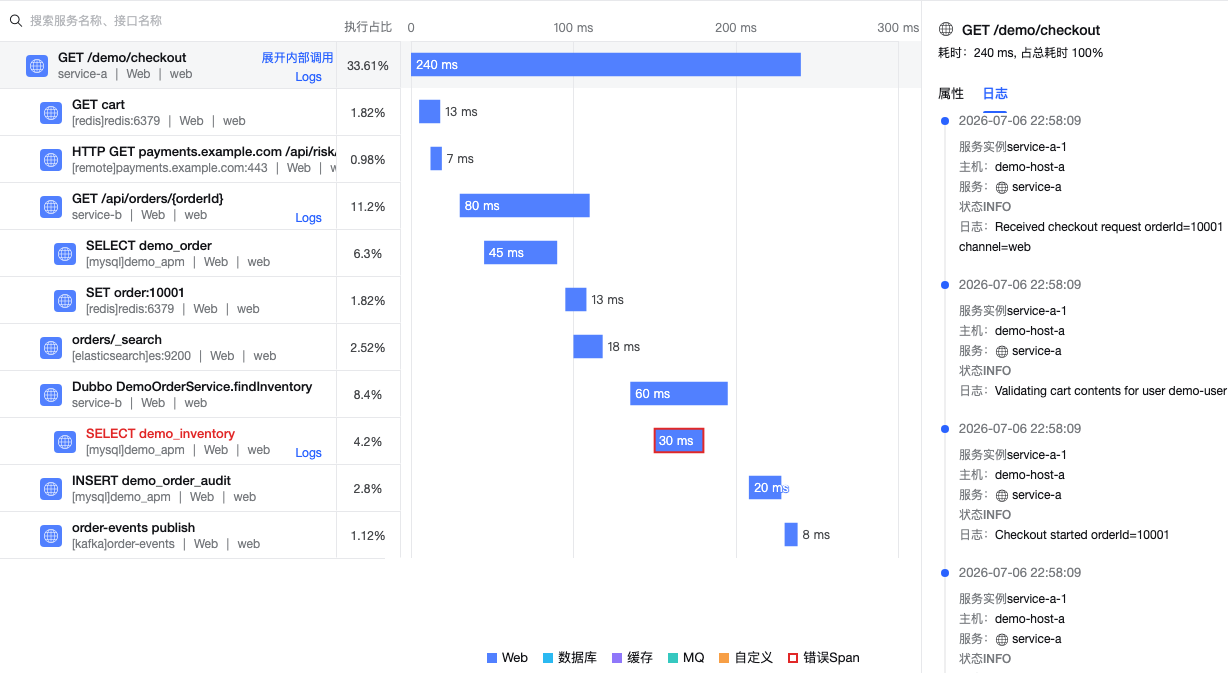
Open a slow GET /demo/checkout trace (240ms) from Trace Search. The header shows TraceID; Log Analysis on the right jumps to the global page with traceId prefilled.

B2 · Span sidebar: flame graph + Logs tab
Spans marked Logs on the flame tree open a sidebar Logs tab: timeline shows Received checkout request → Delegating inventory check to service-b INFO lines; selecting service-b’s span surfaces the ERROR stack.
B3 · Deep link: “View all in Log Analysis”
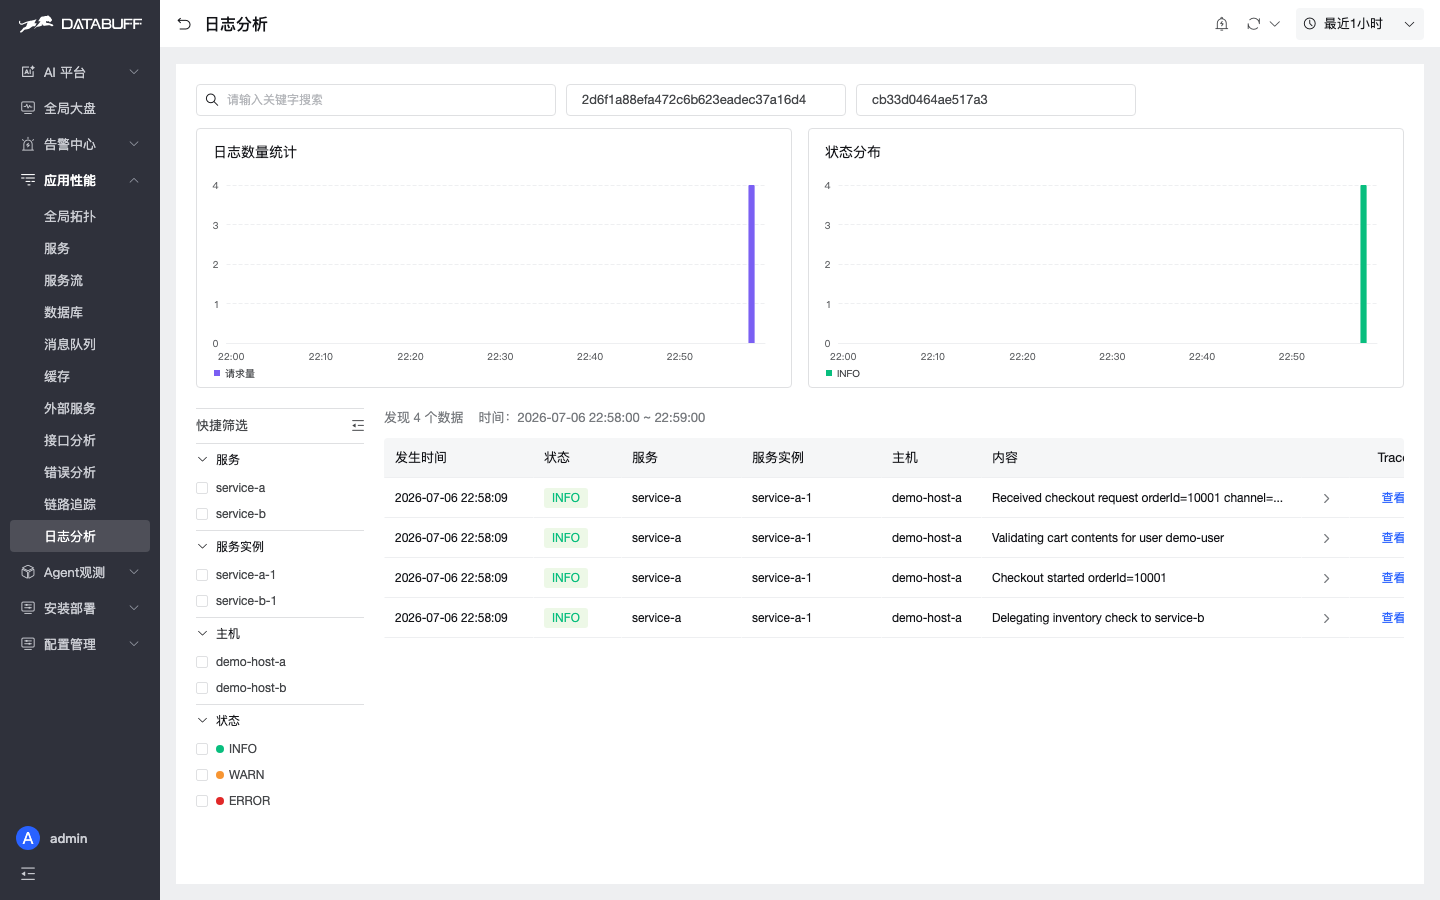
Click the sidebar footer link — the global page auto-fills traceId + spanId and shows only the 4 logs in that span’s context.
3Path C: ask AI about logs
The UI is for precision; AI is for one-sentence delegation. The smart-query expert registers log tool families visible under Tool Management:
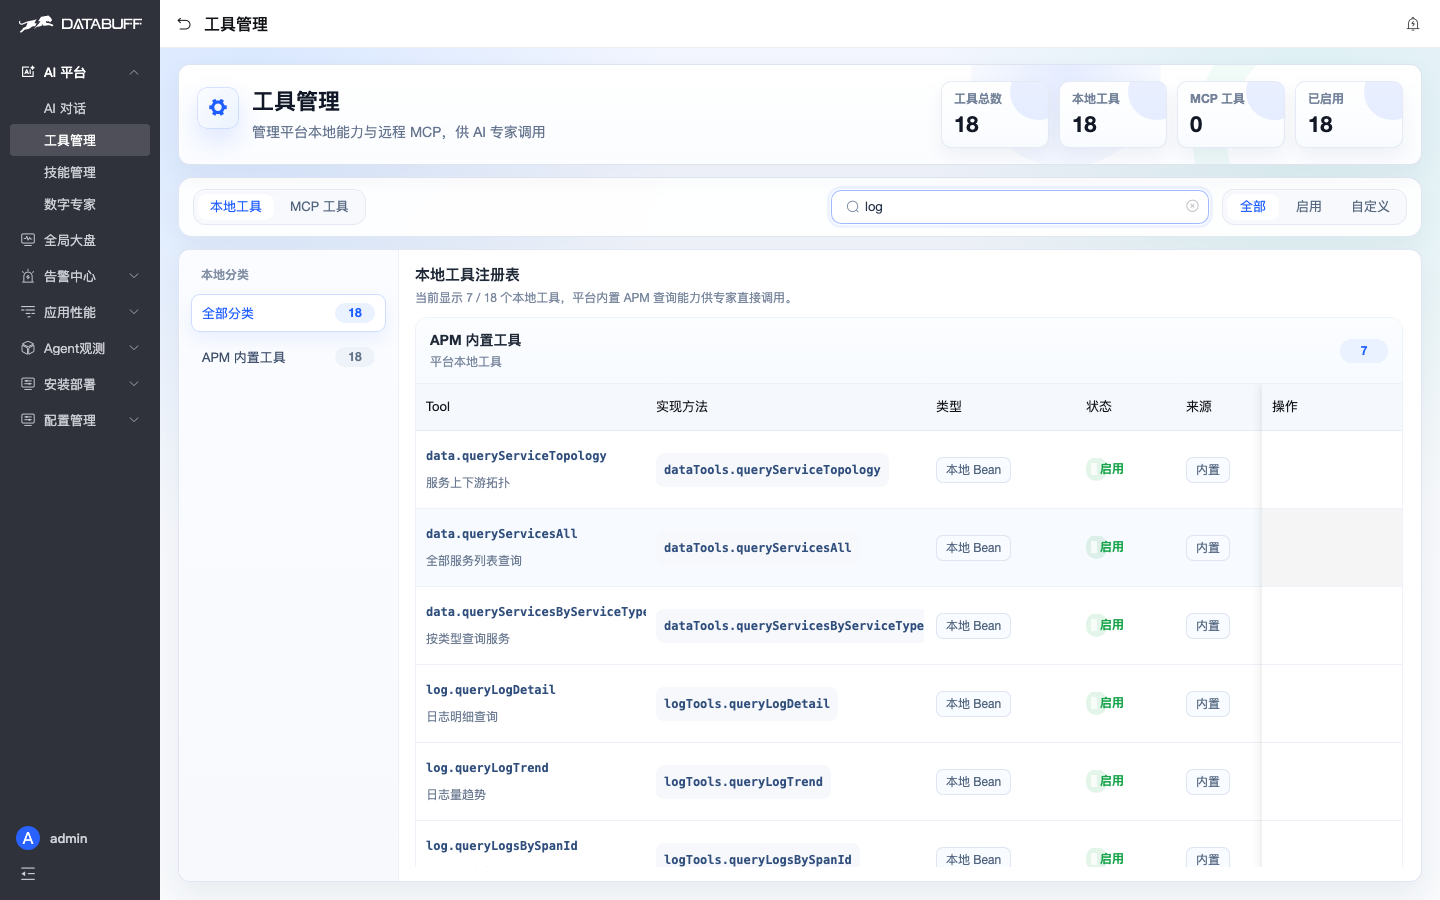
log.queryLogDetail · queryLogsByTraceId · queryLogsBySpanId · queryLogTrendScenario 1 — search ERROR logs by service + keyword:
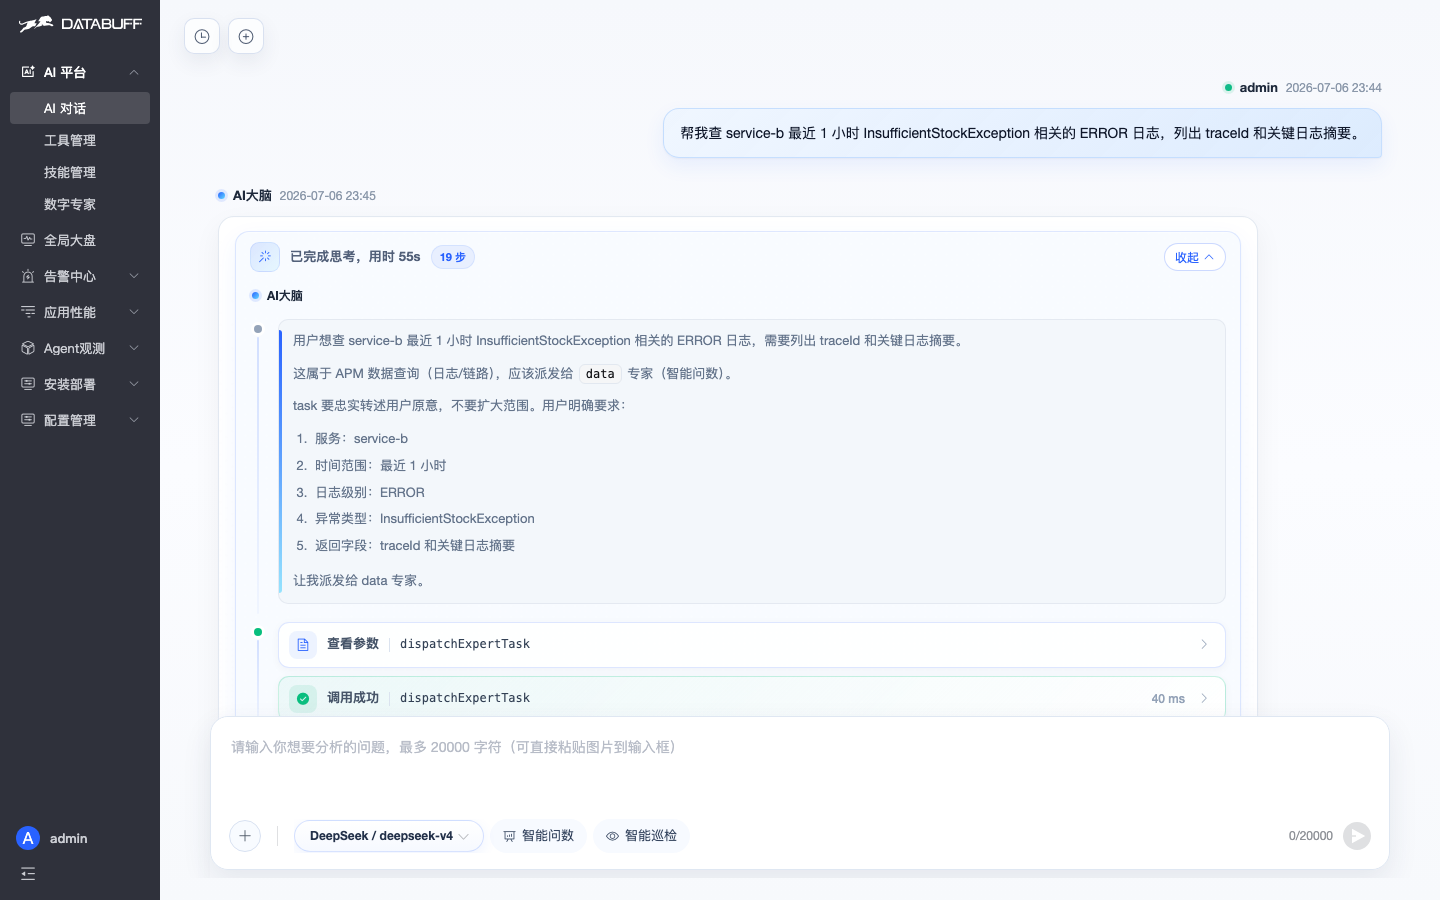
getCurrentTimeRange + queryLogDetail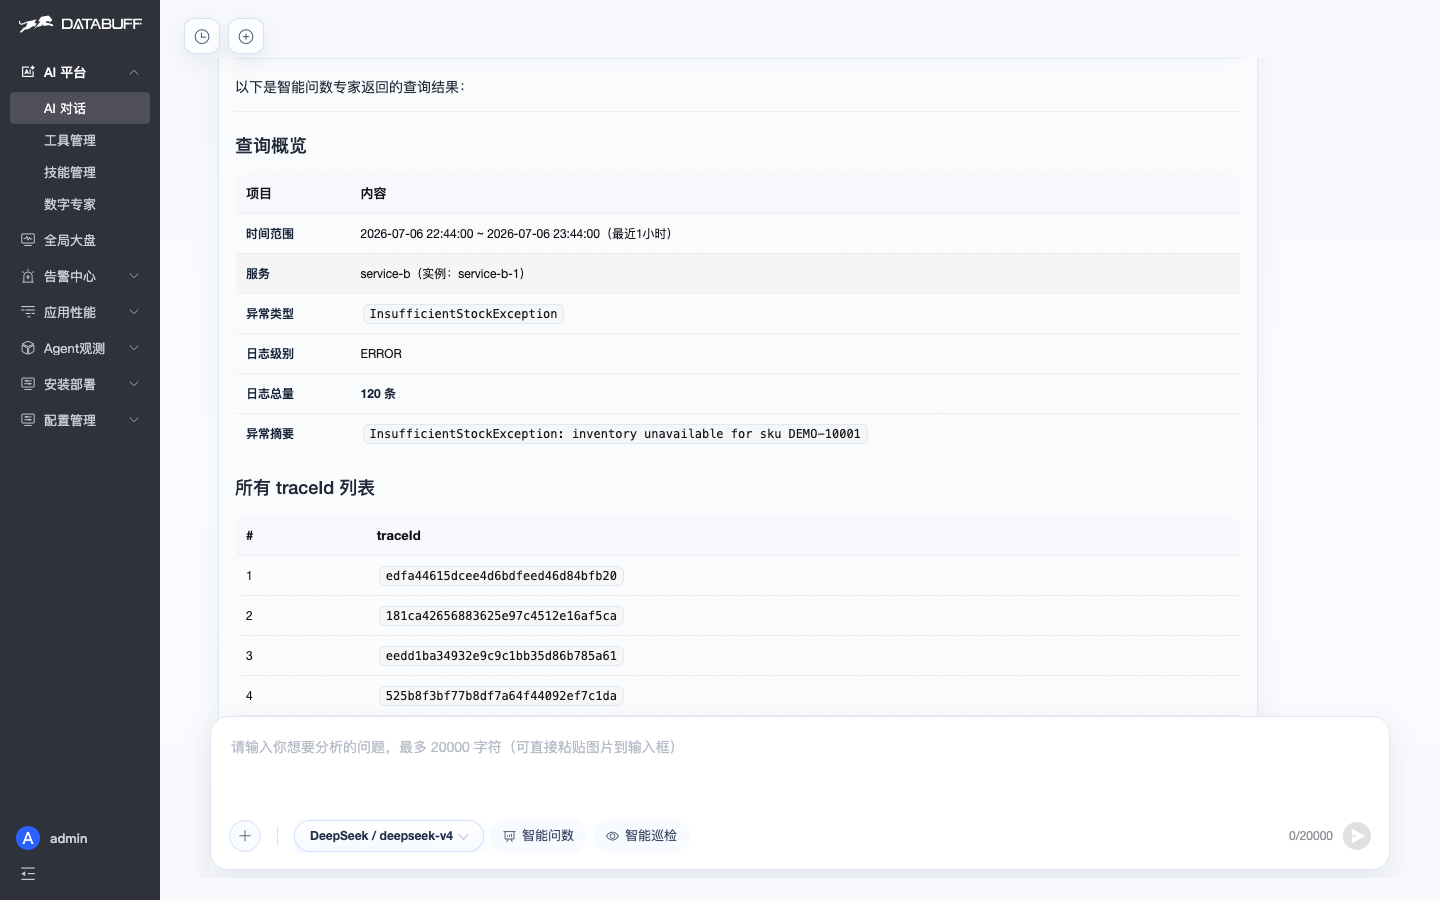
InsufficientStockException: inventory unavailableScenario 2 — known traceId, ask for ERROR logs and root cause:
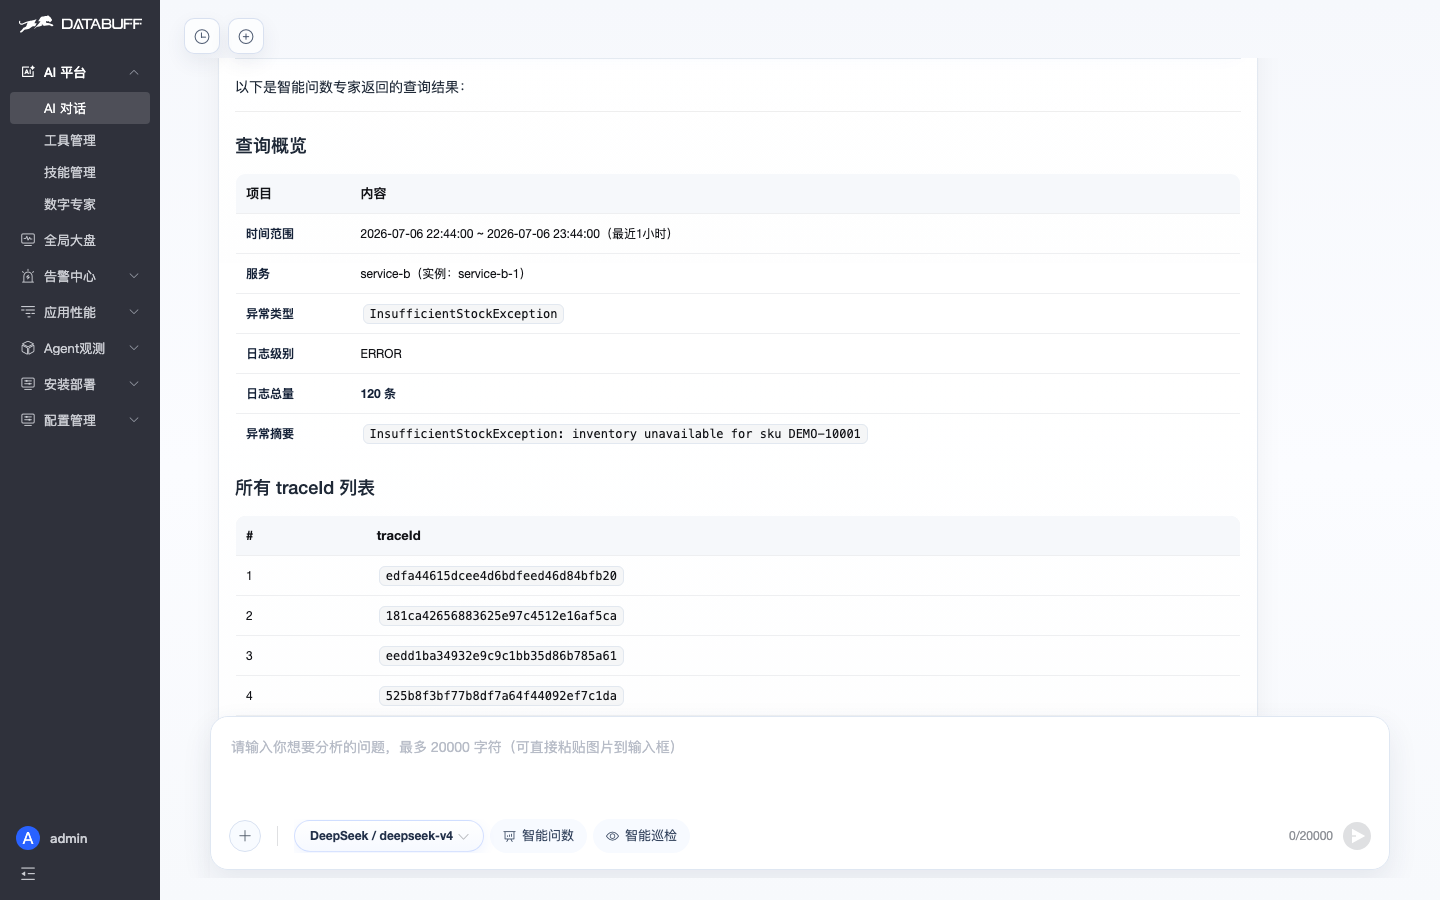
queryLogsByTraceId → 13-span chain + ERROR logs + insufficient-inventory conclusionScenario 3 — check for ERROR log volume spikes (queryLogTrend):
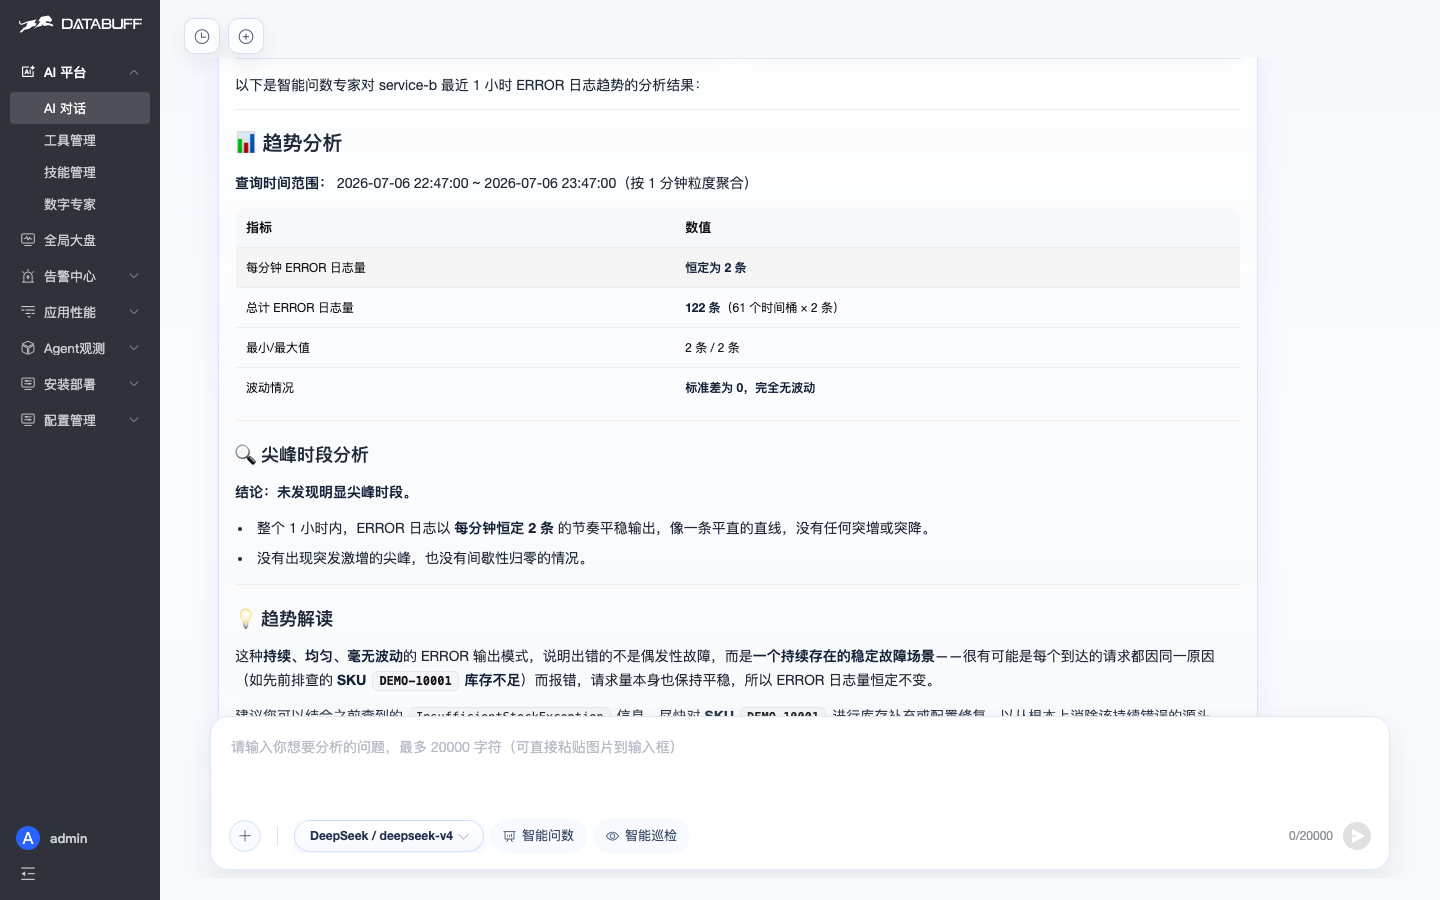
queryLogTrend → steady 2/min · no spike · ongoing inventory shortagequeryLogDetail; known traceId → queryLogsByTraceId; specific span → queryLogsBySpanId; volume spikes → queryLogTrend.
4Where the data comes from · vs ELK
OTLP Logs (:4317 / :4318) → Ingest → Doris log_dc_record → POST /log/search. Inject traceId via MDC on the Java side for correlation.
DataBuff is log exploration in an APM context, not a replacement for ELK/Loki. The win is Trace/Metrics/AI in one context — fewer system hops.
5Try it yourself
One-command deploy · demo includes checkout + inventory failure
curl -fsSL https://databuff.ai/databuff/ai-apm-install.sh | bash
OpenTelemetry LogsTrace correlationAI Native