1Complex incidents: 5 tabs, 30 minutes of stitching
2am alert: “Why is checkout slowing down?” You need P99, slow traces, root cause, and an incident report.
The old way: Grafana → Jaeger → topology → hand-written summary. Charts everywhere, root cause nowhere — 20–30 minutes per round.
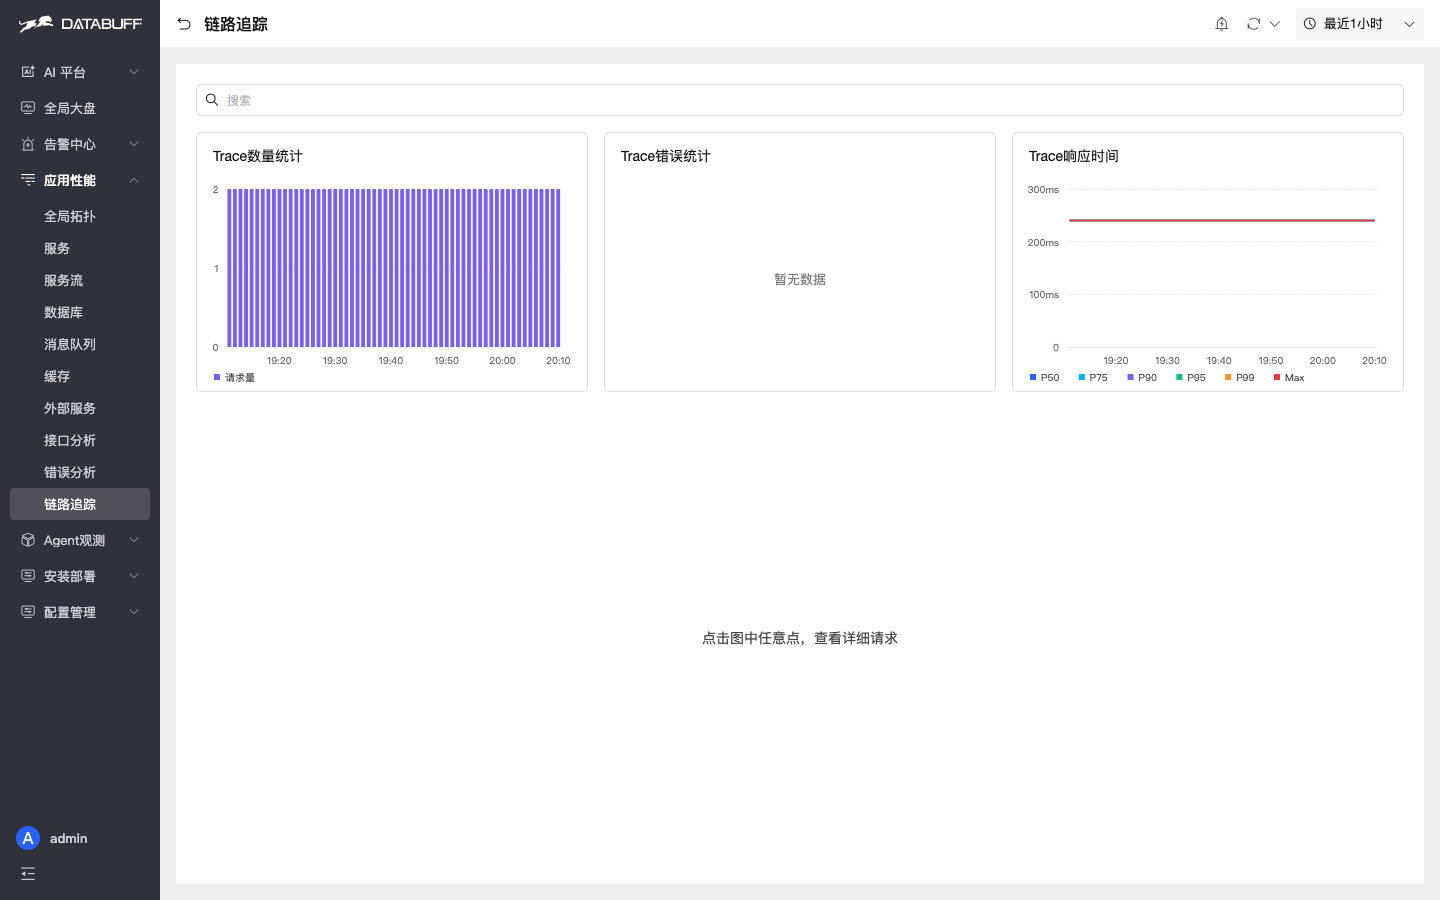
2DataBuff: one goal, an AI squad wires the evidence
Open-source AI Native OTel APM. OTel ingest + Doris storage + multi-agent troubleshooting.
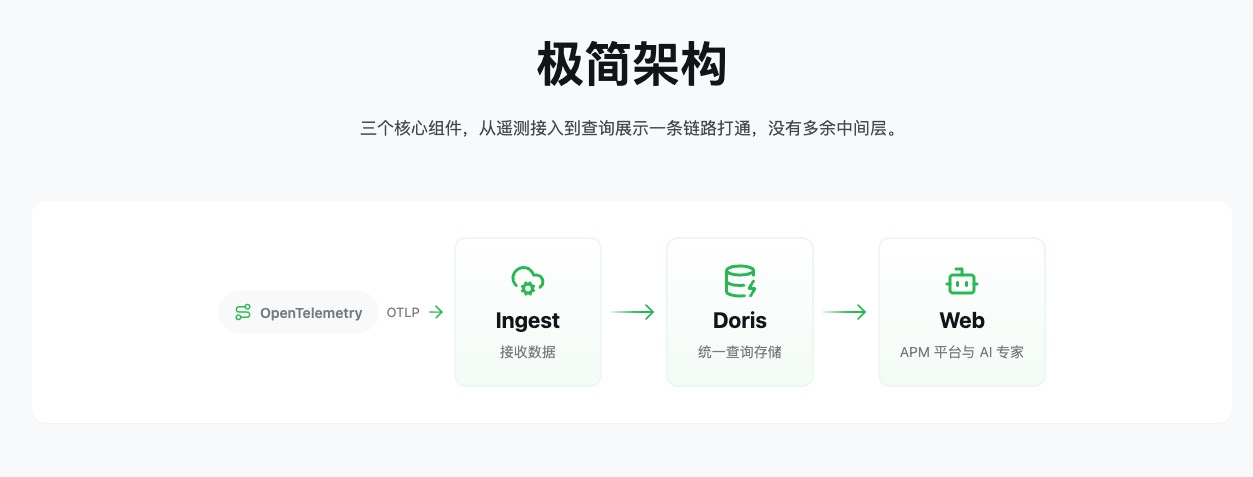
3Up and running in 5 minutes
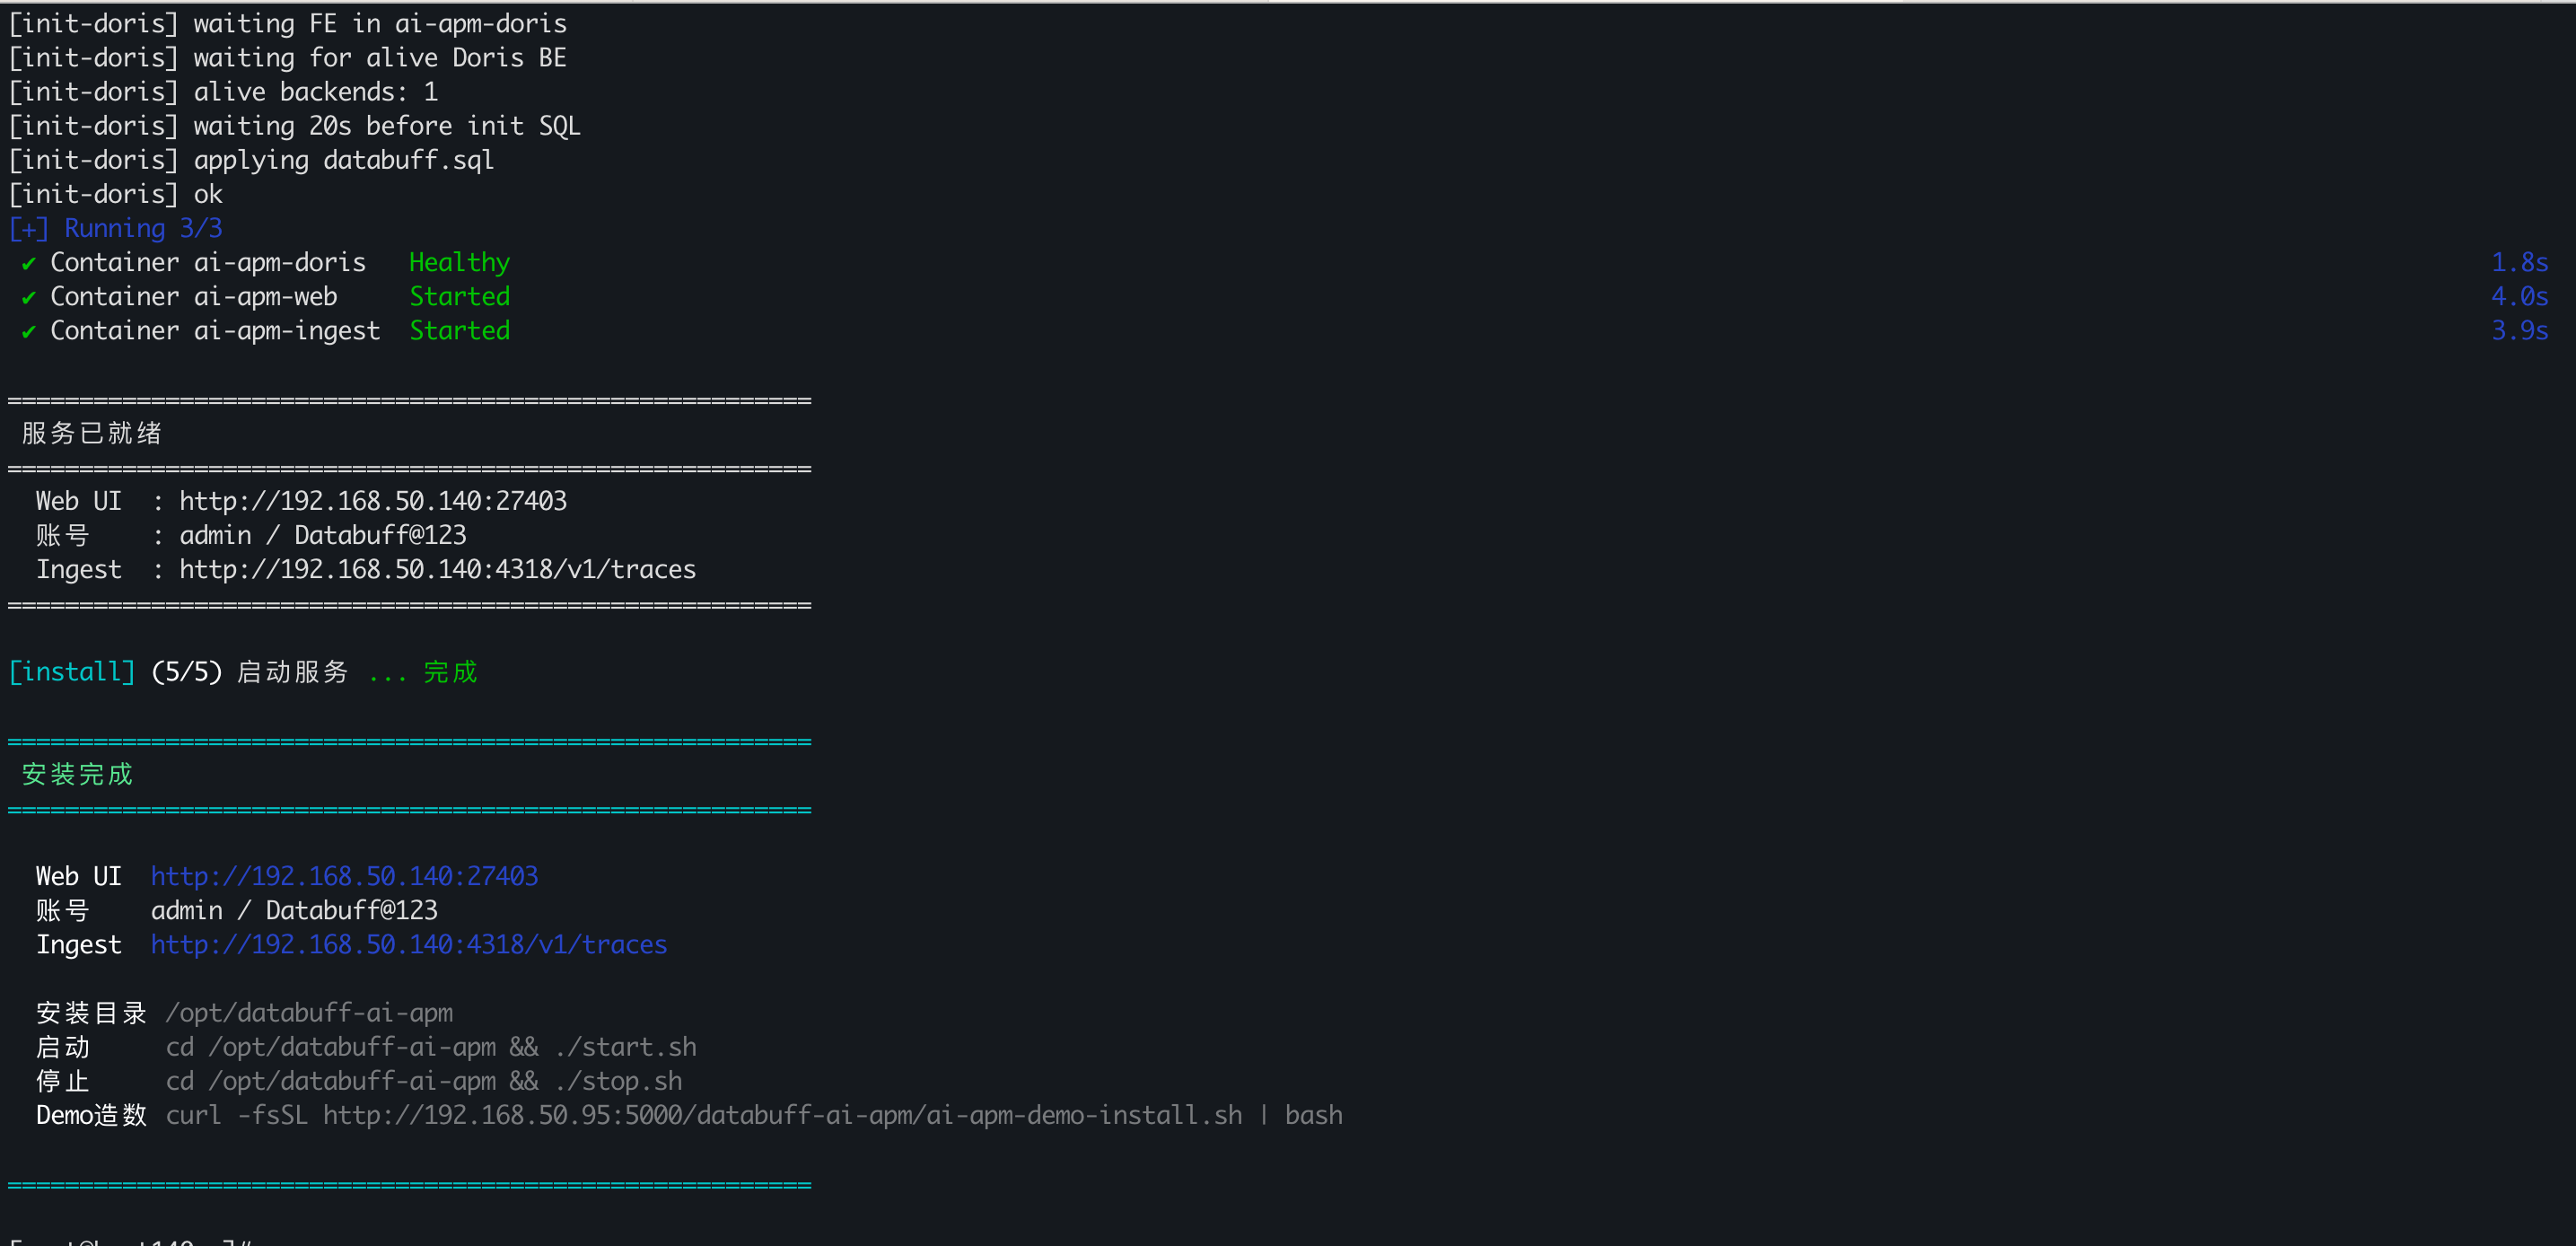
Open http://localhost:27403 (admin / Databuff@123)
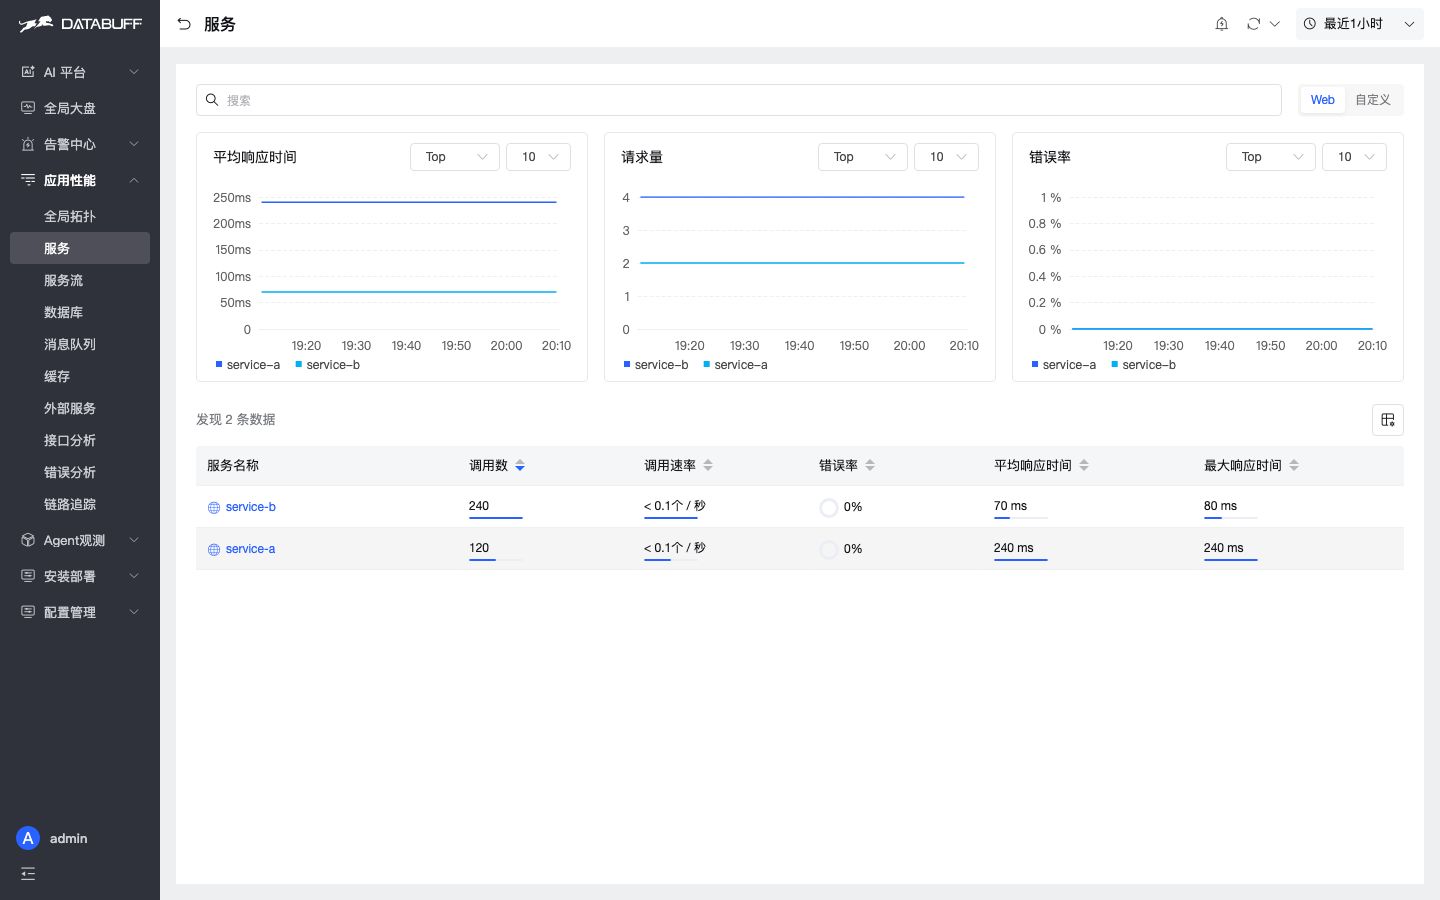
Settings → AI model — add your LLM API key:
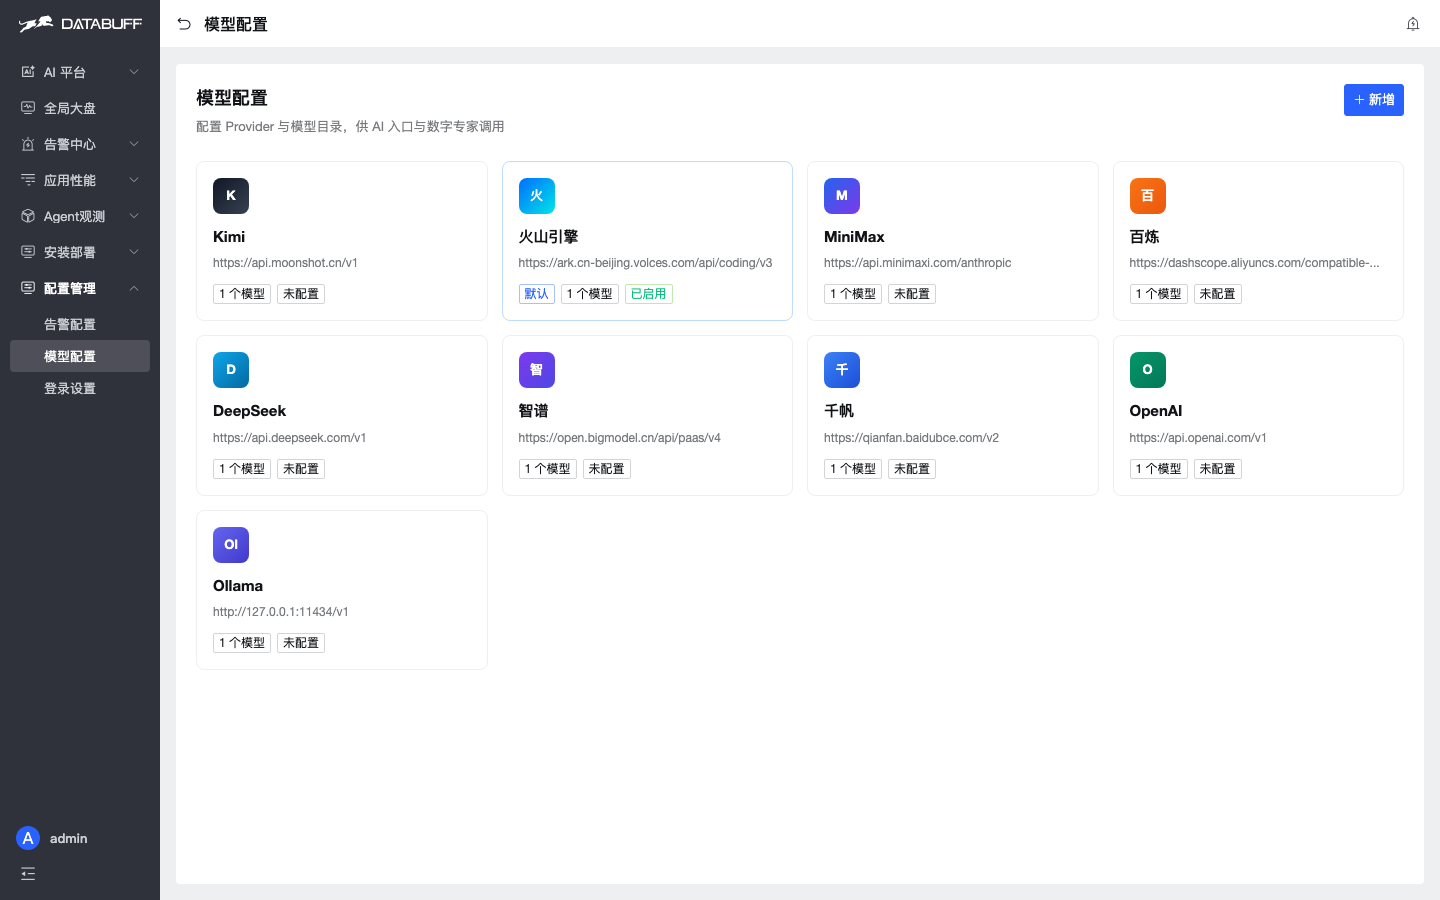
Demo data: curl -fsSL https://databuff.ai/databuff/ai-apm-demo-install.sh | bash
4Back to §1: multi-agent joint ops
Drop the §1 request into the AI chat — all 5 screenshots below are from one conversation (live demo).
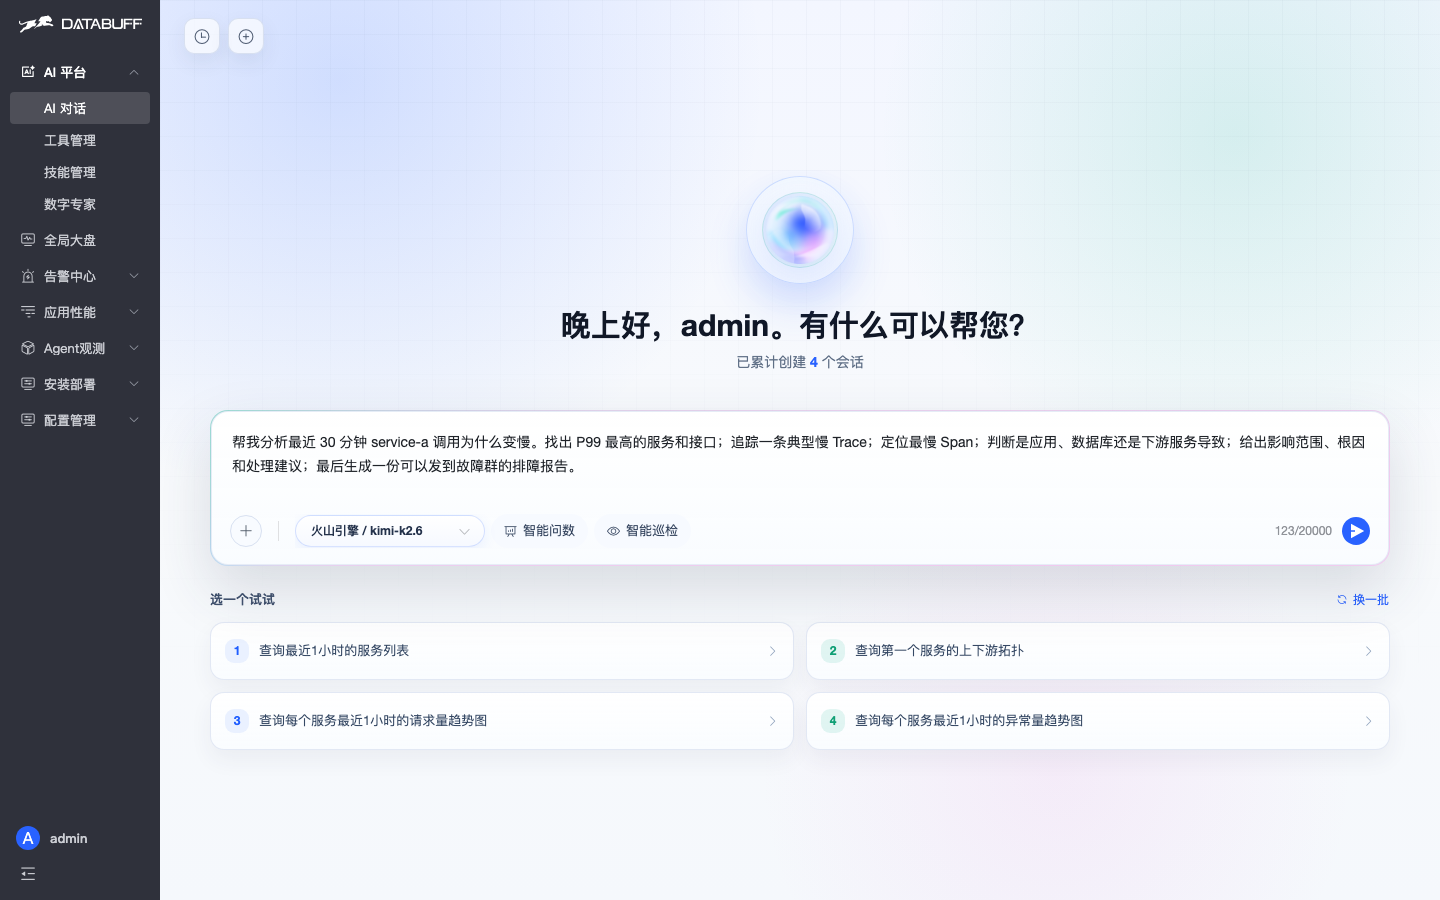
State the goal — P99, traces, root cause, report in one message.
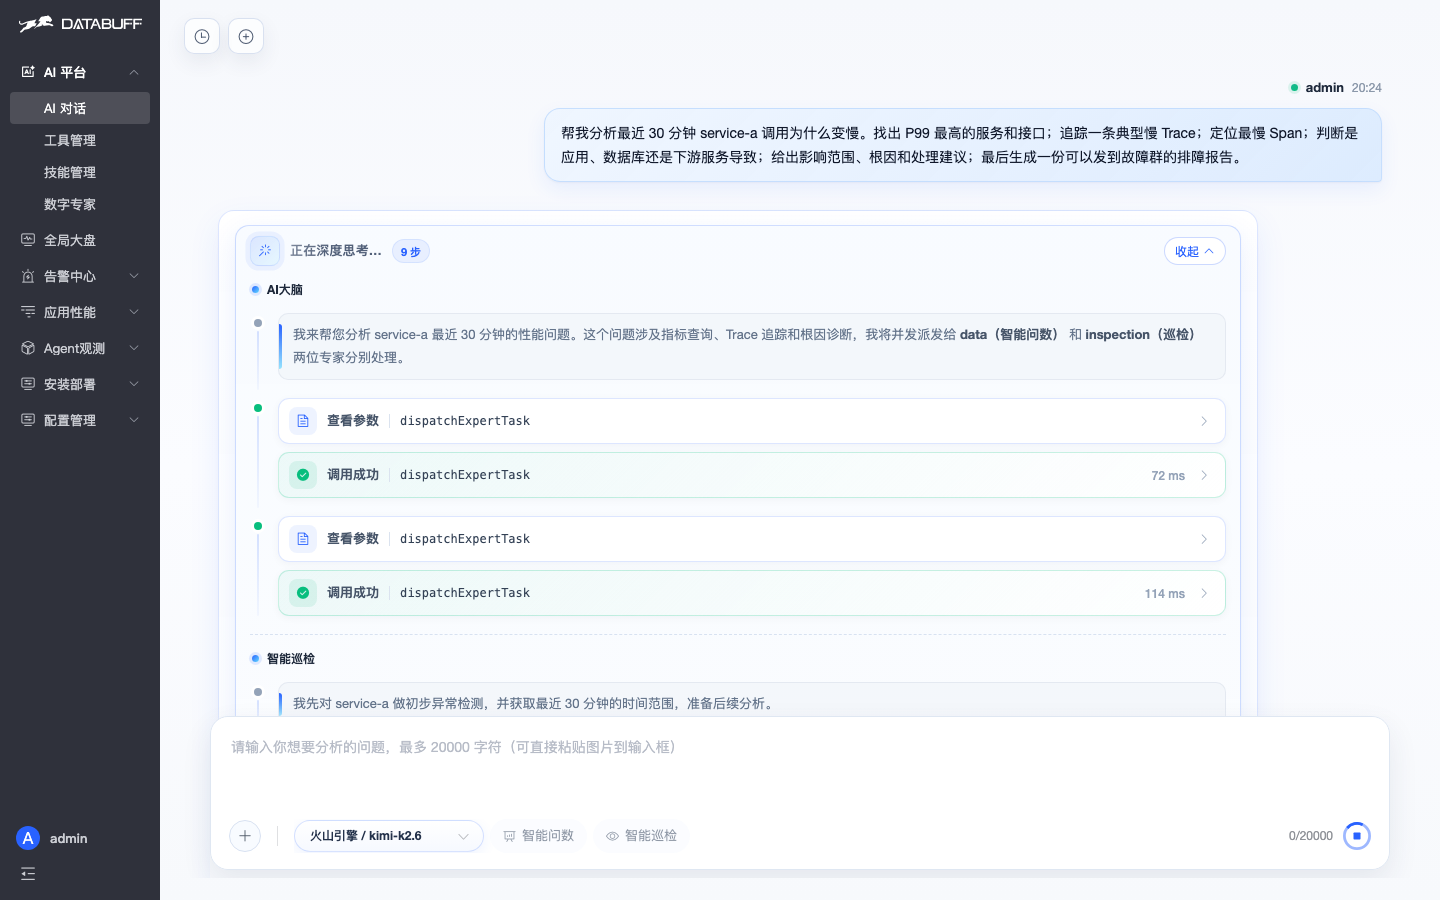
Brain dispatches — dispatchExpertTask to metrics + inspection experts.
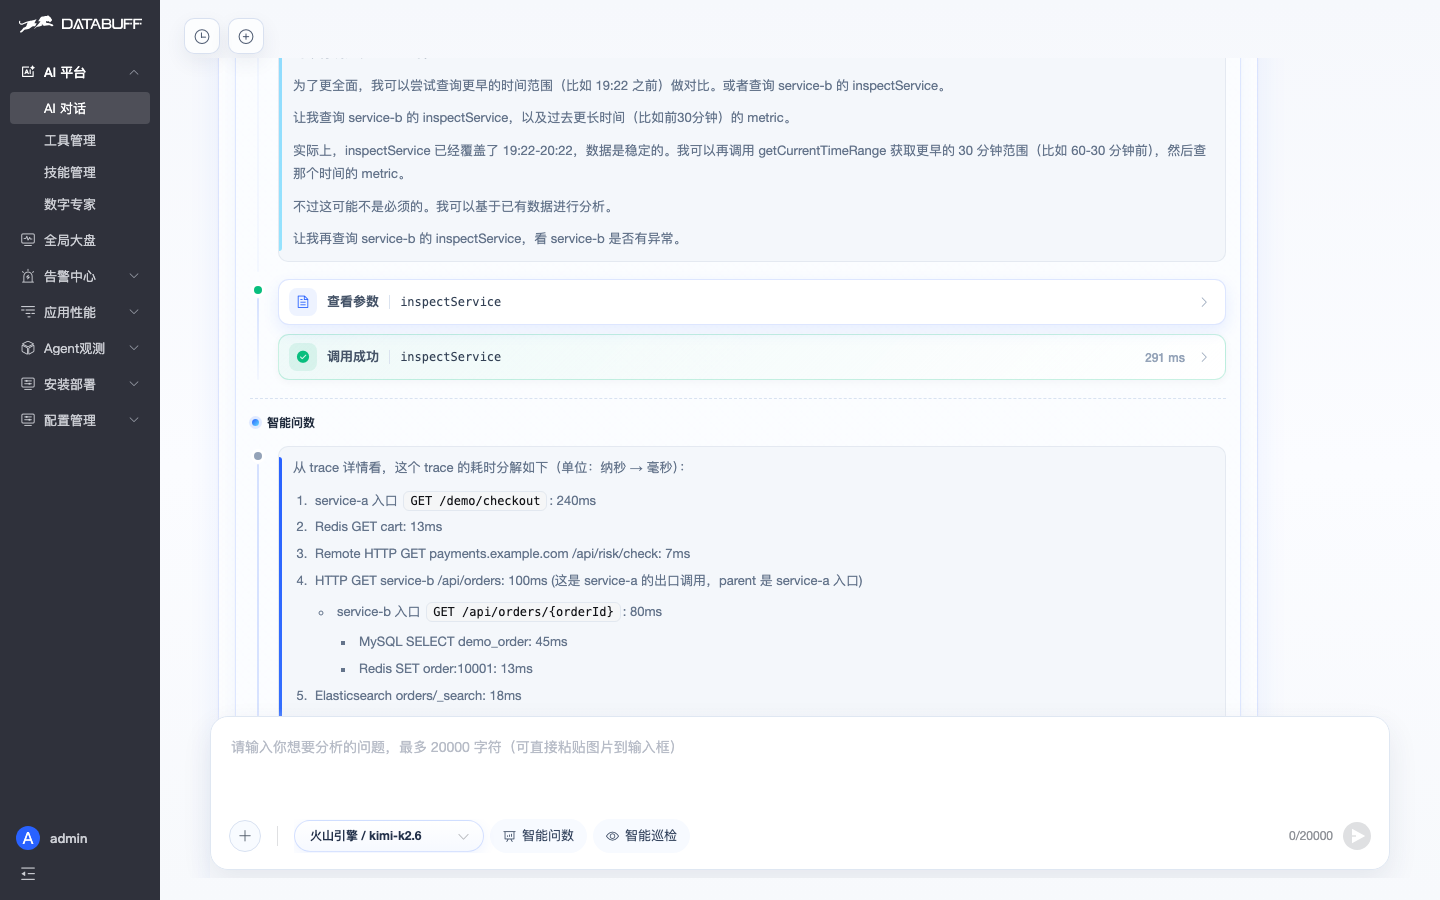
Smart query — breaks down the 240ms entry span.
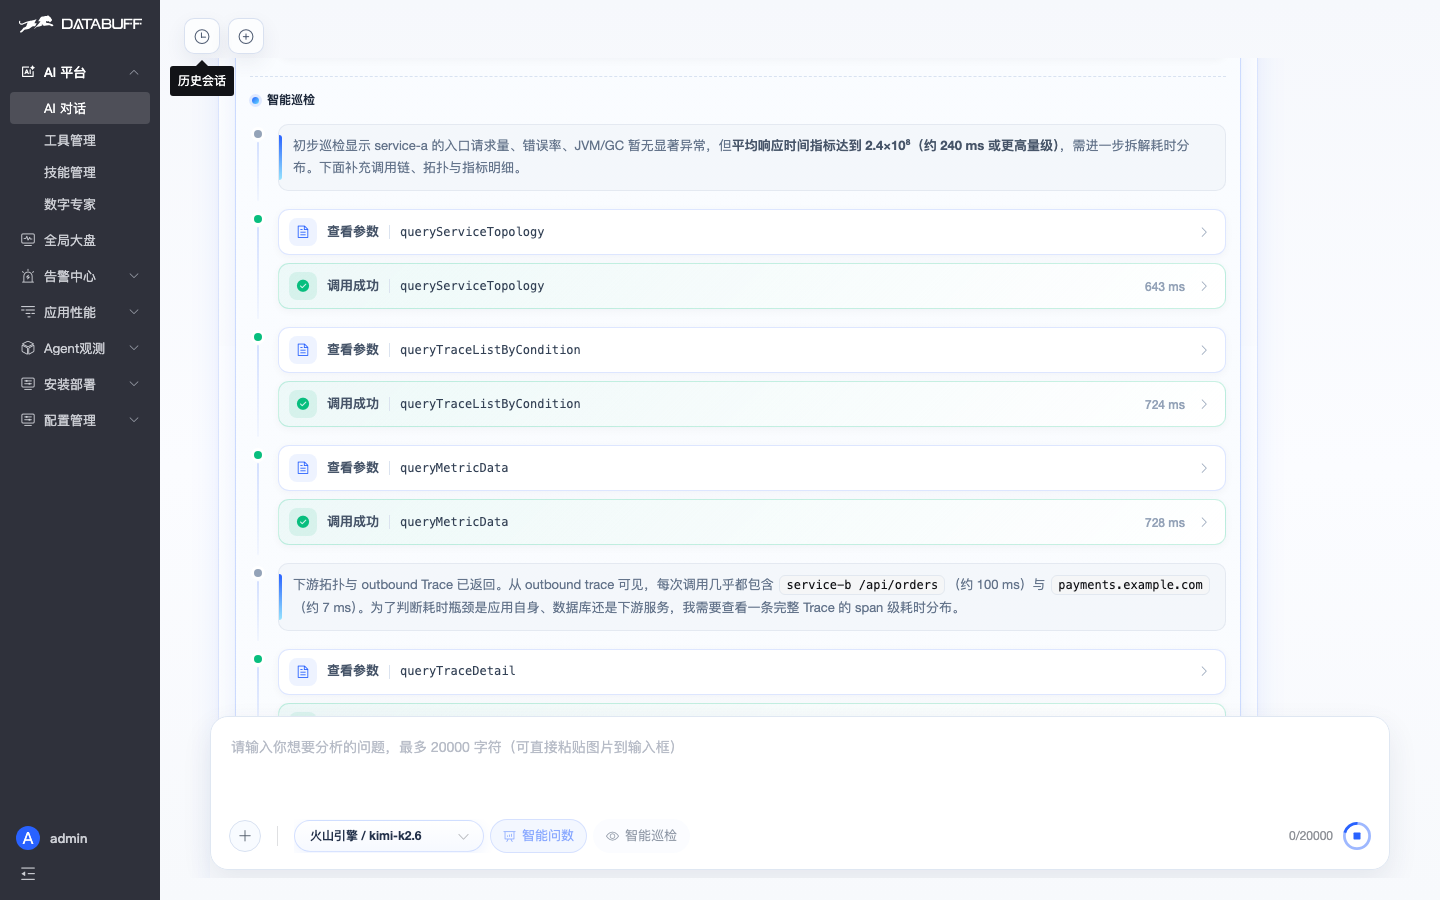
Health inspection — topology + slow traces + metrics to find the bottleneck.
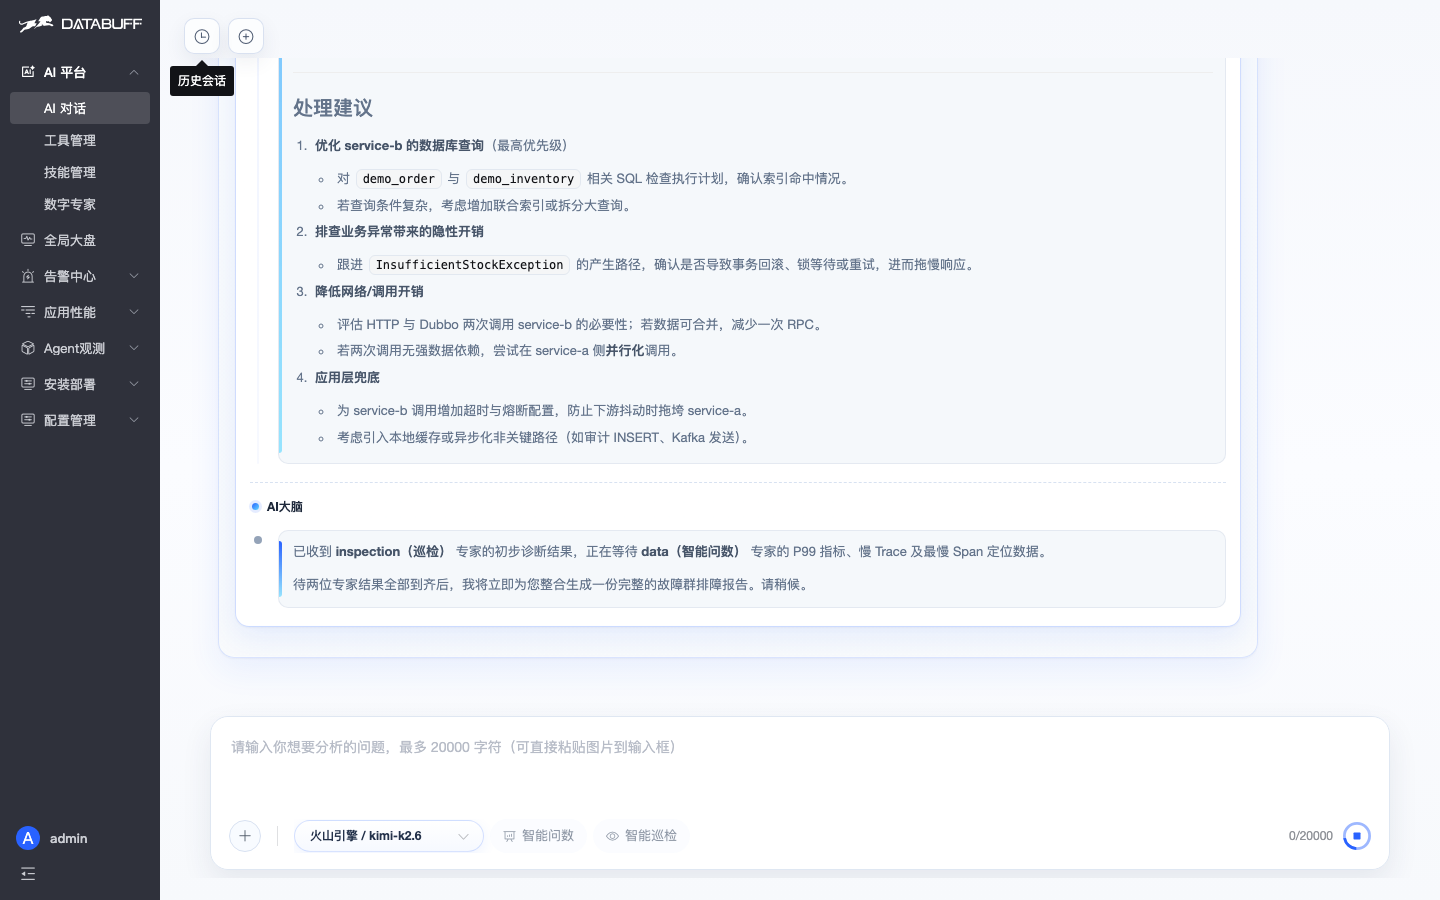
Deliver summary — remediation + incident report.
5From manual stitching to commanding an AI squad
No more five browser tabs. Data stays local; code is open and auditable.
| Module | What you get |
|---|---|
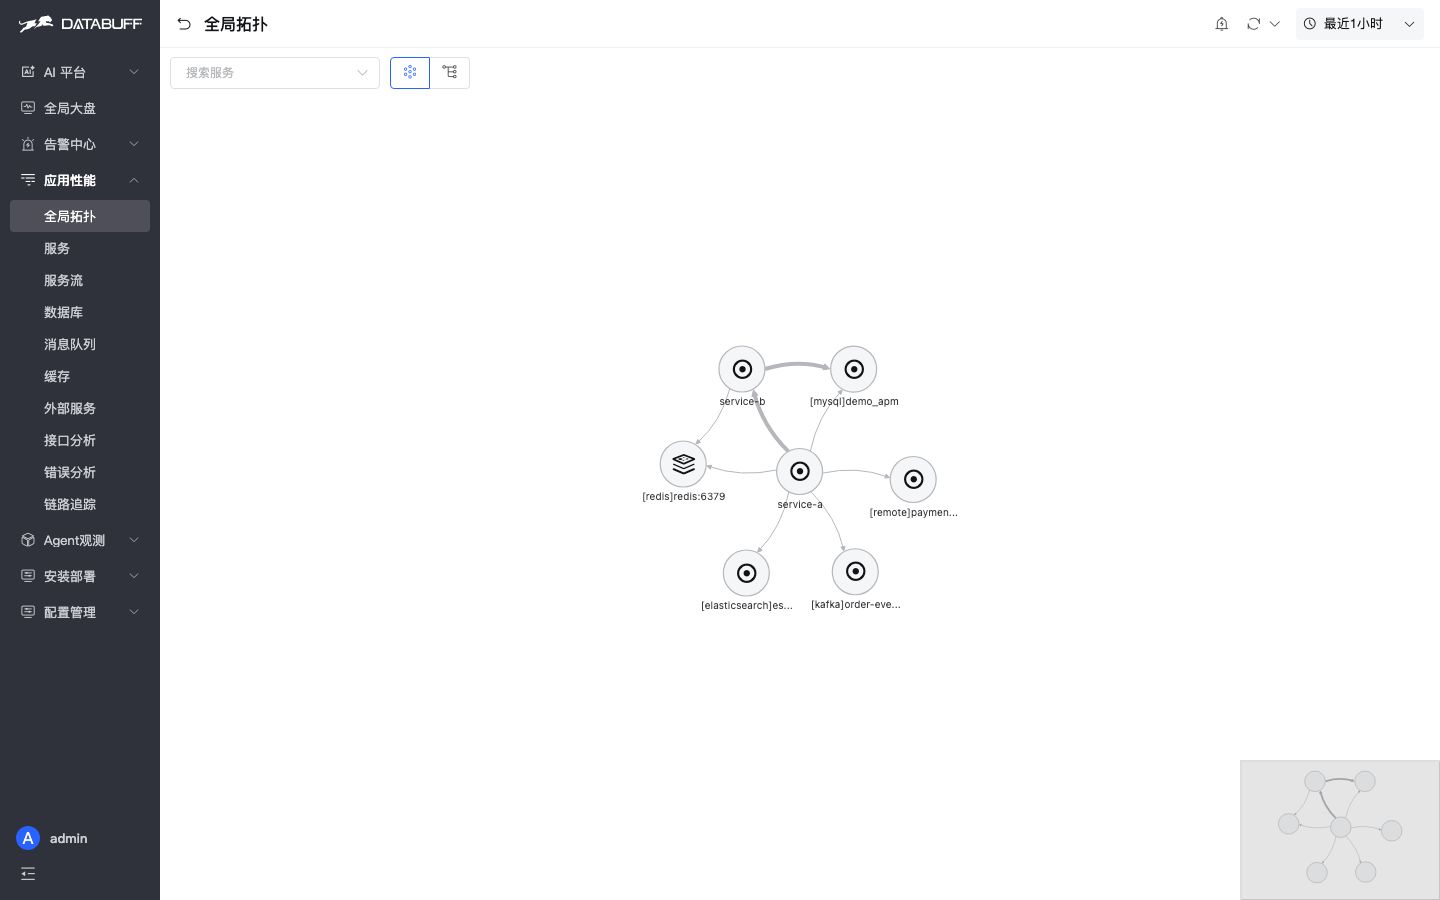
| 📊 APM | Topology, P99, slow-trace drill-down |
| 🤖 AI squad | Multi-agent queries, synthesized reports |
| 🔌 OTel | Unified trace / metric / log storage |
⭐ Deploy your ops AI squad in 5 minutes
curl -fsSL https://databuff.ai/databuff/ai-apm-install.sh | bash
Try: “Analyze why checkout slowed down and draft an incident report.”
View on GitHub →