Deploy Open-Source APM Databuff in 5 Minutes: OpenTelemetry Distributed Tracing Quick Start
Open Source APM · OpenTelemetry · Distributed Tracing · Databuff
摘要:For backend and DevOps engineers new to open-source APM — spin up the platform with one curl command, configure standard OTLP ingestion, and see your first distributed trace in the Web UI.
1Why OTLP Standard + Open-Source APM
Move beyond proprietary agent lock-in — use the OpenTelemetry ecosystem's universal protocol for application performance monitoring
The problem: Traditional APM tools often tie you to their own agents — switching backends means changing SDKs and re-collecting data. OpenTelemetry (OTel) unifies Trace, Metrics, and Logs under the OTLP protocol. On the application side, you only need to configure an Exporter pointing at the backend Ingest endpoint to get application performance monitoring and distributed tracing.
Databuff is an open-source APM that uses OTLP as its sole ingestion standard. The architecture has only three core containers: Ingest, Doris (storage), and Web (platform). Compared to multi-component stacks like SkyWalking, deployment and operations costs are significantly lower.
| Dimension | Proprietary Agent APM | OTLP + Open-Source APM (Databuff) |
|---|---|---|
| Ingestion protocol | Vendor-specific format | OTLP gRPC 4317 / HTTP 4318 |
| Application changes | Bound to specific SDK | Any OTel SDK / Auto-Instrumentation |
| Deployed components | Probe + OAP + Storage + UI, etc. | Ingest + Doris + Web (3 containers) |
| License | Commercial / mixed open source | Fully open source |
The Ingest service exposes the following OTLP ports by default:
Getting started tip: The HTTP 4318 endpoint http://<host>:4318/v1/traces is the most friendly for curl, Demo apps, and most SDKs; gRPC 4317 is better suited for high-throughput production workloads.
2Prerequisites & ai-apm-install.sh Installation
Docker + Compose · run as root · Web UI ready in ~5 minutes
Prerequisites
OS: Linux (amd64 / arm64 supported; the script auto-detects architecture and downloads the matching image bundle) Dependencies: Docker, Docker Compose, curl, tar Permissions: Must run as root (default install directory: /opt/databuff-ai-apm)Memory: ≥ 8 GB available RAM recommended (Doris FE/BE + three service containers)
One-command platform install
The official install script runs a fully automated 5-step flow: check environment → download deployment package → load images → clean old version → install and start.
Public install script URL. After a successful install, the console prints the Web UI URL, default credentials, and Ingest endpoint:
| Service | Port | Purpose |
|---|---|---|
| Web UI | 27403 | APM console, AI platform entry |
| Ingest (OTLP HTTP) | 4318 | Trace / Metrics HTTP ingestion |
| Ingest (OTLP gRPC) | 4317 | Trace / Metrics gRPC ingestion |
| Doris FE | 8030 / 9030 | Storage engine (internal; no direct access needed) |
Common operations commands:
3Demo App Install & OTLP Exporter Configuration
Don't want to modify production code first? Install the Demo to generate sample data, then mirror the config in your own apps
Demo one-click data seeding
After the platform is installed, run the Demo install script. It continuously reports simulated Traces to Ingest — open the UI to see service topology and distributed tracing data.
Public Demo script URL.
The Demo container points to Ingest via environment variables — the same approach you'd use for production apps:
Bring your own app (Java / Spring Boot, OpenTelemetry Java Agent):
Node.js (@opentelemetry/sdk-node) core configuration:
Verify ingestion succeeded: After installing the Demo, wait ~30 seconds (SEED_INTERVAL_SECONDS), then refresh the Web UI service list. If it's still empty, check that firewall rules allow port 4318 and that the Exporter URL includes the /v1/traces suffix (HTTP protocol).
4Web UI Verification: Service List → Trace Explorer
Log in at http://<host>:27403 and follow the topology → metrics → traces path to confirm data is visible
Step 1 · Service List
Go to Application Performance → Services to see Demo-generated services like service-a and service-b, along with request count, error rate, and response time — the entry view for application performance monitoring.
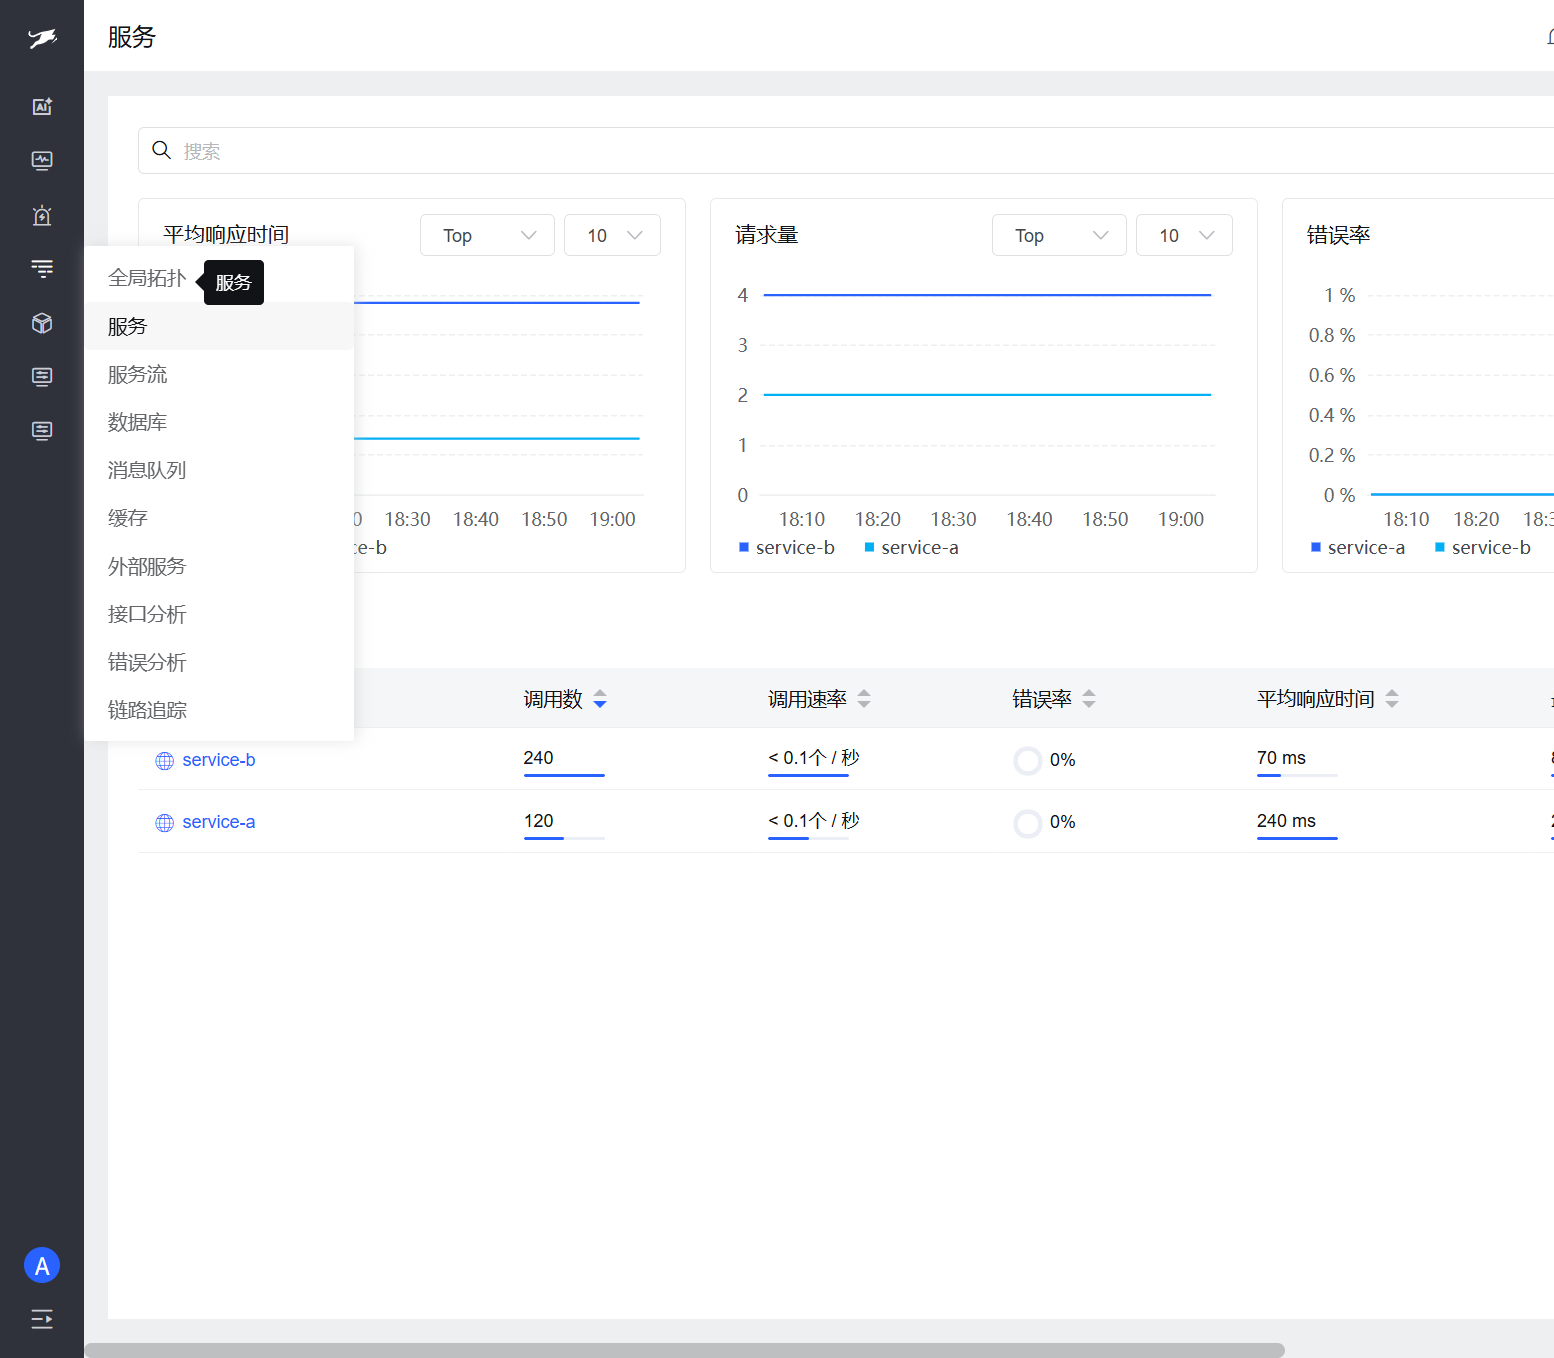
Databuff service list: request count, error rate, response time
Step 2 · Global Dashboard
Open the Global Dashboard to view per-minute health timelines and alert distribution across services — a quick snapshot of overall system health.
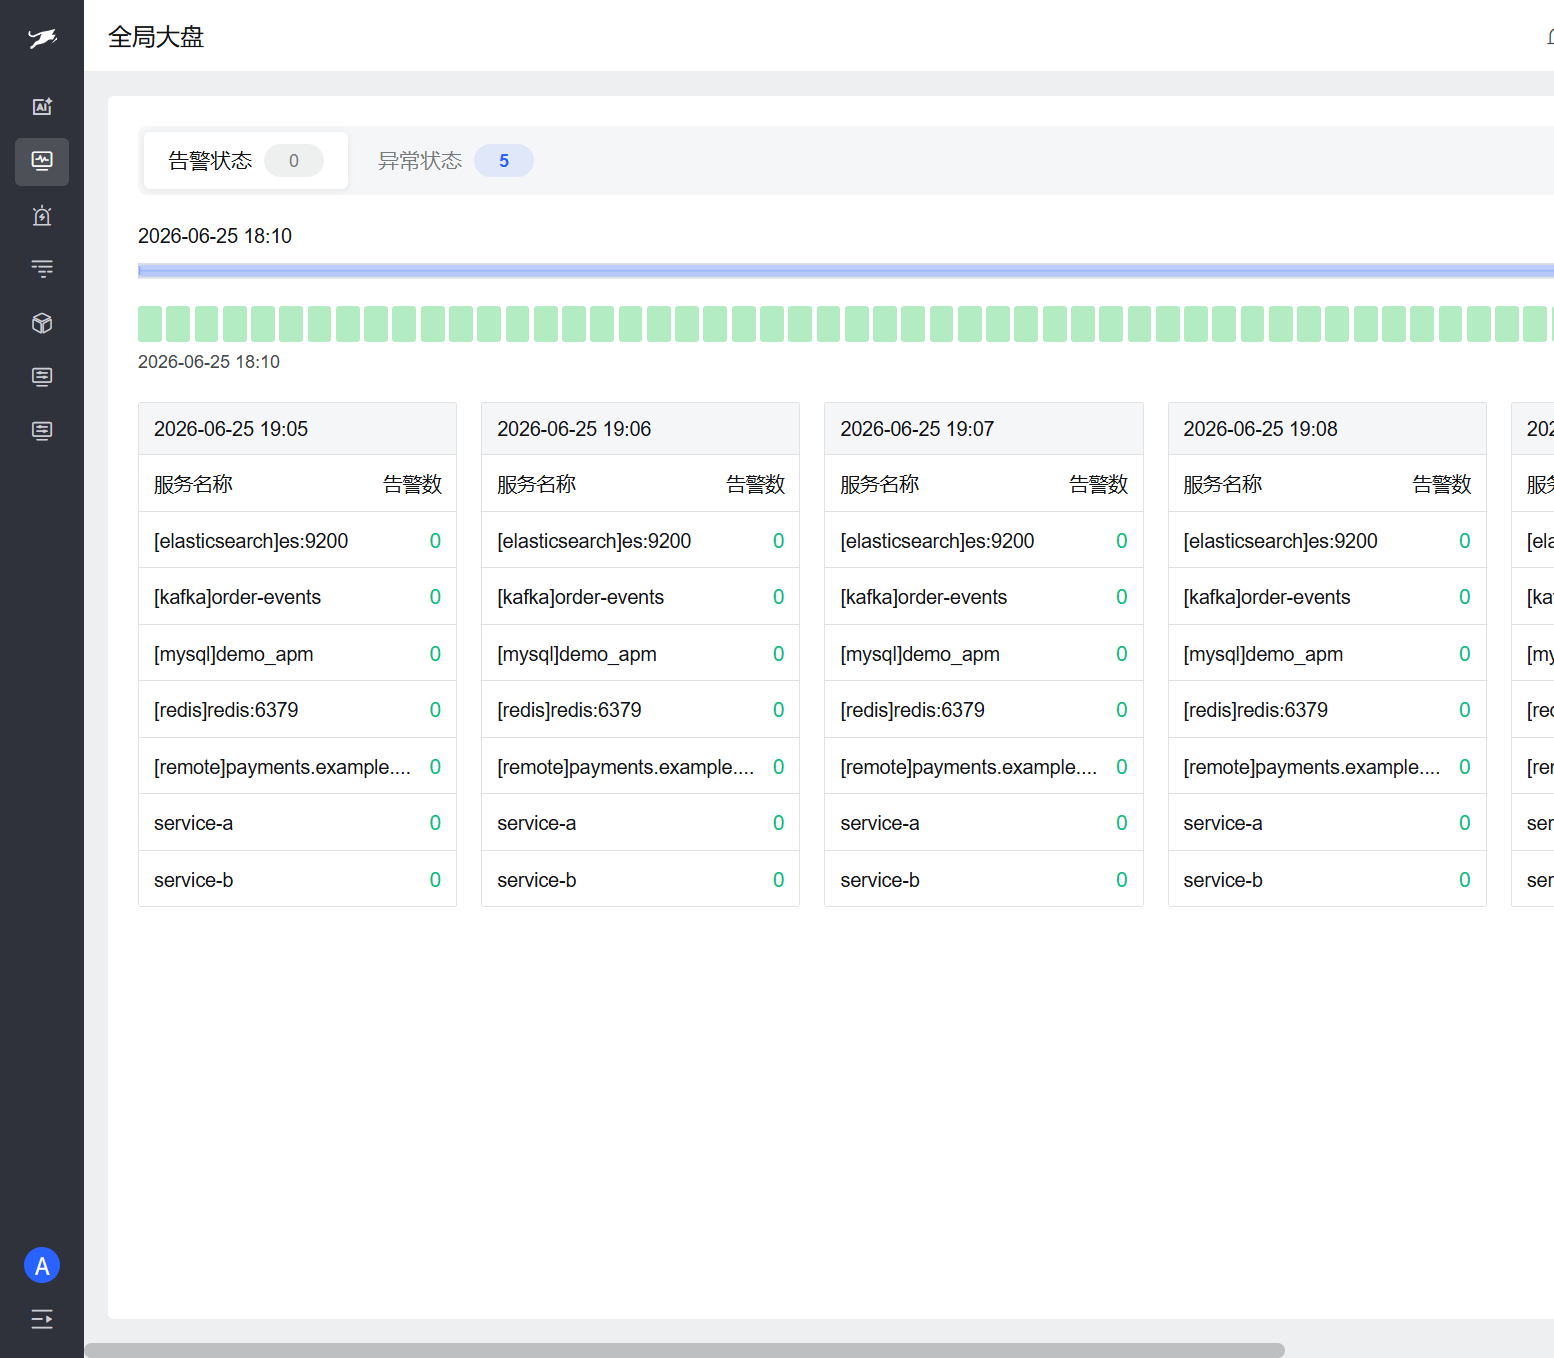
Databuff global dashboard
Step 3 · First Trace in Trace Explorer
Go to Application Performance → Trace Explorer, select the last 1 hour, and you'll see Trace count distribution and response time scatter plots. Click any Trace to drill down into the Span waterfall view — completing the loop from "deploy" to "see your first distributed trace".
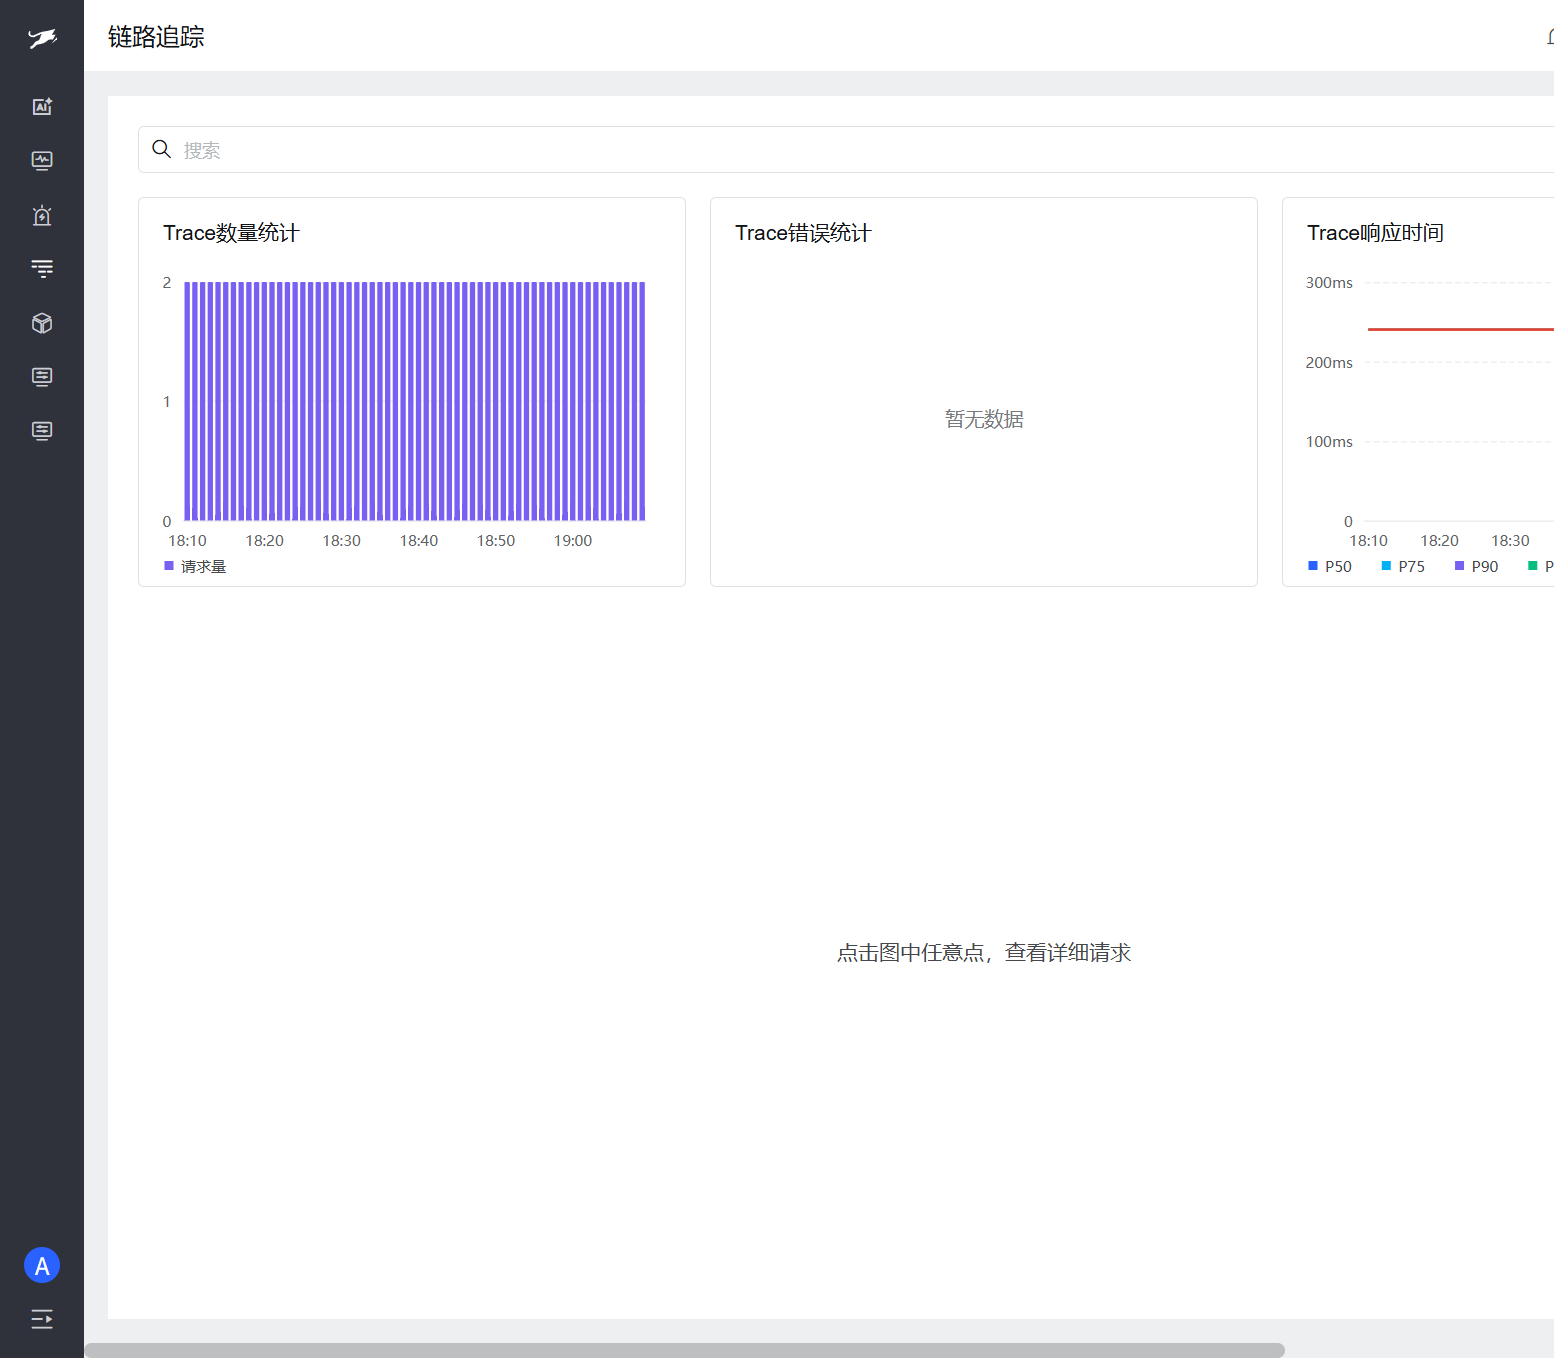
Databuff trace explorer list
Recommended troubleshooting path: Global topology to spot abnormal nodes → service details to confirm metrics → trace explorer to pinpoint slow Spans. See the official docs "Application Performance" module for details.
5FAQ
The three most common questions during deployment and ingestion setup
| Question | Cause / Resolution |
|---|---|
| Ports 4317 / 4318 not reachable | Check cloud security groups / iptables rules; inside the container run curl http://127.0.0.1:4318/health to confirm Ingest health; for cross-host reporting, set the Exporter address to the host IP rather than Docker internal hostnames |
| Is 8 GB RAM enough? | Sufficient for local dev / Demo validation. Doris FE 768m + BE 3G + ingest/web each 384m ≈ 5 GB container limits total; production recommends 16 GB+ with larger Doris heap settings |
| Does AI analytics need an LLM Key? | APM tracing does not depend on an LLM — service list, topology, and Traces work fully without a Key. The AI platform requires an API Key in Settings → Model Configuration to enable smart Q&A / inspection (optional) |
| Install script reports Docker unavailable | Confirm docker info works and you're running as root; Compose v2+ required (script includes ensure_compose_cli check) |
| Service list is empty | Install the Demo first or confirm app Exporter points to the correct Ingest; wait 1–2 minutes for minute-level aggregation; check that OTEL_SERVICE_NAME is set |
6References
[1] : https://databuff.ai/databuff/ai-apm-install.sh [2] : https://databuff.ai/databuff/ai-apm-demo-install.sh [3] : https://github.com/databufflabs/databuff
◆ ◆ ◆