The OpenTelemetry community packaged eBPF trace collection as OBI (OpenTelemetry eBPF Instrumentation). On Kubernetes you run a DaemonSet per node; eBPF watches HTTP calls between local services, assembles traces, and exports them — app Pods stay unchanged. The Docker image is usually otel/ebpf-instrument. Project: github.com/open-telemetry/opentelemetry-ebpf-instrumentation.
Where do traces land? DataBuff is an open-source APM / observability platform for services, topology, and call chains. Point OBI at DataBuff and you're done. Project: github.com/databufflabs/databuff.
ns
obi · app Pods untouched · collector Pod uses eBPF for local HTTP → export to DataBuffFollow the steps below. If you don't have DataBuff yet, start at step 1. When editing YAML, keep app namespace and ingest host straight.
curl -fsSL https://databuff.ai/databuff/ai-apm-k8s-install.sh | bash
kubectl -n databuff get pods
All Pods Running and the UI opens — you're good.
On each app node:
uname -r
ls /sys/kernel/btf/vmlinux
Kernel 5.8+ recommended; the second command must list a file. Without BTF, collector Pods won't start or won't capture.
Use otel/ebpf-instrument:latest (latest worked in our test; pin a version in production). Offline clusters: pull and docker load on nodes first.
Apply the YAML once; replace YOUR_APP_NAMESPACE with your app namespace and YOUR_DATABUFF_HOST with ai-apm-ingest.databuff.svc. hostPID and privileged are required to see host processes and attach eBPF.
# Full YAML in DataBuff docs / OBI examples
# Key bits:
#   discovery.instrument.k8s_namespace: YOUR_APP_NAMESPACE
#   ebpf.context_propagation: headers
#   otel_traces_export.endpoint: http://YOUR_DATABUFF_HOST:4318
kubectl apply -f obi.yaml
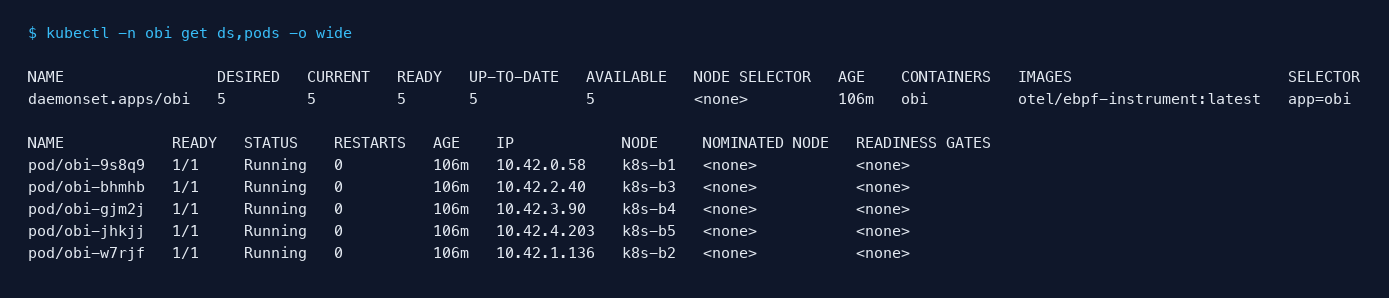
kubectl -n obi get ds,pods -o wide
DESIRED / READY should match node count; every pod/obi-* should be Running.
kubectl -n obi logs -l app=obi --tail=80 | grep -iE "instrumenting|process|error" | head -30
Look for instrumenting process. If missing, check the namespace placeholder and whether apps are running.
for i in $(seq 1 80); do
  curl -sS -m 2 "http://your-app-url/" >/dev/null || true
  sleep 0.2
done
Run for a minute or two, then open DataBuff.
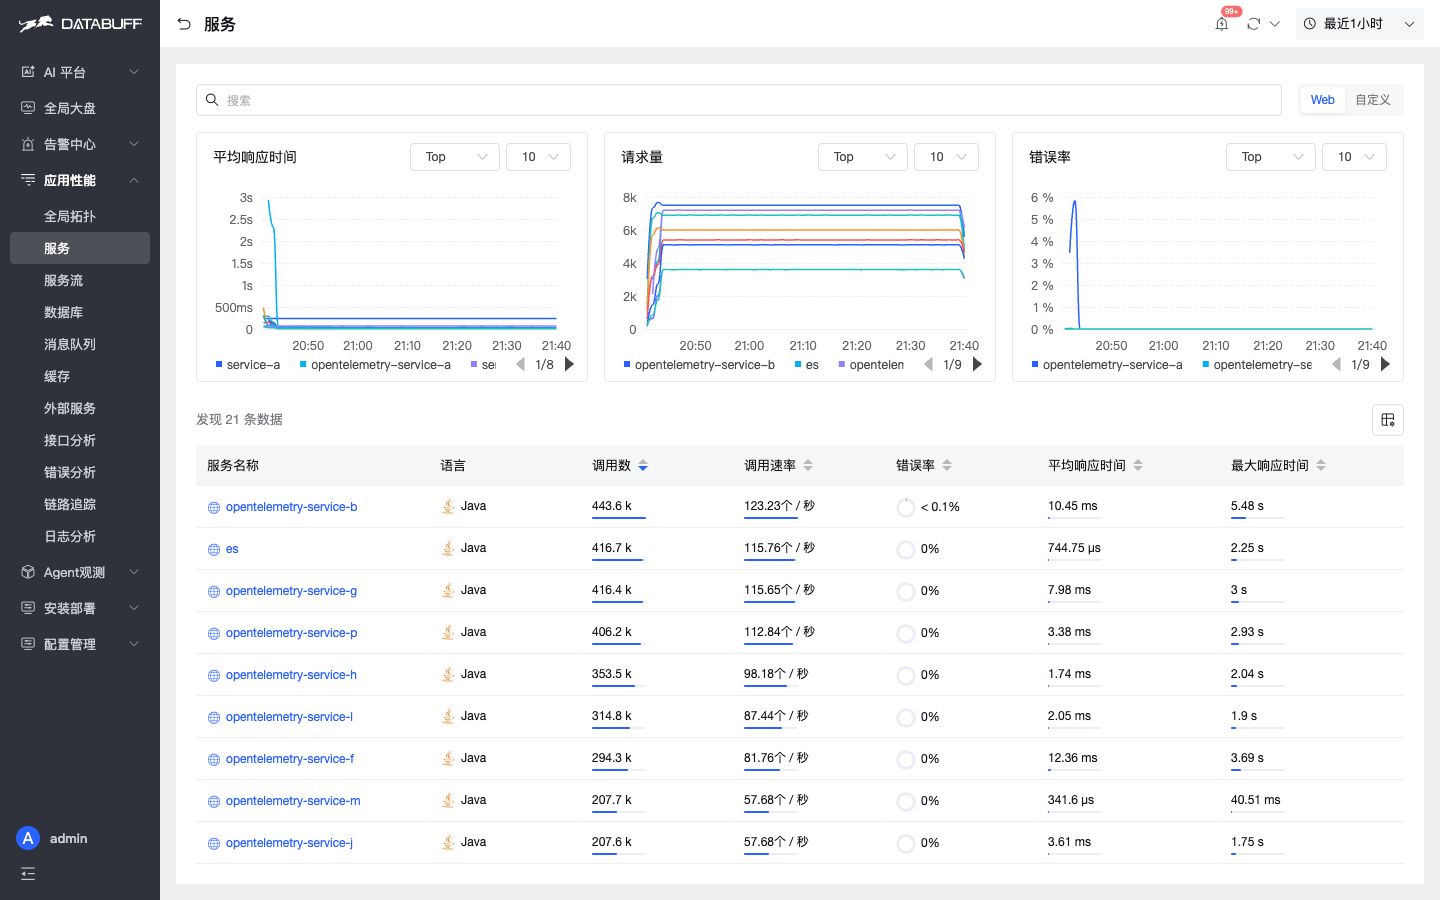
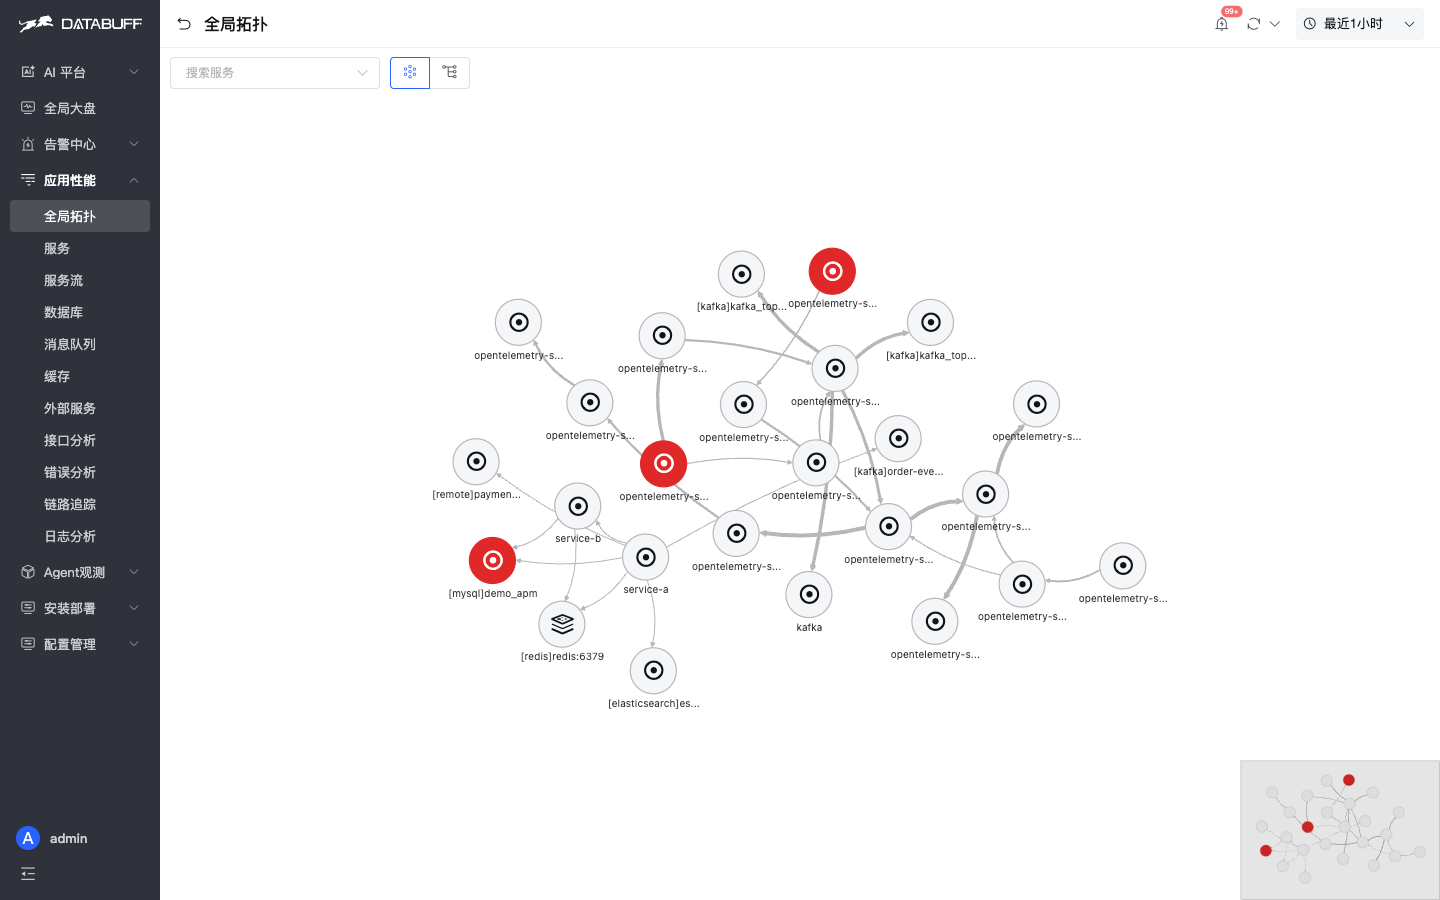
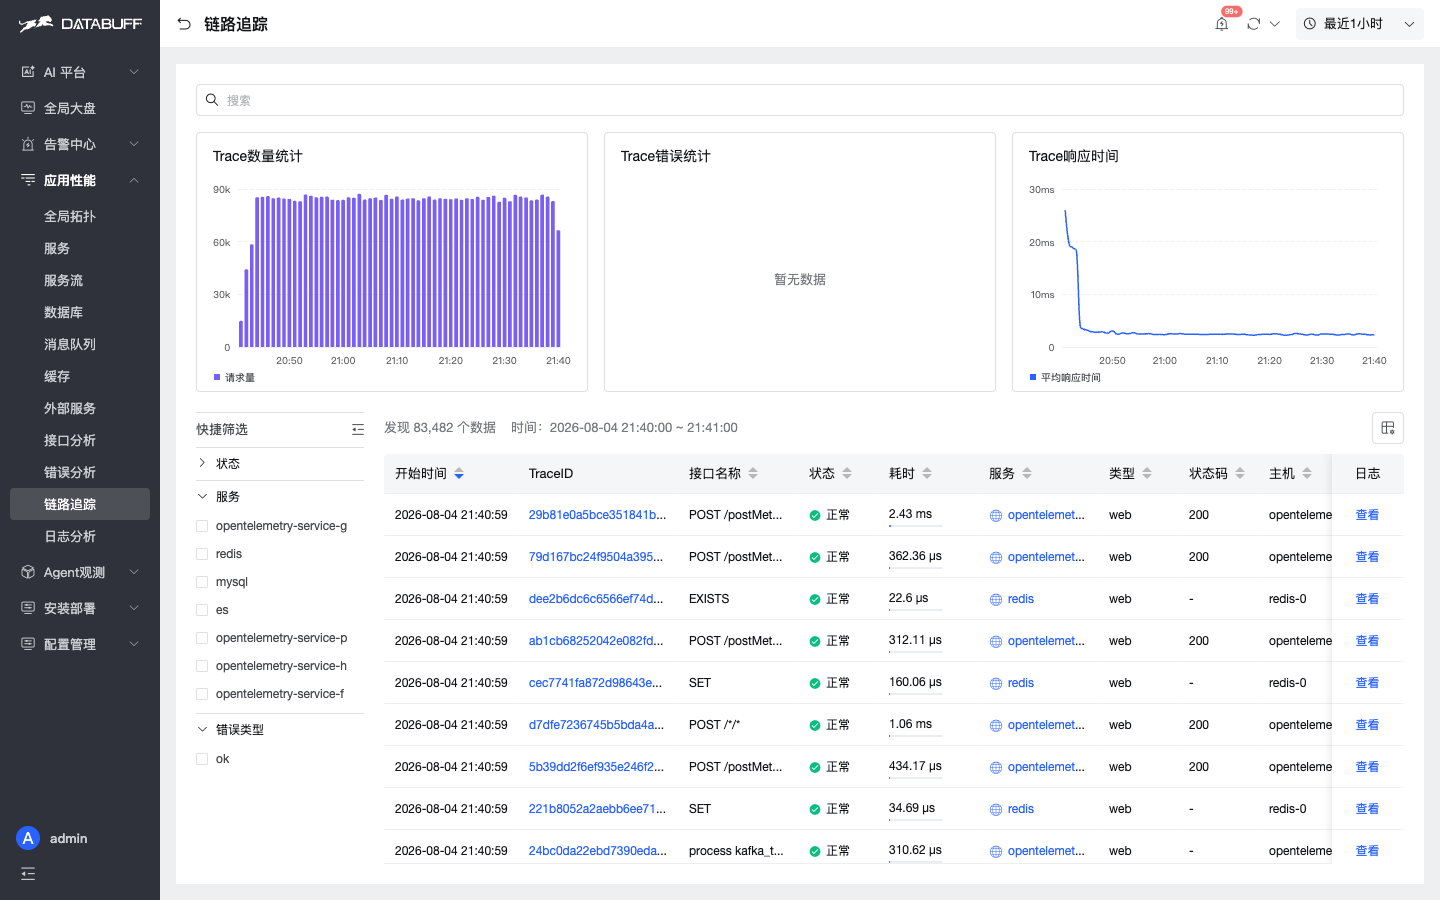
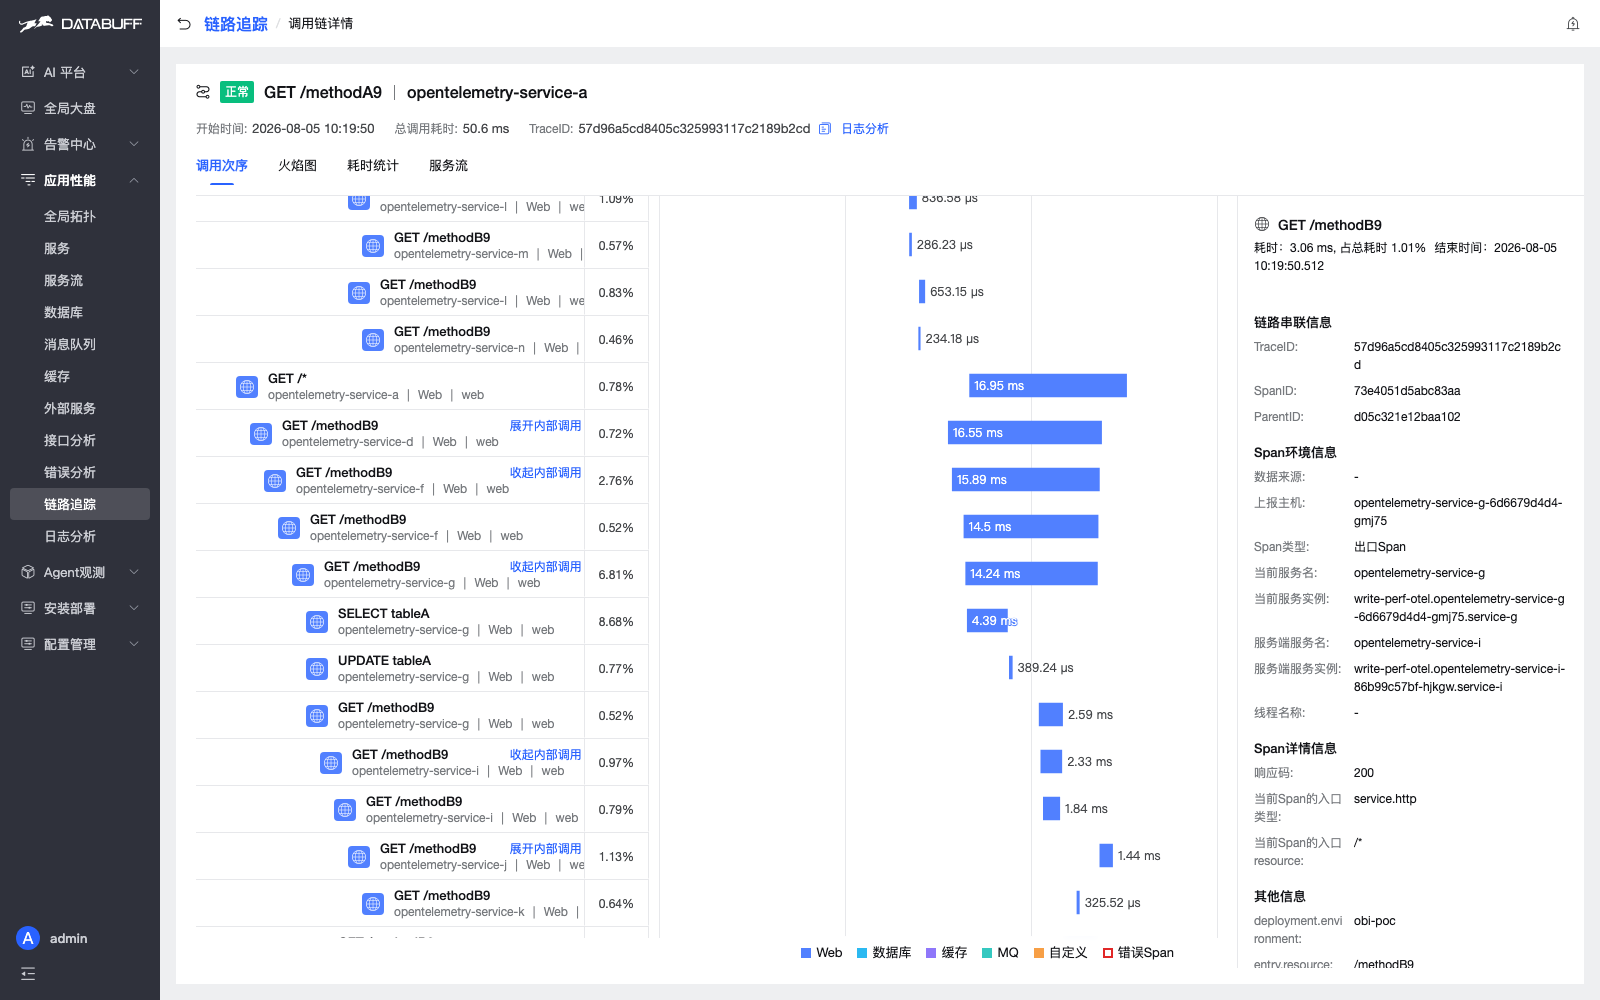
Open APM → Services, search for your app, then topology and trace detail.
| Approach | Better when |
|---|---|
| eBPF + DaemonSet (this post) | No injection or restart; HTTP-first view; polyglot clusters need a quick layer |
| Language Agent (e.g. javaagent) | Dubbo, slow SQL, method stacks; kernel < 5.8 or no BTF |
Limitations — not a silver bullet:
- No Dubbo — OBI targets HTTP / gRPC boundaries; Dubbo RPC isn't captured yet; use a language Agent for that.
- No method stacks or custom business spans — it's sidecar observation outside your process.
- Collector Pod must be privileged; kernel 5.8+ and BTF required.
We started with OBI; fill Dubbo and method-stack gaps with Agents later.
It never enters your code. The per-node DaemonSet watches local HTTP with eBPF, builds spans in user space, and exports to DataBuff. javaagent hooks inside the process; OBI observes from the node edge — one DaemonSet covers many languages.
Context propagation. YAML sets context_propagation: headers. No app code changes — read/write happens on HTTP messages at the node edge:
- ① Read headers on ingress — scan for
Traceparent:; reuse upstream traceId/spanId or start a new trace. - ② Correlate locally — match outbound HTTP to the inbound request via thread/socket cues.
- ③ Write headers on egress — sockmap
sk_msginserts this hop'sTraceparentafter the request line; the next hop reads it on ingress.
HTTPS can't rewrite HTTP headers; there's a separate TCP Option path upstream. This post uses headers — plain HTTP as above.