Engineering Blog

3 min read

5 Ops Tasks That Take Half an Hour — Ops Expert Finishes in 3 Minutes

Five test-env ops chores: OTel blank, CrashLoop, JVM flags, port conflicts, flame graphs — DIY SSH often 15–40 minutes; Ops Expert lands conclusions in 1–3 minutes, with three screenshots per scenario.

On-call pain is rarely that a problem is “too hard.” It’s that you already know what to check — and still have to SSH in and type every command yourself. These five show up in almost every test environment:

  1. OTel won’t connect / no data — SDK is configured, the platform is blank; you guess endpoint, port, or a dead process.
  2. Container keeps restarting — you see Restarting, dare not poke randomly, and crawling logs inside the container is slow.
  3. Inspect real Java JVM flags — startup args, container limits, and effective values disagree; you bounce between jinfo / jcmd.
  4. Port in use, service won’t startlsof / ss once, then make sure you don’t kill the wrong process.
  5. CPU hotspots — flame-graph tooling slips your mind; sampling configs take half a day before a chart appears.

Solo, these jobs often take 15–40 minutes (find the host, log in, recall commands, reconcile the conclusion). With DataBuff Ops Expert, the same work usually lands in 1–3 minutes: open AI Platform → AI Chat, pick Ops Expert, describe the symptom in plain language.

ScenarioDIY SSH (typical)Ops Expert (measured)
OTel won’t connectendpoint / port / process ~15–25 min~1–2 min to a conclusion
Container restart looplog diving ~20–40 min~2–3 min to find & fix
JVM flagsjinfo / jcmd ~10–20 min~1 min
Port conflictss / lsof ~5–15 min~1 min
Flame graphtooling + sample ~20–40 min~2–3 min

Walkthrough below: three shots per scenario — your promptOps Expert at workthe conclusion.

1. OpenTelemetry won’t connect / no data

Example prompt:

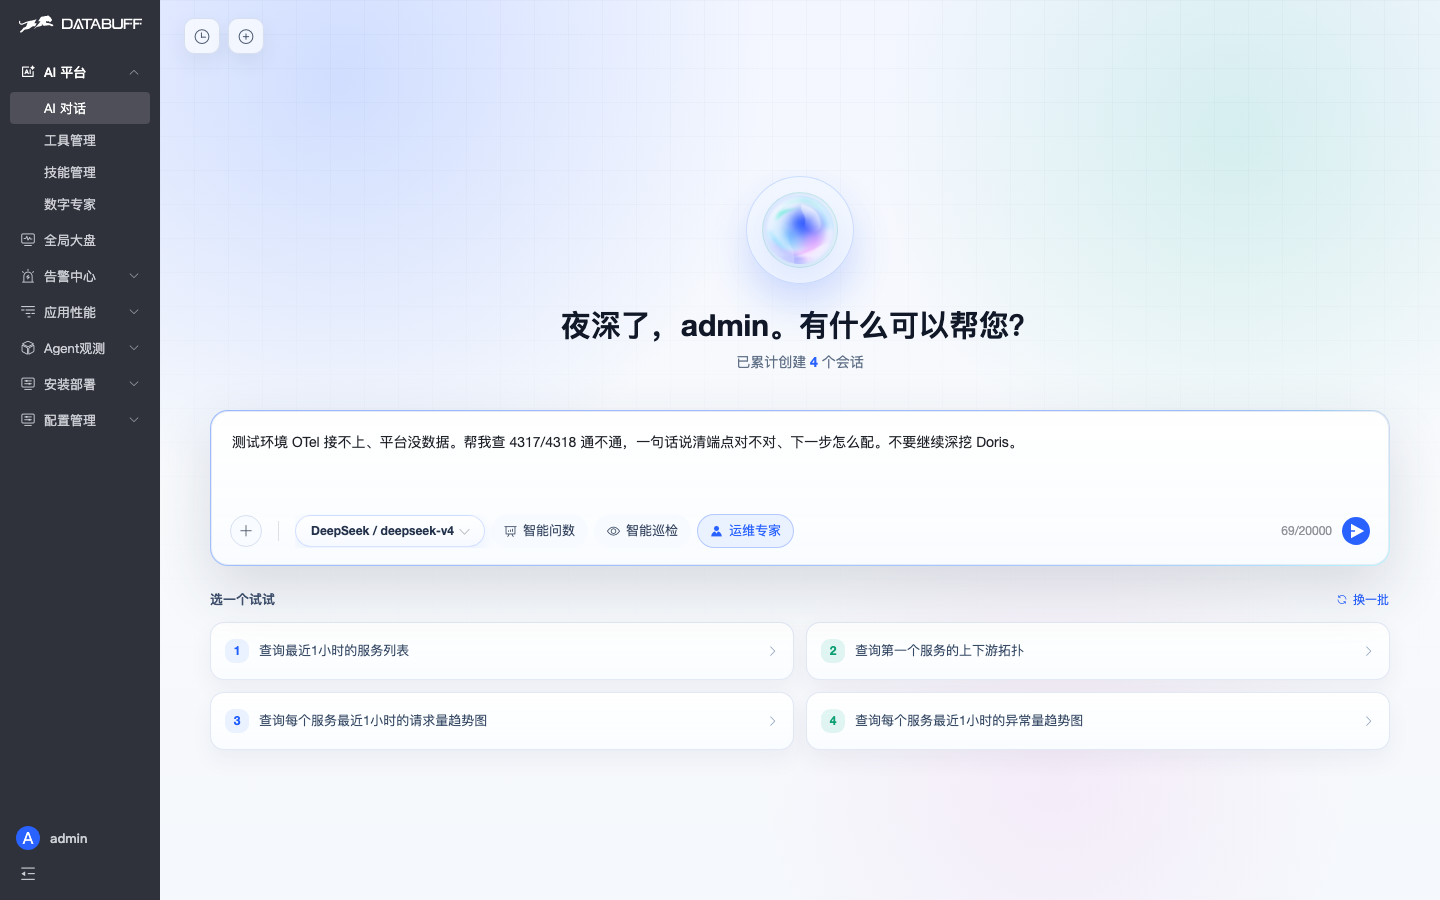
Test env OTel won’t connect and the platform has no data. Check whether 4317/4318 are reachable and tell me in one sentence if the endpoint is correct.
1 Prompt2 Process3 Conclusion
User asks Ops Expert about OTel ingest
① User prompt
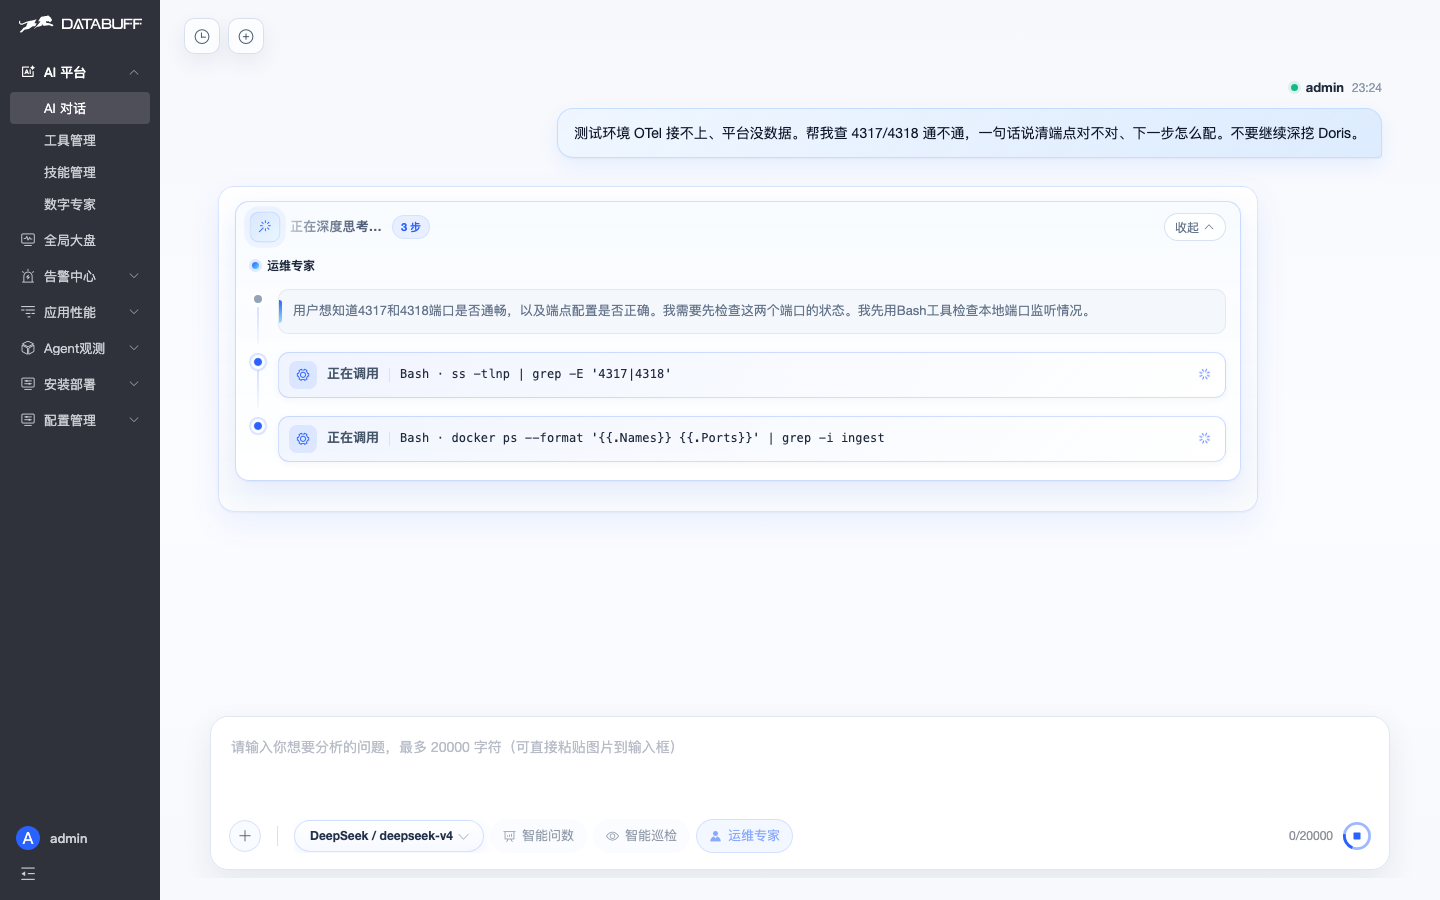
Ops Expert running OTel investigation
② Ops Expert process
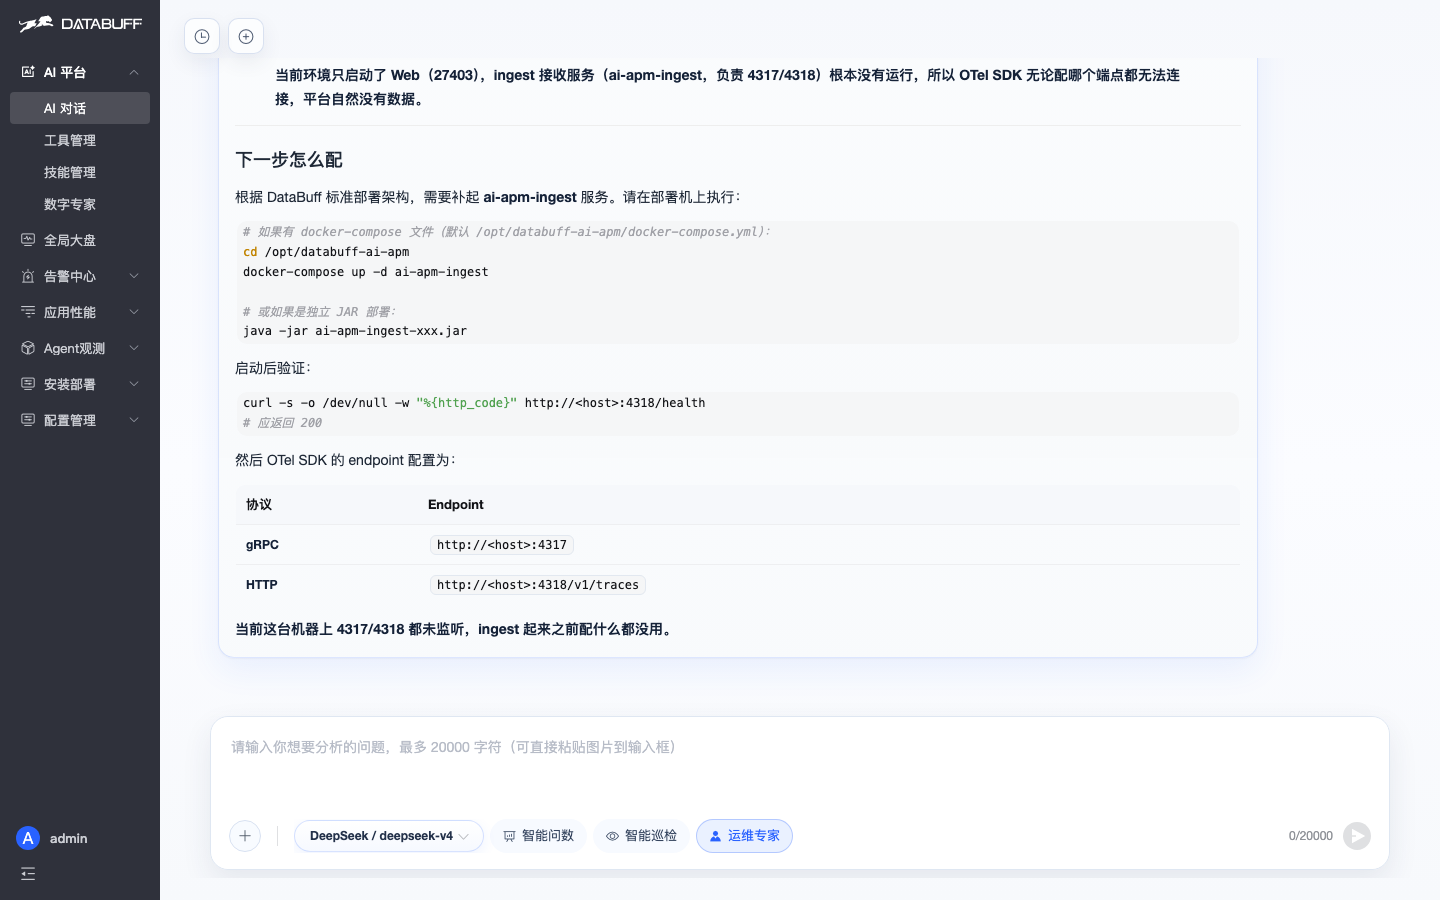
Ops Expert OTel conclusion
③ Ops Expert conclusion
2. Container keeps restarting

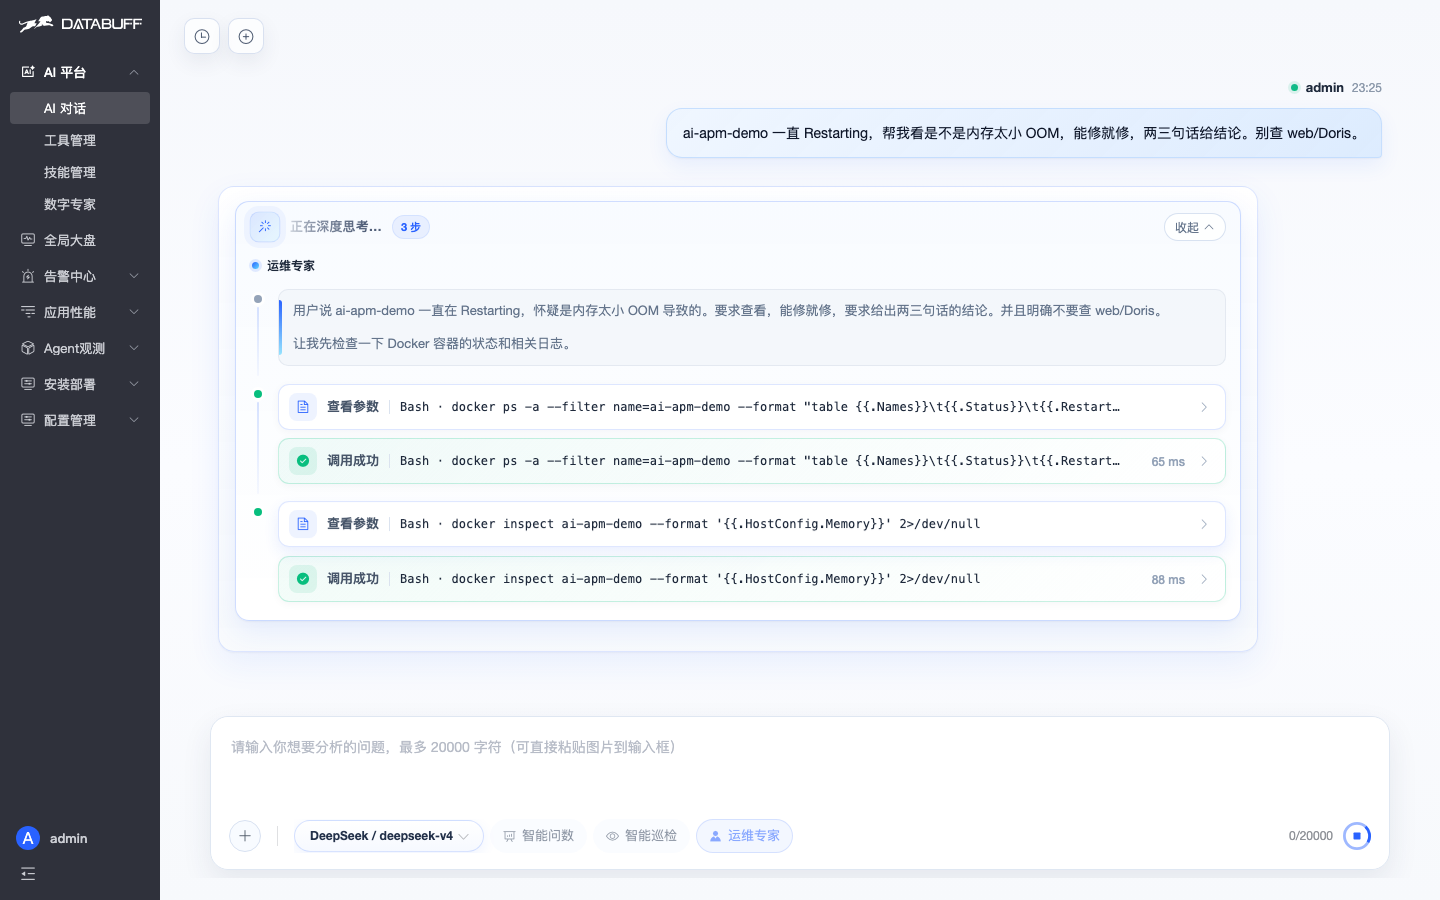
Example prompt:

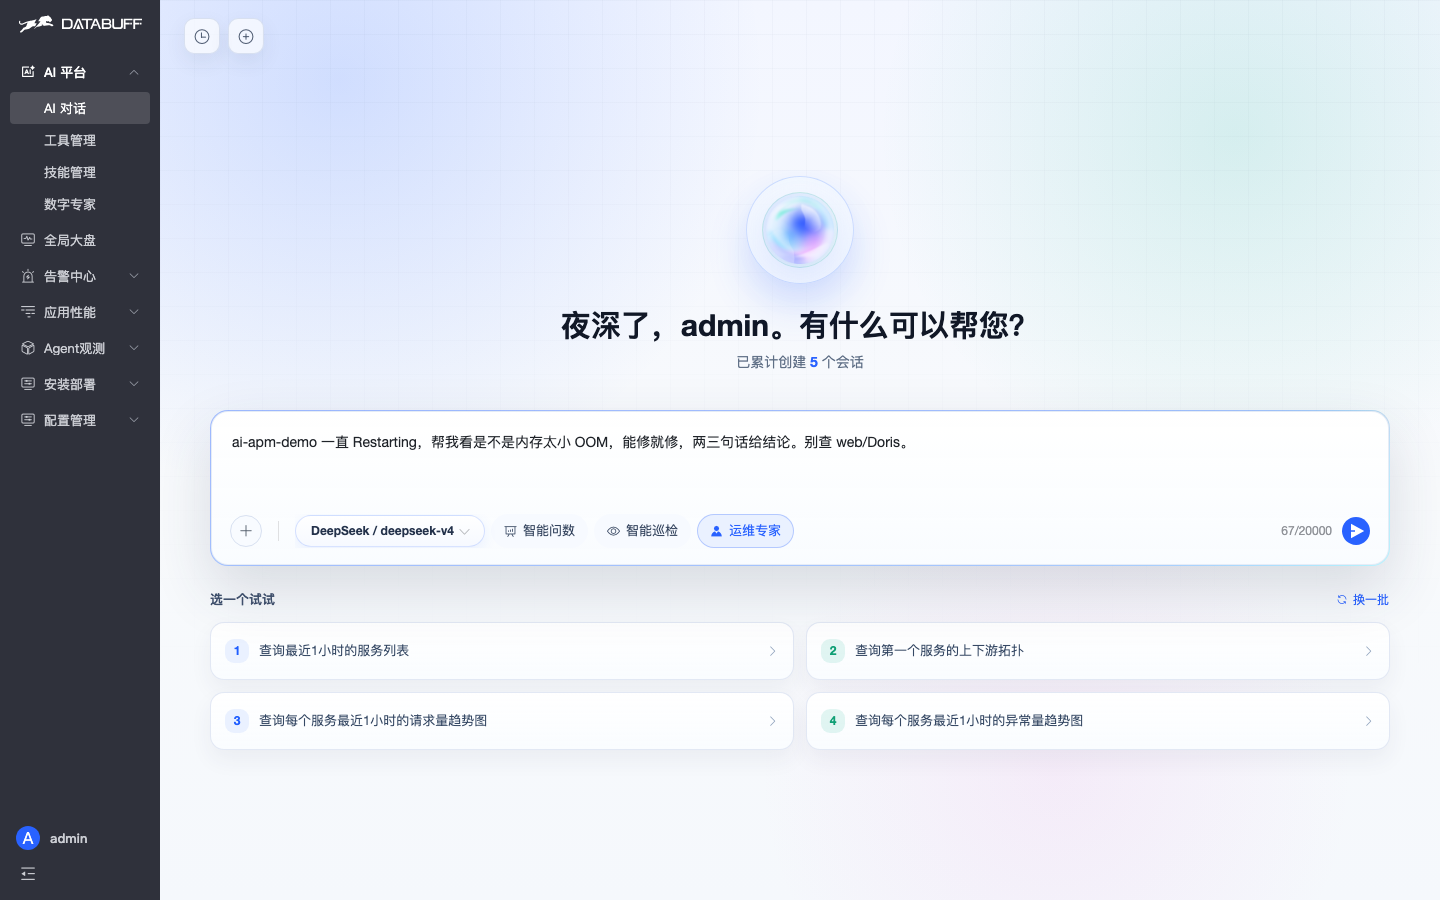
ai-apm-demo keeps Restarting — help me get it healthy.
1 Prompt2 Process3 Conclusion
User asks about container restart loop
① User prompt
Ops Expert fixing container restart
② Ops Expert process
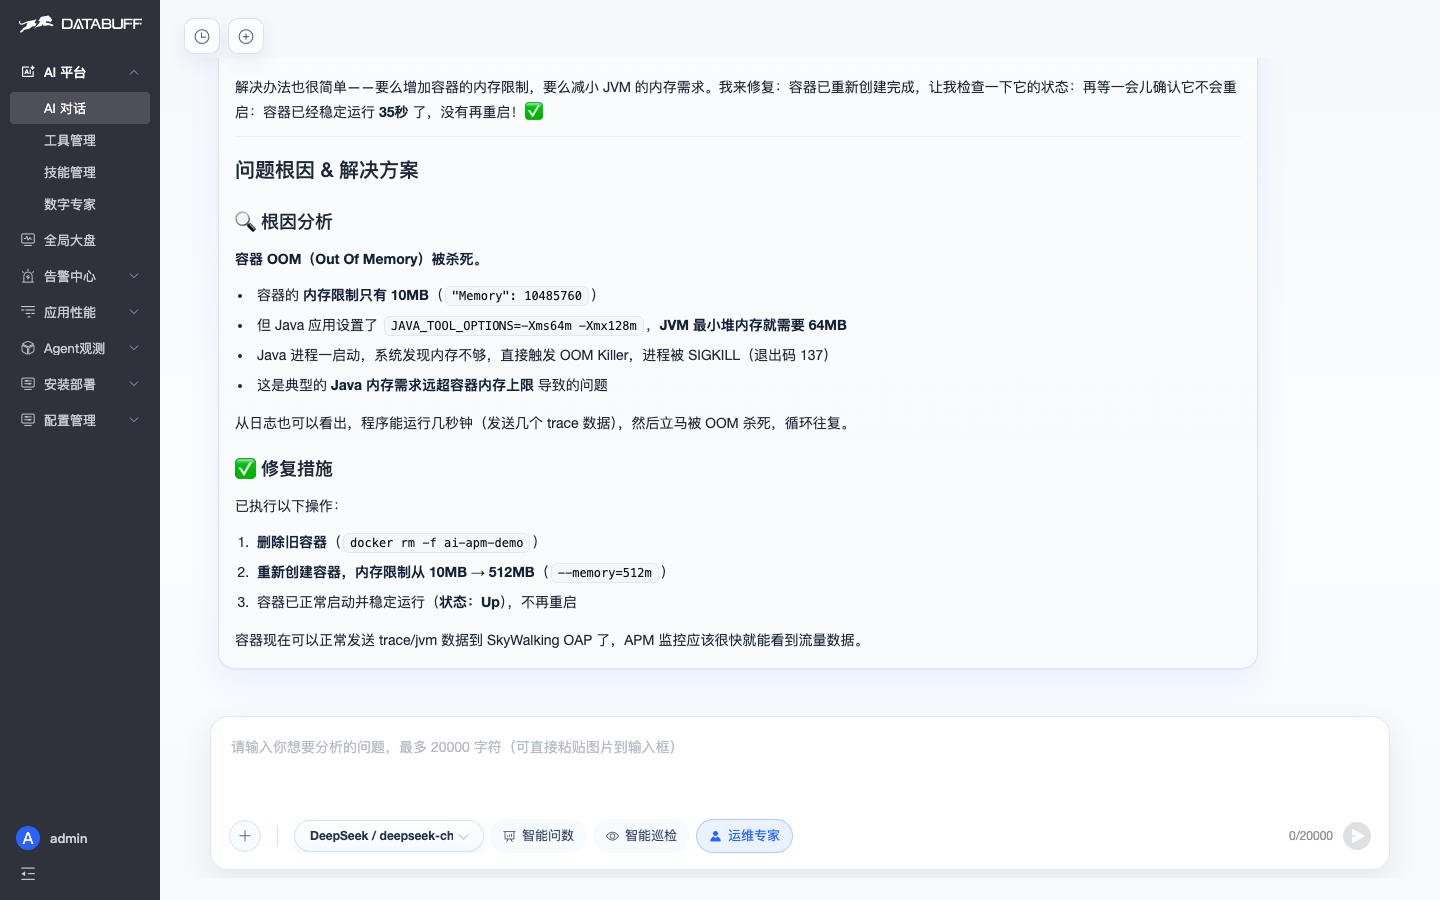
Ops Expert conclusion memory 10MB OOM to 512MB
③ Conclusion (memory limit 10MB → OOM 137 → raised to 512MB)
3. Inspect Java runtime flags

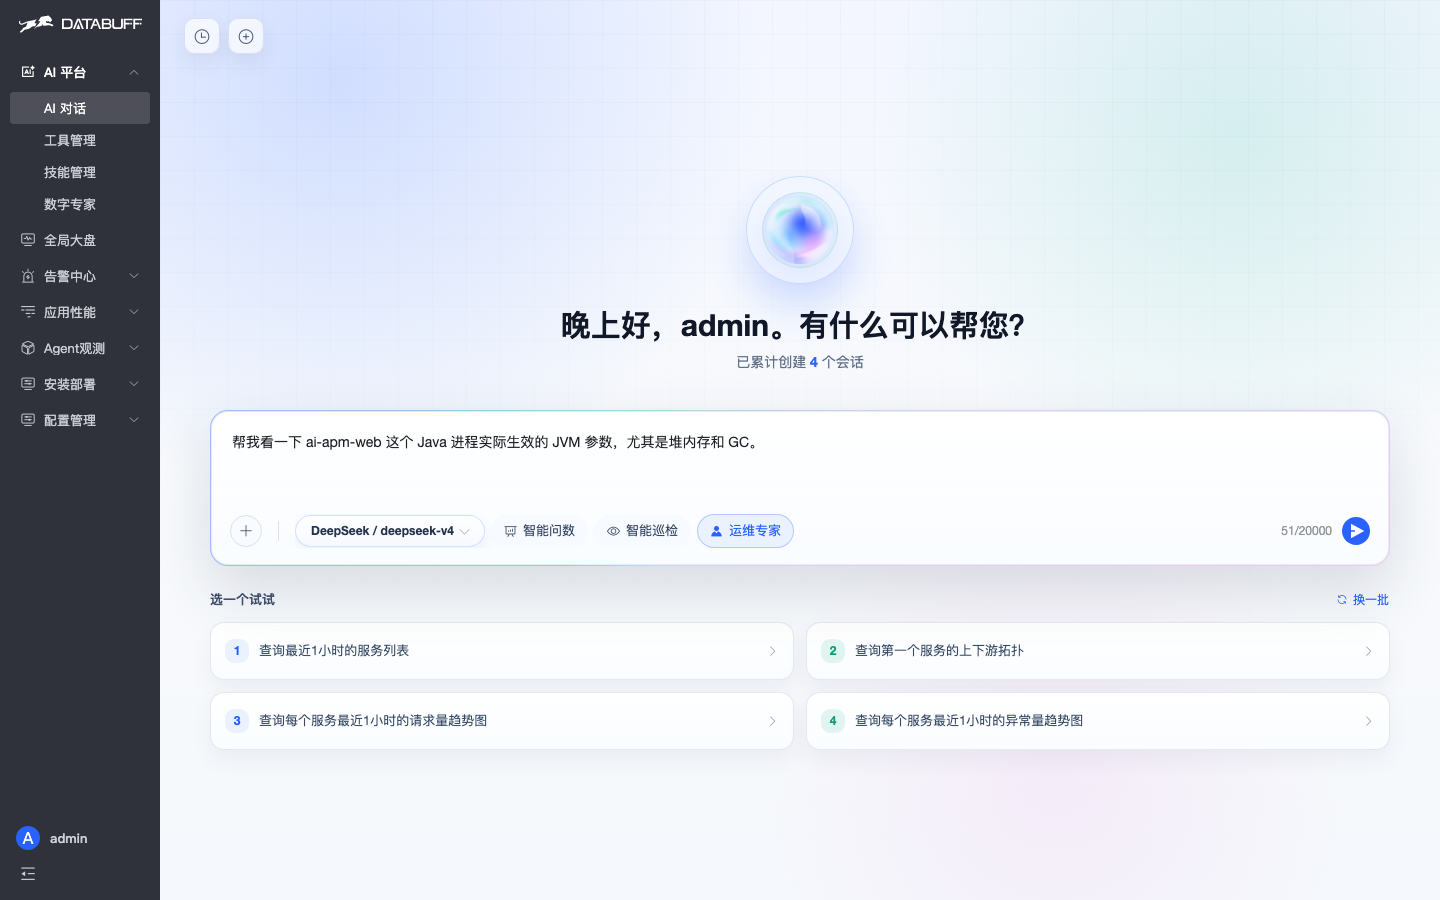
Example prompt:

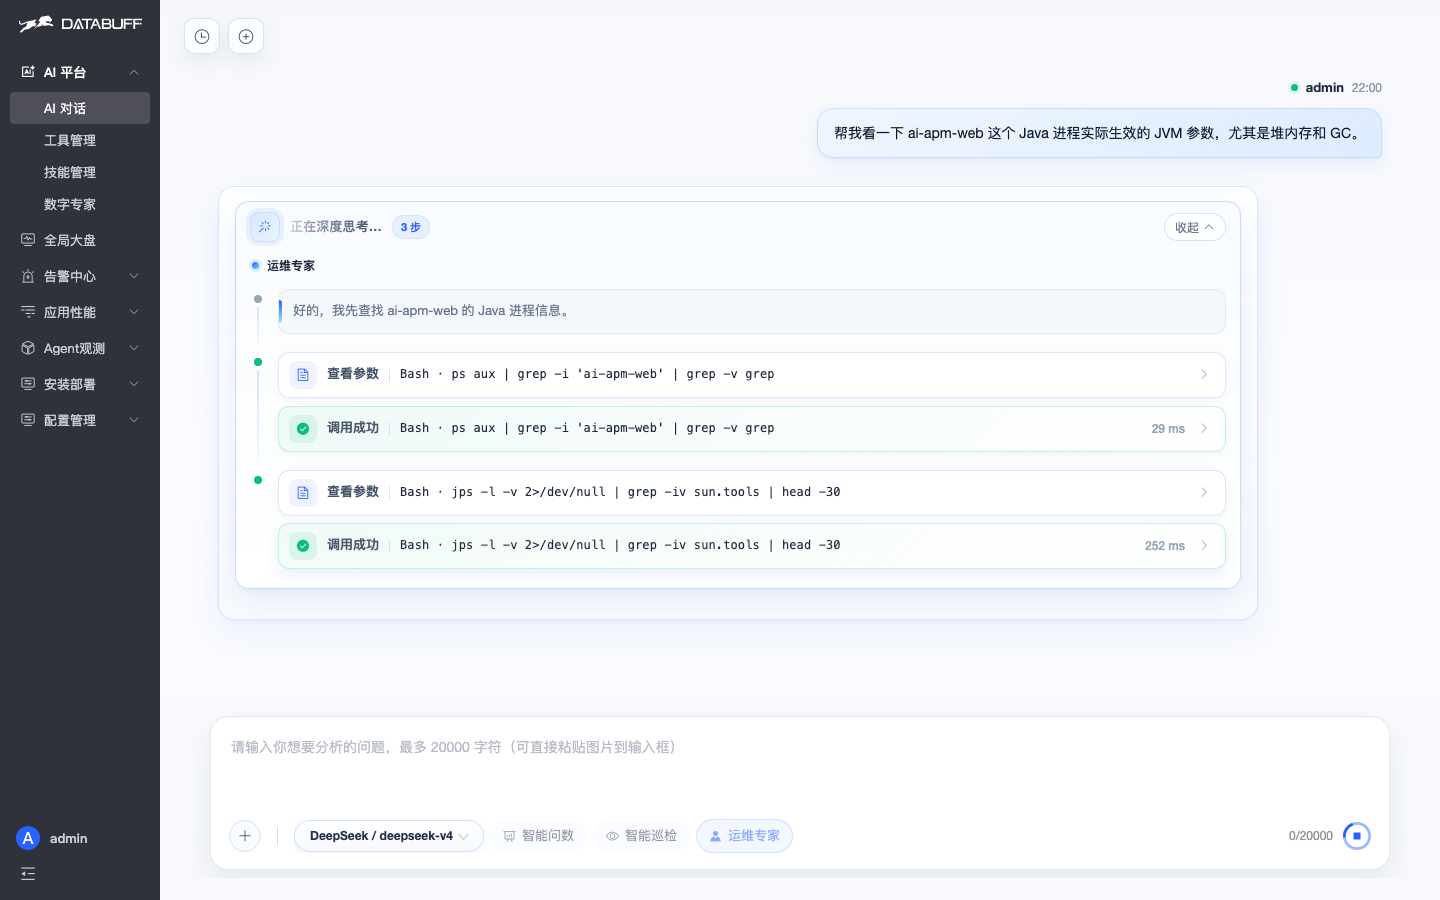
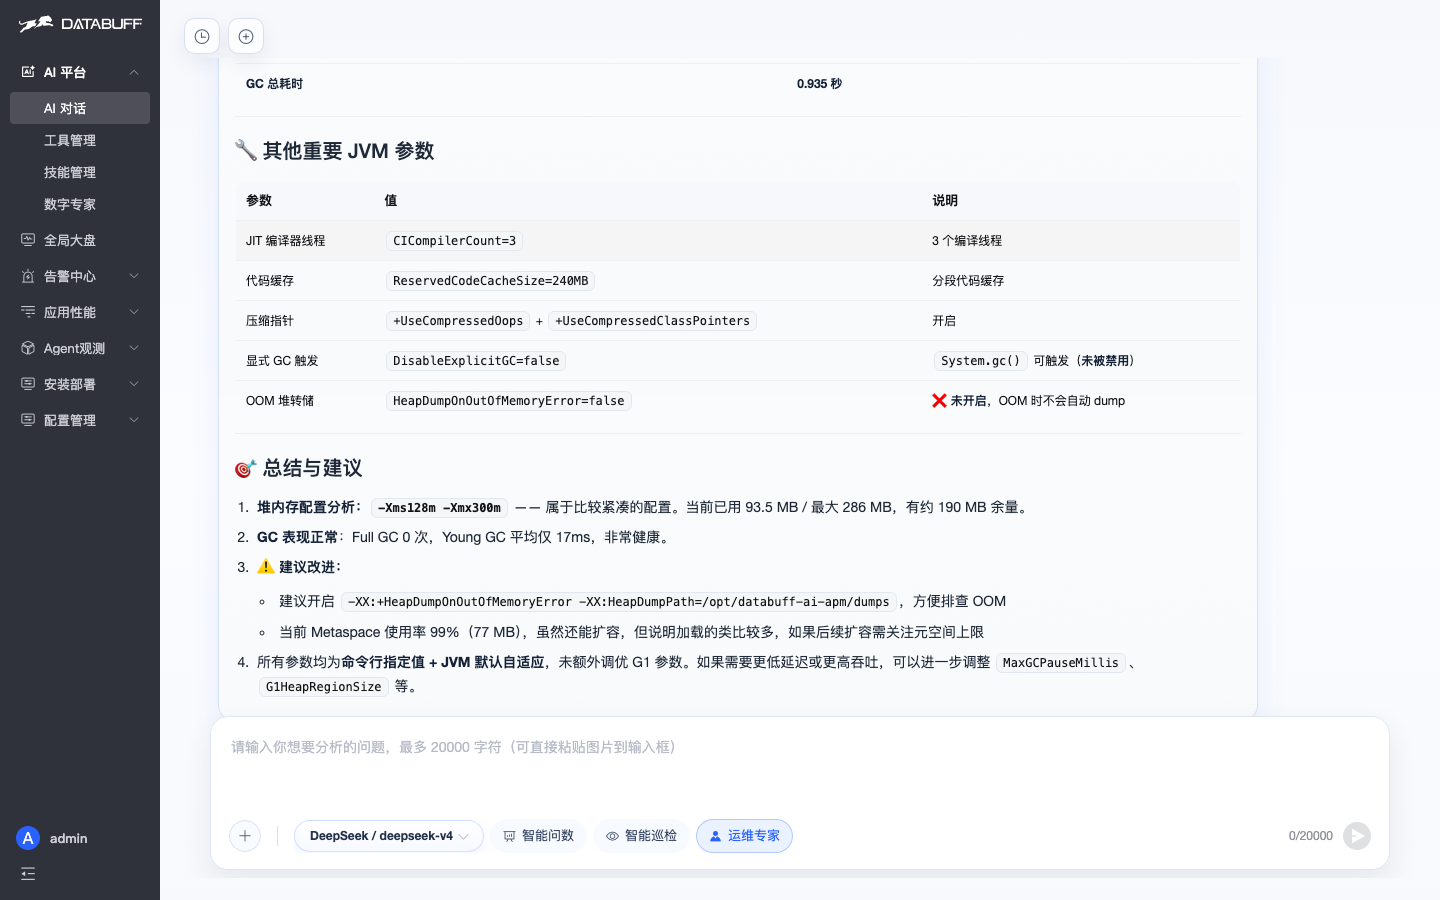
Show me the effective JVM flags for the ai-apm-web Java process — especially heap and GC.
1 Prompt2 Process3 Conclusion
User asks for JVM flags
① User prompt
Ops Expert querying JVM flags
② Ops Expert process
Ops Expert JVM conclusion
③ Ops Expert conclusion
4. Port in use — service won’t start

Example prompt:

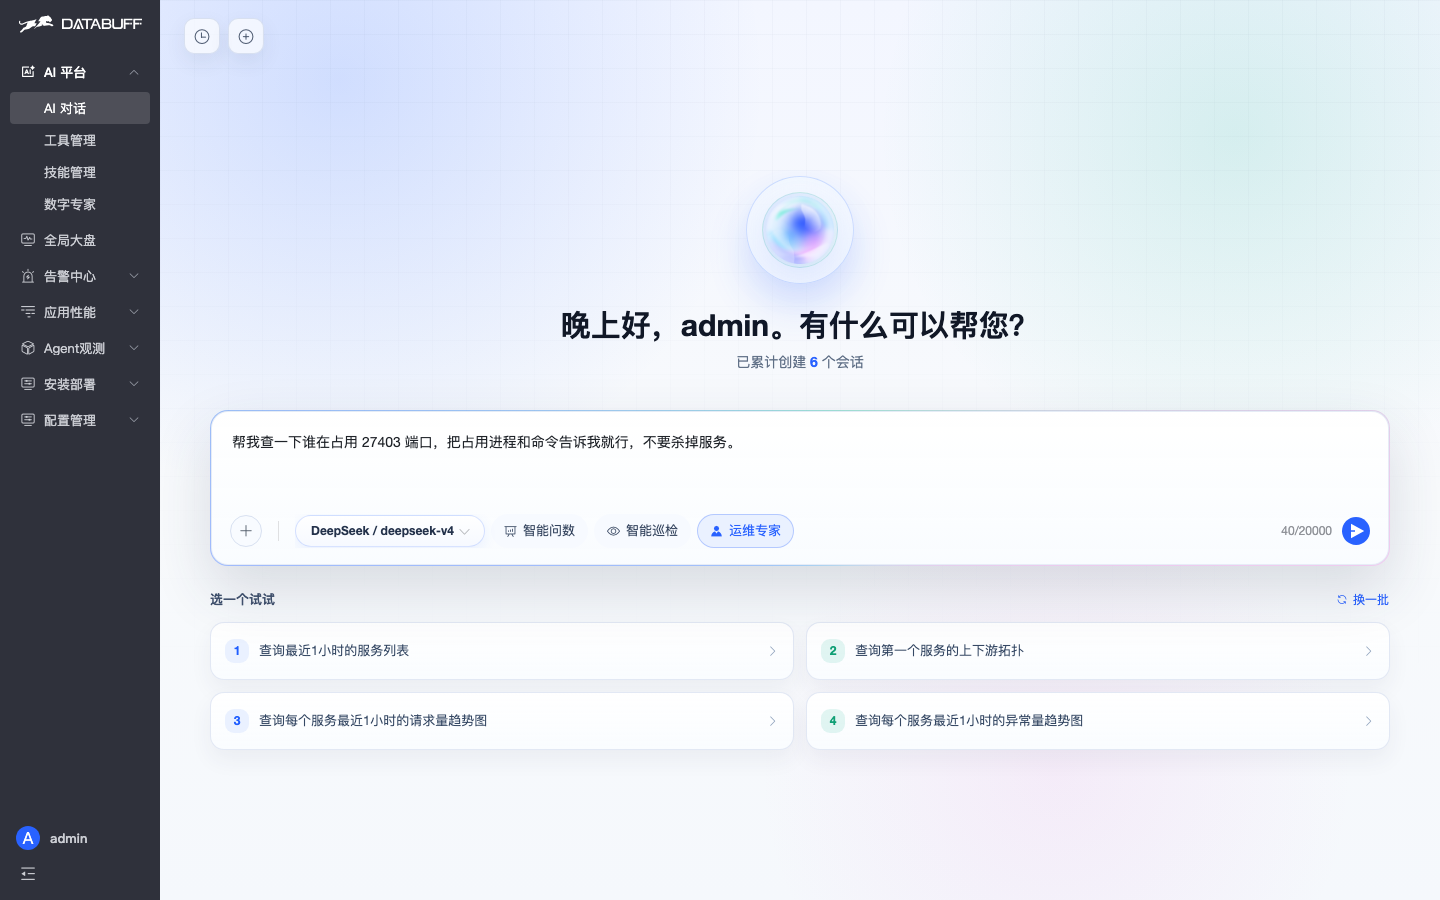
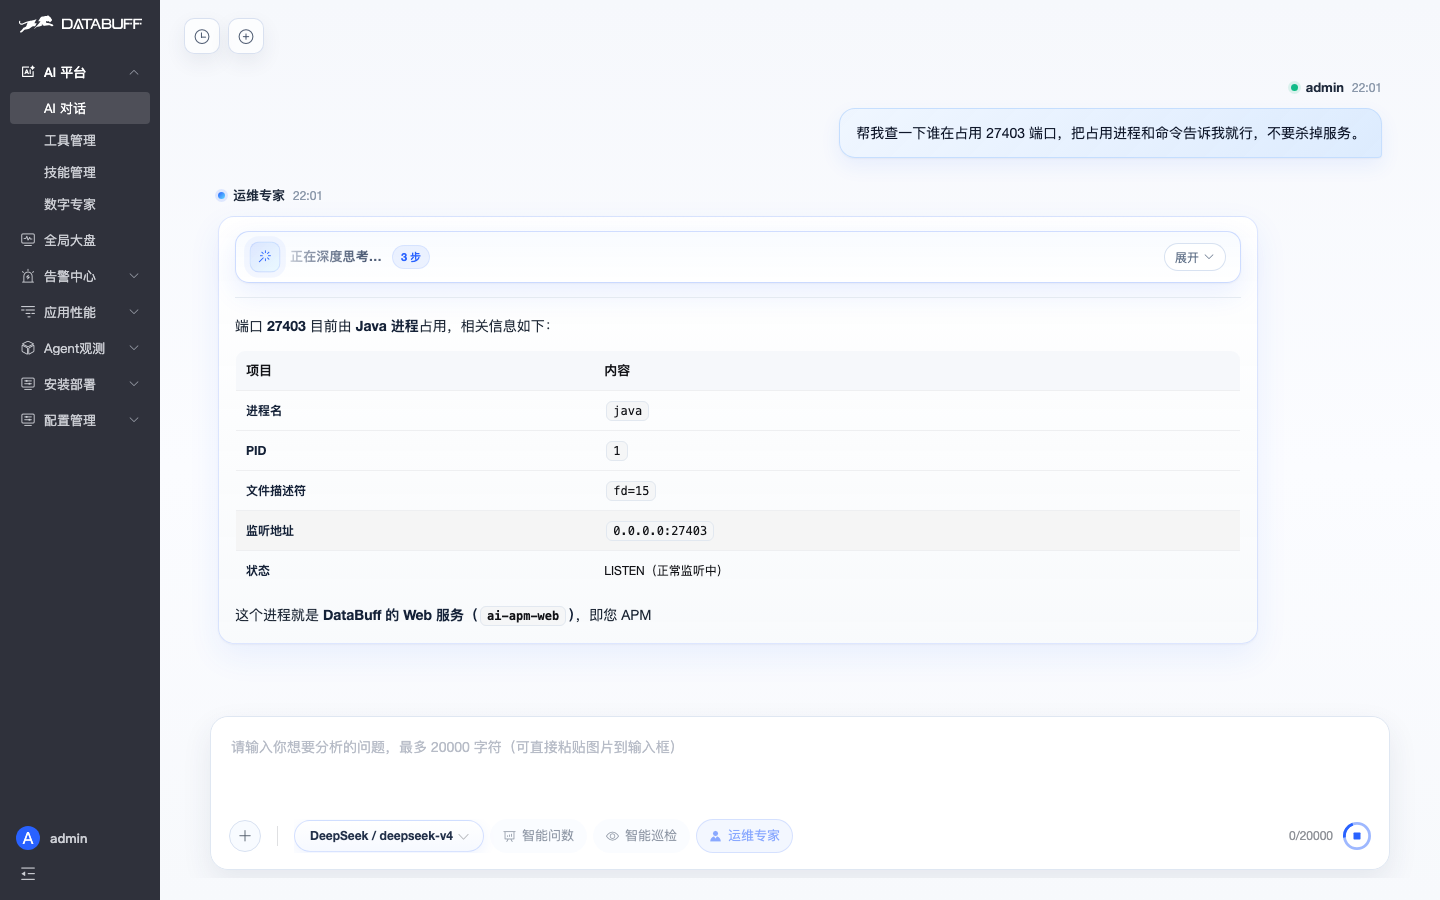
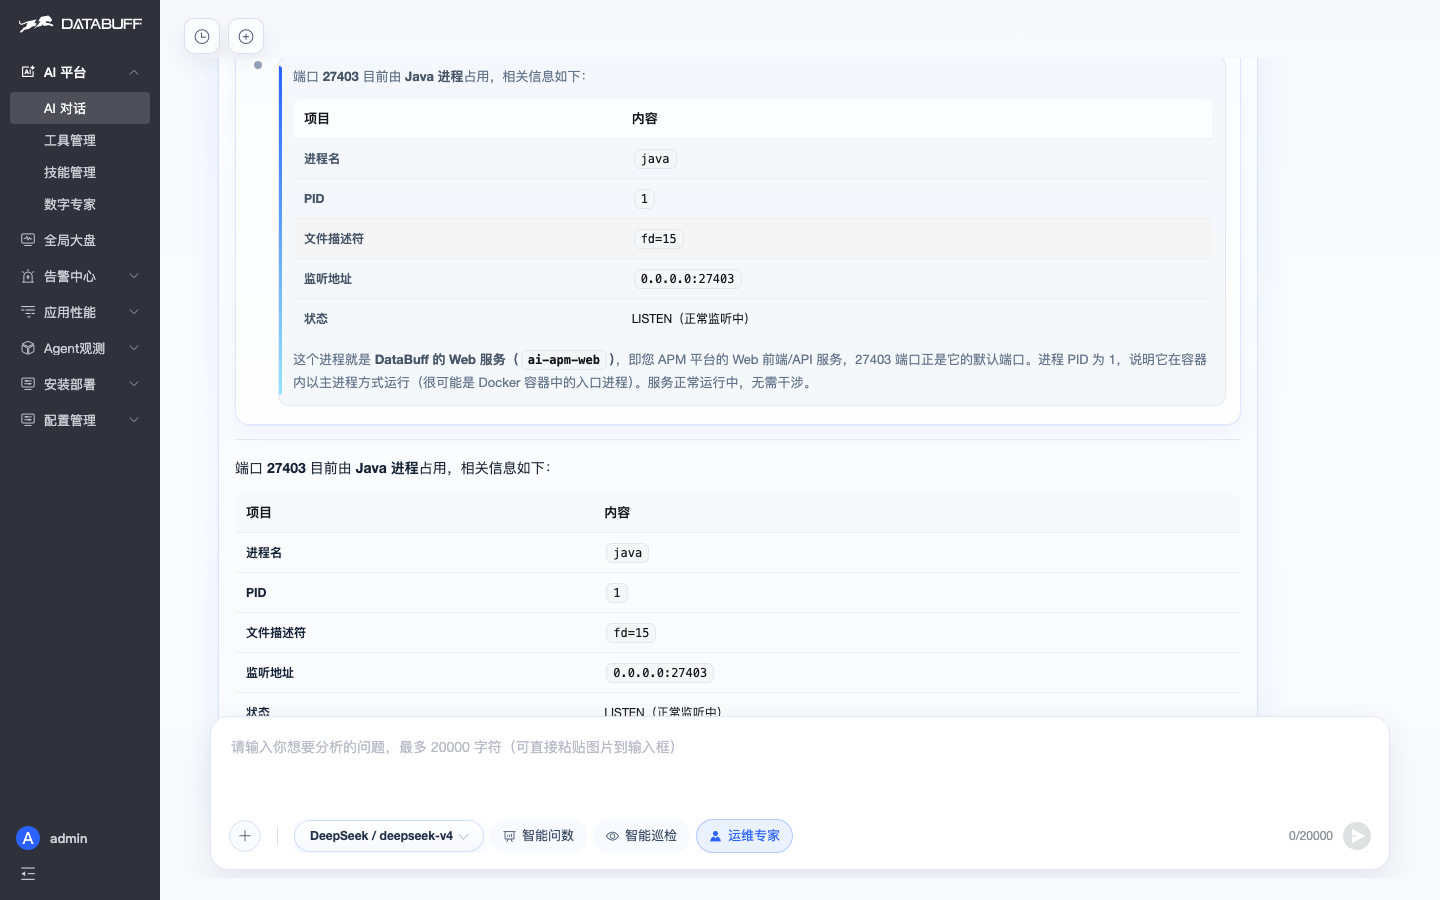
Who is holding port 27403? Tell me the process and command — do not kill anything.
1 Prompt2 Process3 Conclusion
User asks about port conflict
① User prompt
Ops Expert checking port ownership
② Ops Expert process
Ops Expert port conclusion
③ Ops Expert conclusion
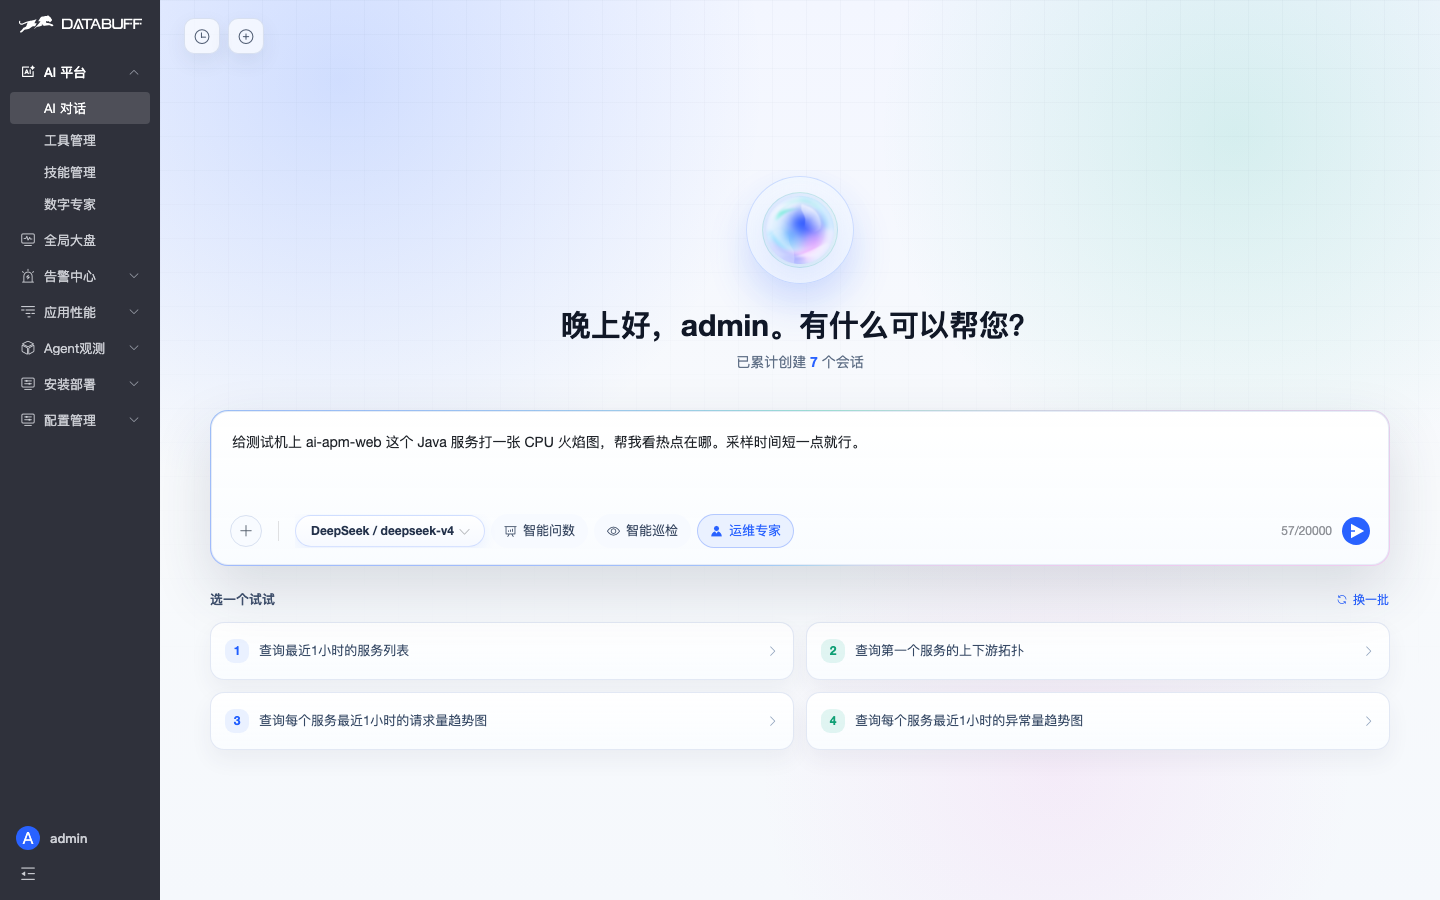
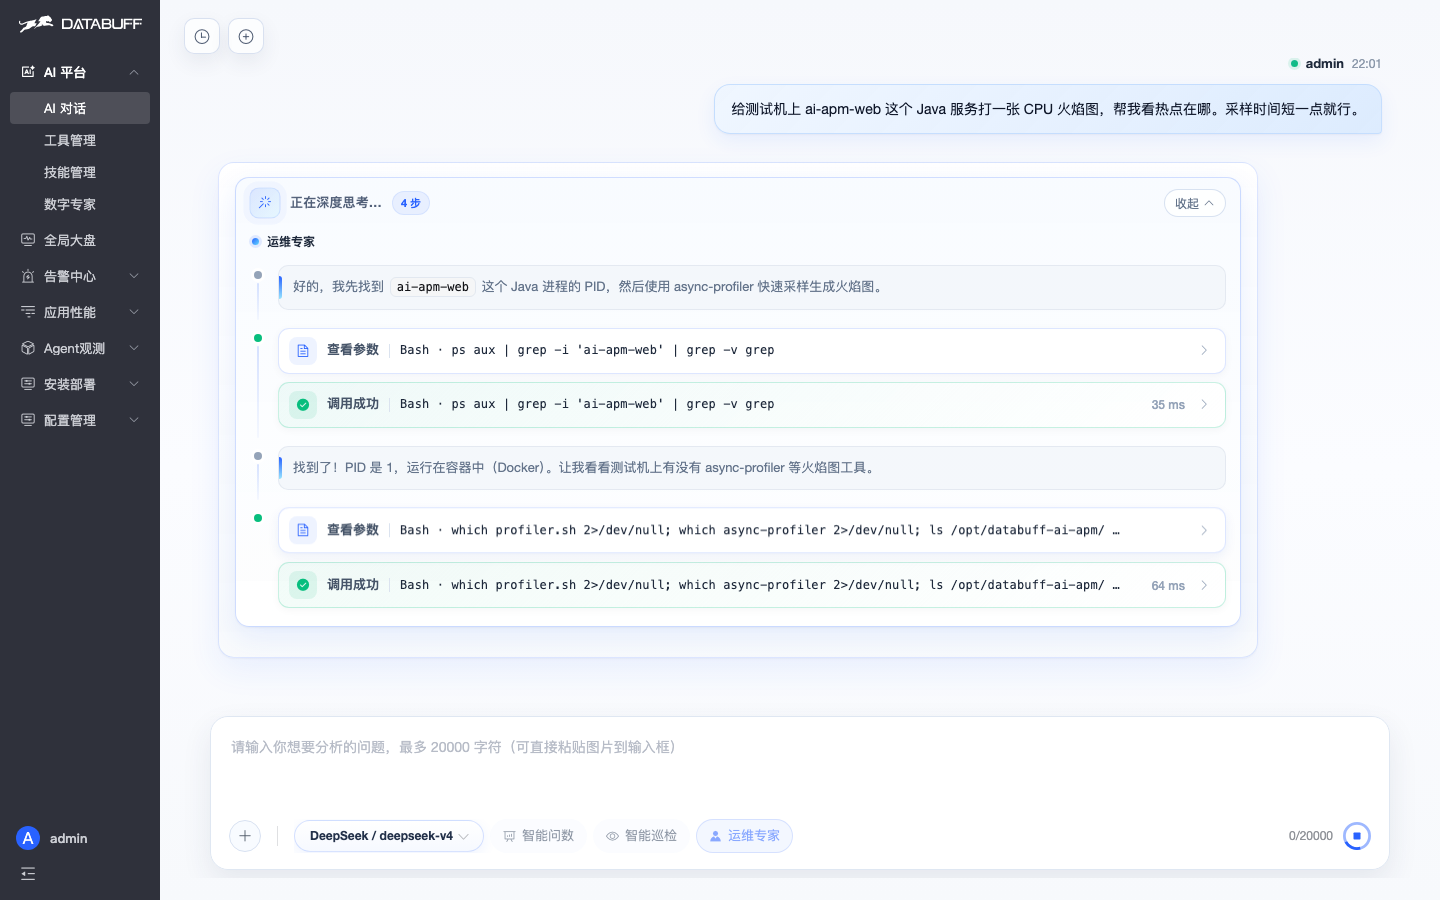
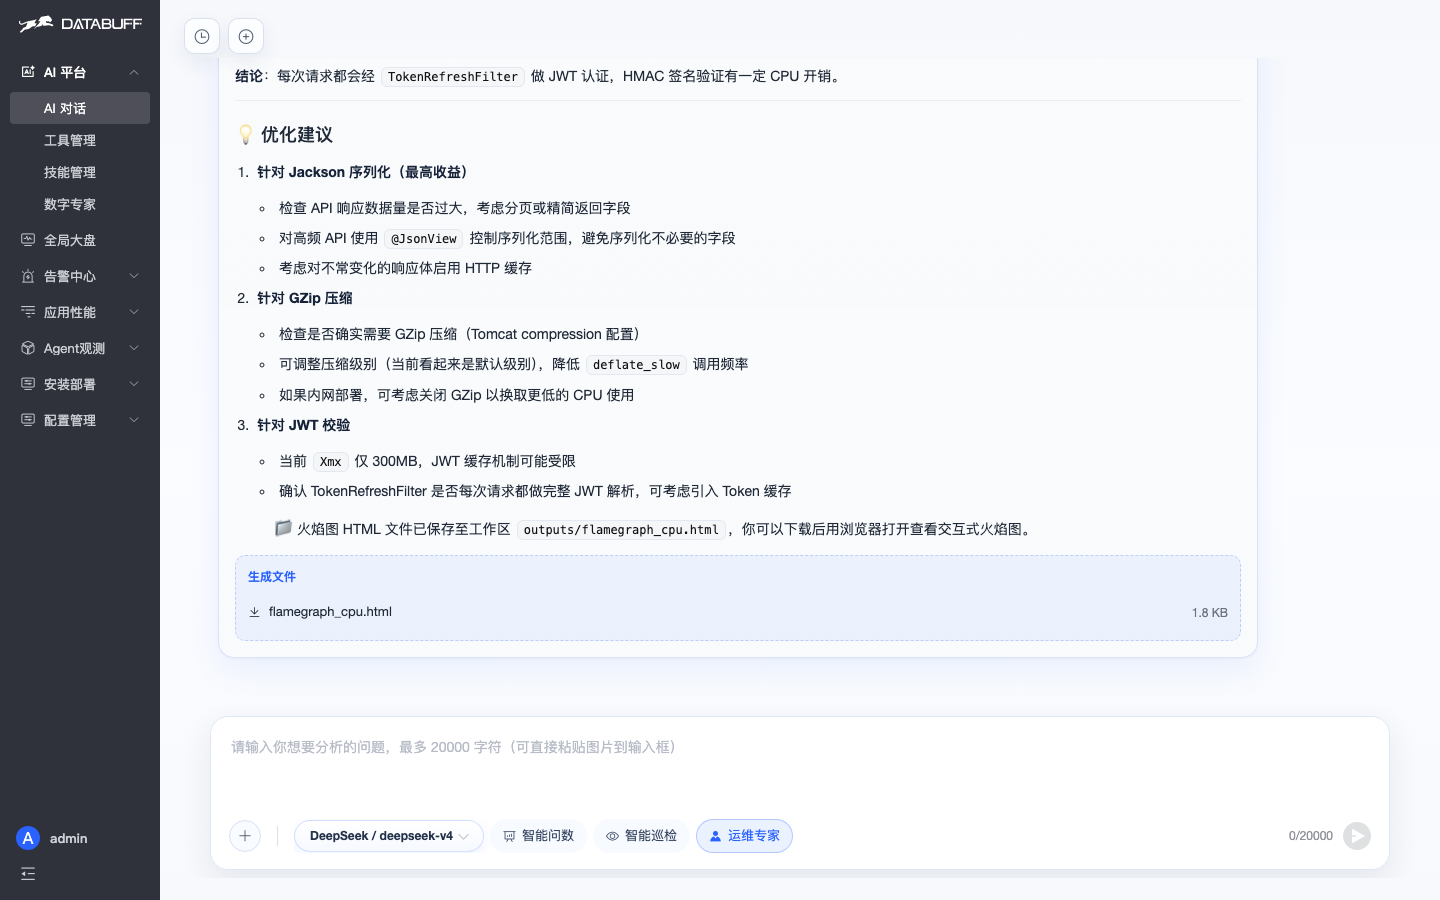
5. Capture a flame graph

Example prompt:

Take a short CPU flame graph for the ai-apm-web Java service on the test host and point out the hotspots.
1 Prompt2 Process3 Conclusion
User asks for a flame graph
① User prompt
Ops Expert sampling flame graph
② Ops Expert process
Ops Expert flame graph conclusion
③ Conclusion (sample result + hotspot readout)
Same loop every time: describe the symptom → watch the process → read the conclusion. The timing table at the top is the DIY SSH vs Ops Expert gap.

Open source · one-line install

curl -fsSL https://databuff.ai/databuff/ai-apm-install.sh | bash

GitHub (Star welcome):

https://github.com/databufflabs/databuff

Live demo:

https://demo.databuff.ai

Ops ExpertOTelCrashLoopFlame graph