When you're on call, the worst thing isn't that your business went down — it's that your monitoring platform itself broke and you had no idea. Log volume suddenly drops, a chunk of data silently disappears — and after hours of searching you realize it was never the business at fault: the collection pipeline choked on itself. To make it worse, traditional monitoring software is always watching "everything else," while being a black box itself: CPU spikes, memory full, queues blocked — it never says a single word.
First, what is DataBuff: an open-source AI-native APM where the AI lives directly on top of your OpenTelemetry data — asking questions and troubleshooting are done by AI experts calling tools against real data. Project on GitHub (github.com/databufflabs/databuff). Its approach is different: it treats itself as a business system being monitored. Once installed, you can see whether it's healthy, why it's abnormal, which parameter to tune — you can even say one sentence and it will run an inspection on itself. This article walks through a real case.
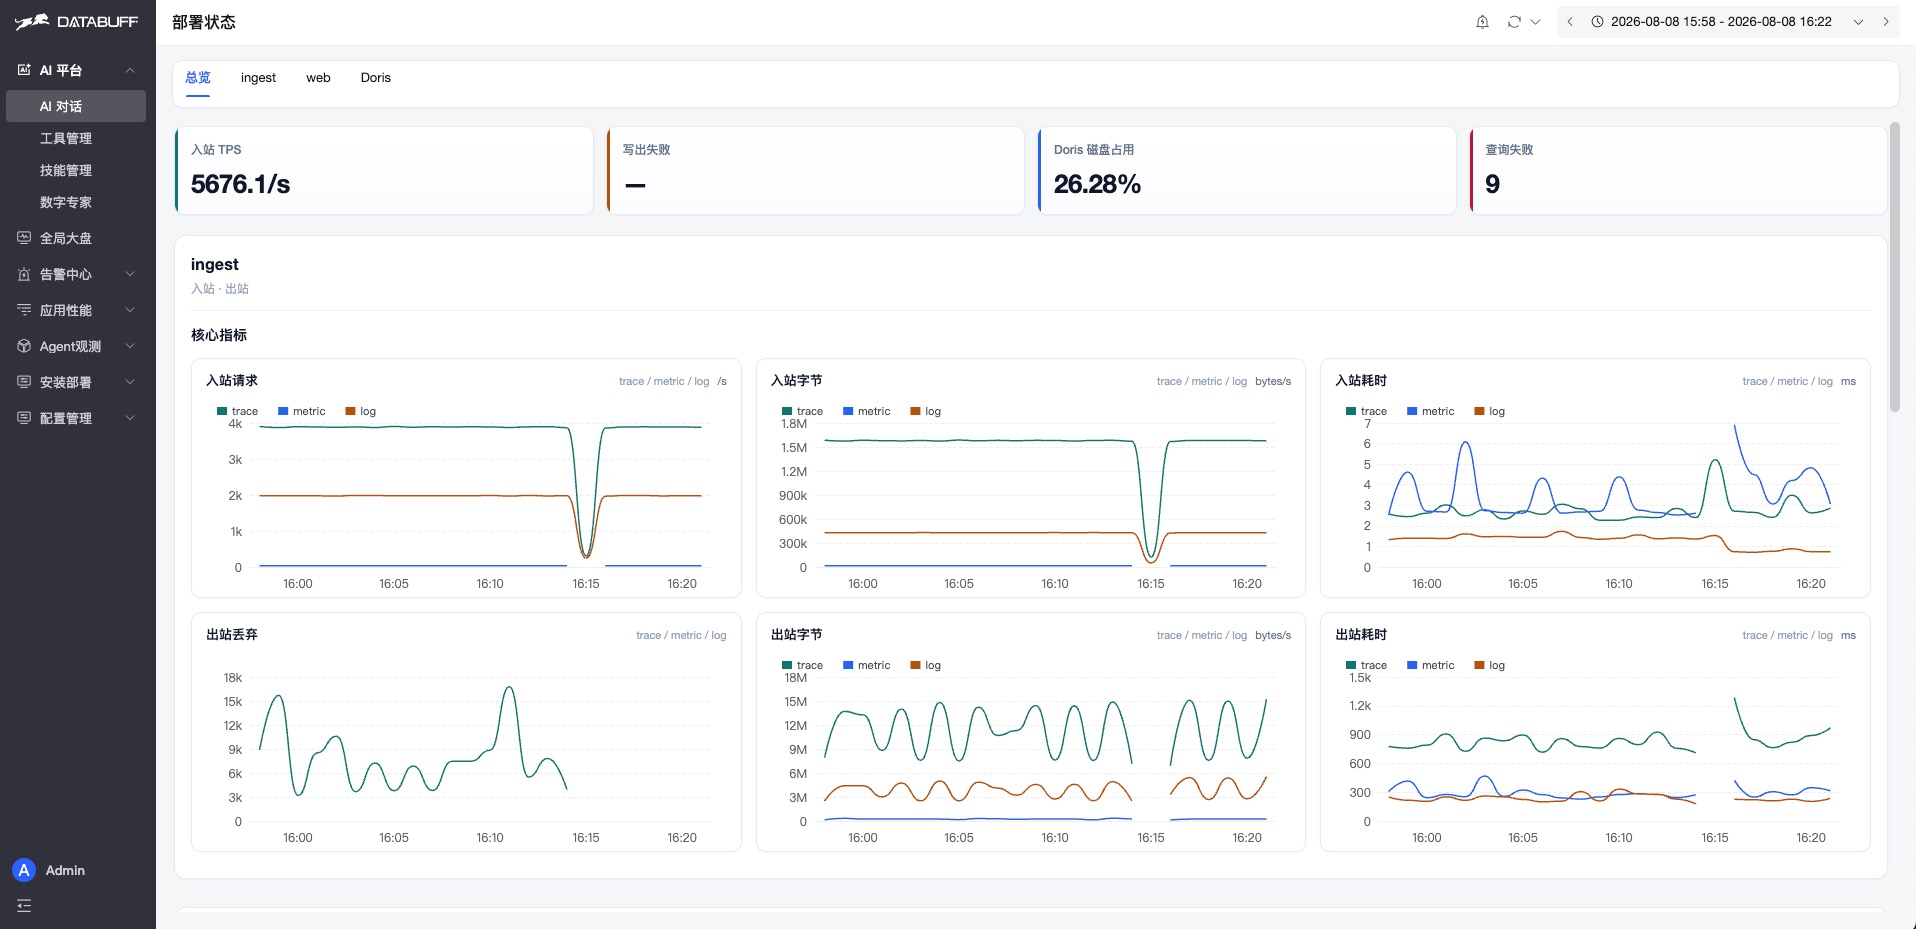
DataBuff's "Deployment Status" page exposes metrics for all three core components: ingest (collects data), web (queries data), and Doris (stores data). The overview opens with four cards that state the conclusion up front: inbound events per second, any write failures, Doris disk remaining, any query errors.
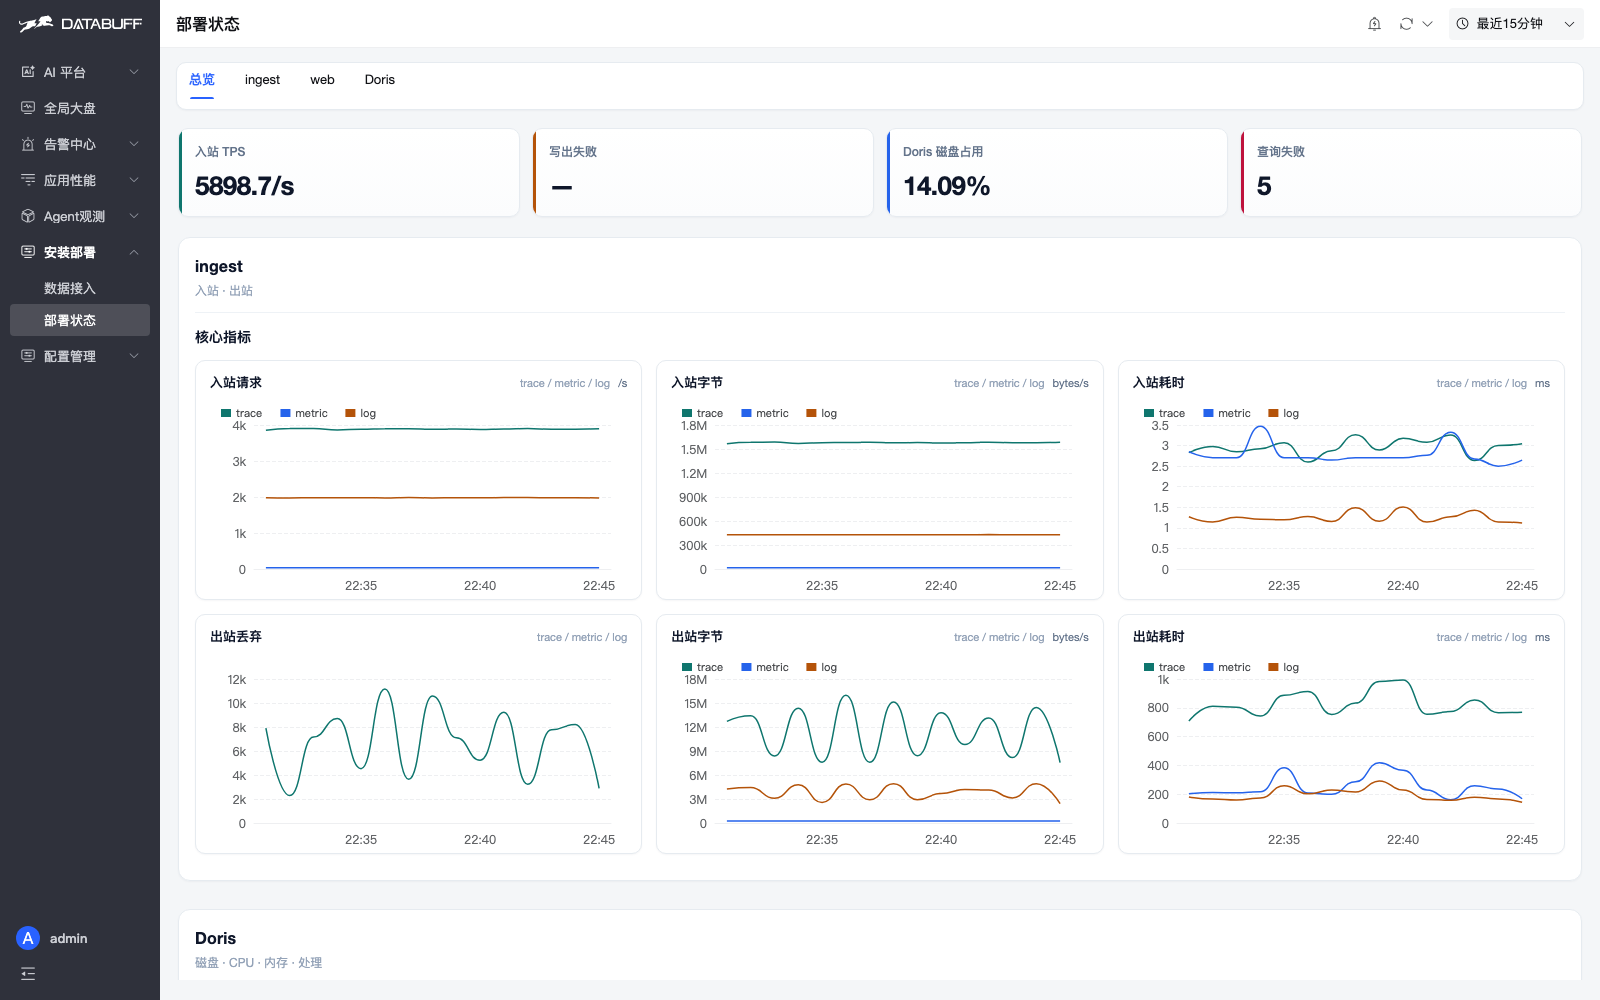
Scrolling down gets more granular: every signal path in ingest — trace / metric / log — is tracked individually with "how many, how big, how slow, any dropped"; Doris disk and CPU are broken out too.
More metrics isn't the point — every metric comes with an explanation and its tuning parameters. Click the title of any chart and a drawer pops up: how this metric is computed, whether you should worry, which env var to tune when it goes wrong, and the default value. All explained at once.
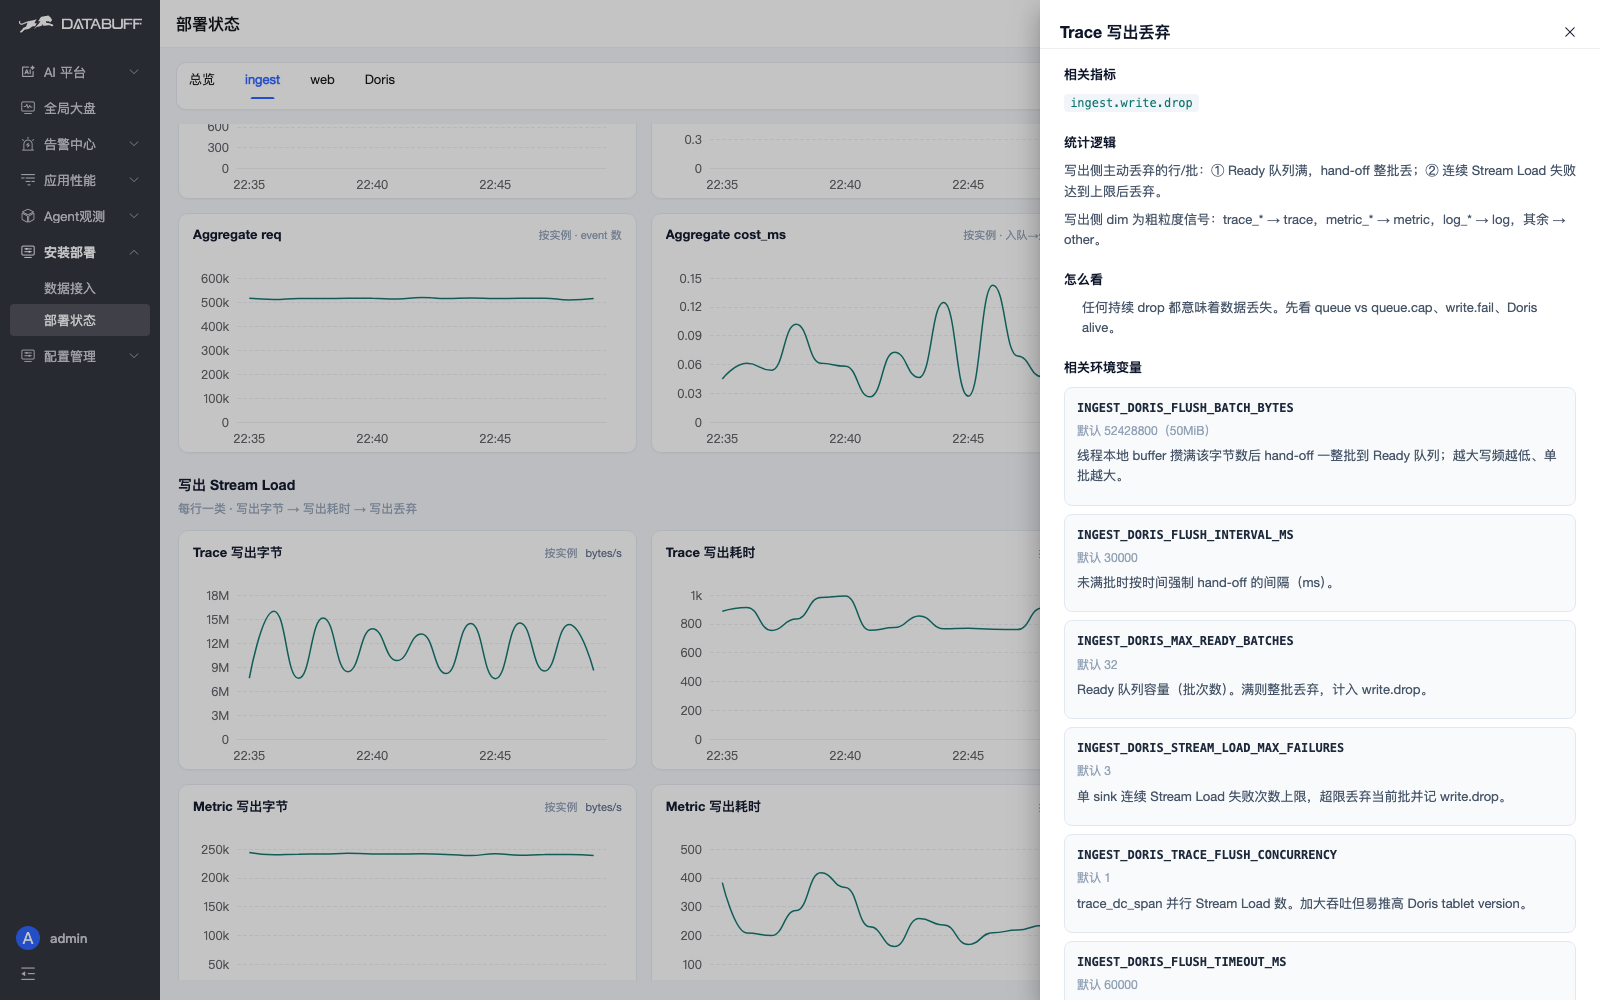
Take the "Write Drop" metric: the drawer tells you it only occurs in two situations — the queue is full and a whole batch is dropped, or writes fail consecutively and are discarded; it reminds you that "any sustained drop means data loss — check queue depth, write failures, and Doris liveness first"; and finally it lists the tunable parameters directly.
Don't want to flip through page after page? Just tell the AI platform "inspect the DataBuff platform and produce an HTML inspection report". The product support expert reads the metric catalog, queries the platform's own self-monitoring metrics, picks out the anomalies, and produces an HTML report you can forward directly.
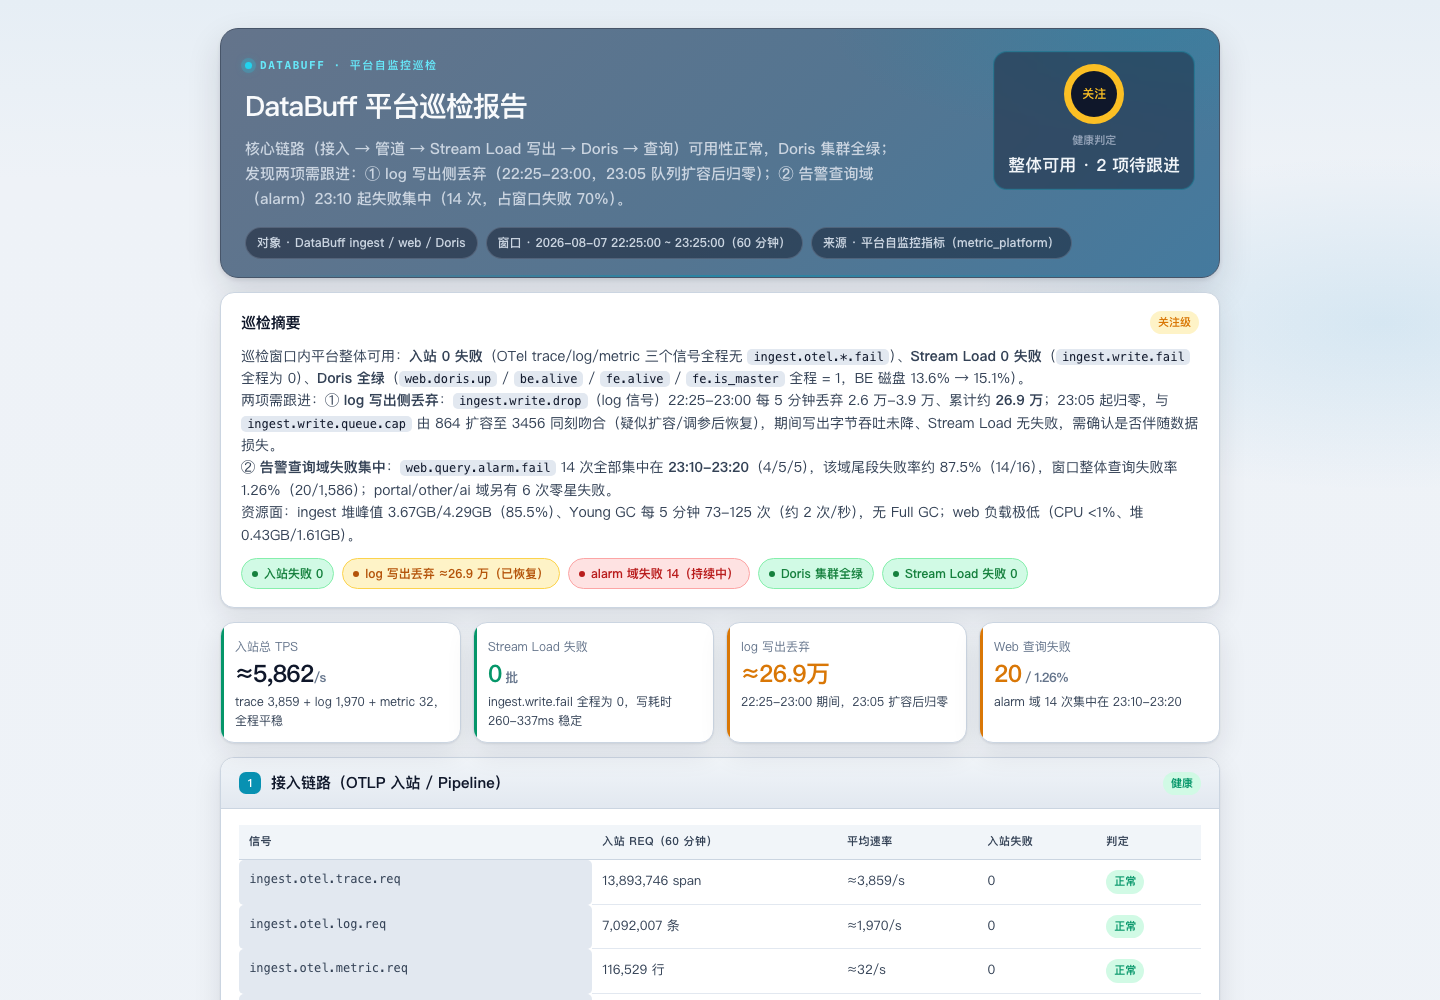
We ran it live: within minutes it automatically checked ingest, writes, pipeline, query domain, Doris, and process resources. The conclusion matched manual troubleshooting — one query-domain failure was still ongoing, and it flagged it as-is.
This data loss isn't made up — it actually happened and was actually fixed in our demo environment. The "Write Drop" metric on the Deployment Status page went red — only the log signal was dropping continuously, thousands to fifteen thousand per minute:
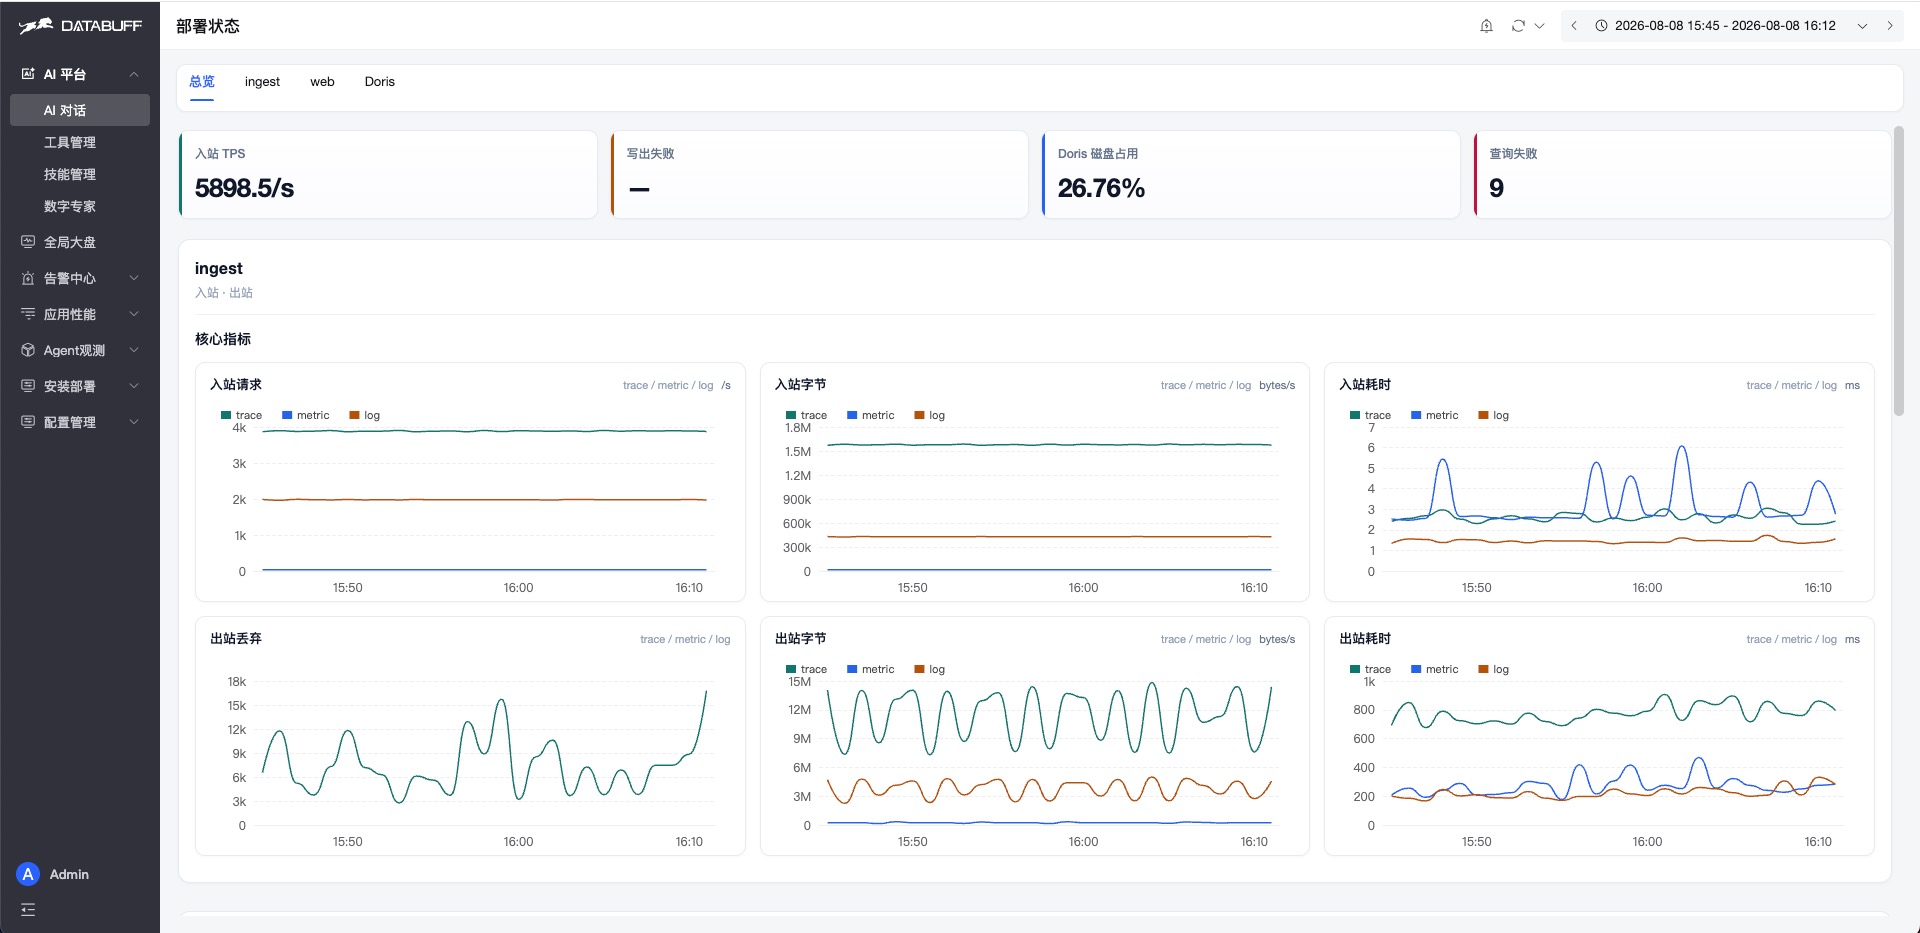
At this point, no one needs to flip through pages. Just say the word in the AI platform and let the expert investigate. It first rules out two "non-issues": the business side is normal — not the app's fault; Doris storage is alive and writes are fast — not the storage's fault. The real cause lands in ingest. Logs are batched and pushed into a write queue — this environment's queue holds only 16 batches, normally 32. Sudden bursts don't fit, and the overflow gets dropped as whole batches. The log shows Doris ready queue full (16/16) every minute — confirmed.
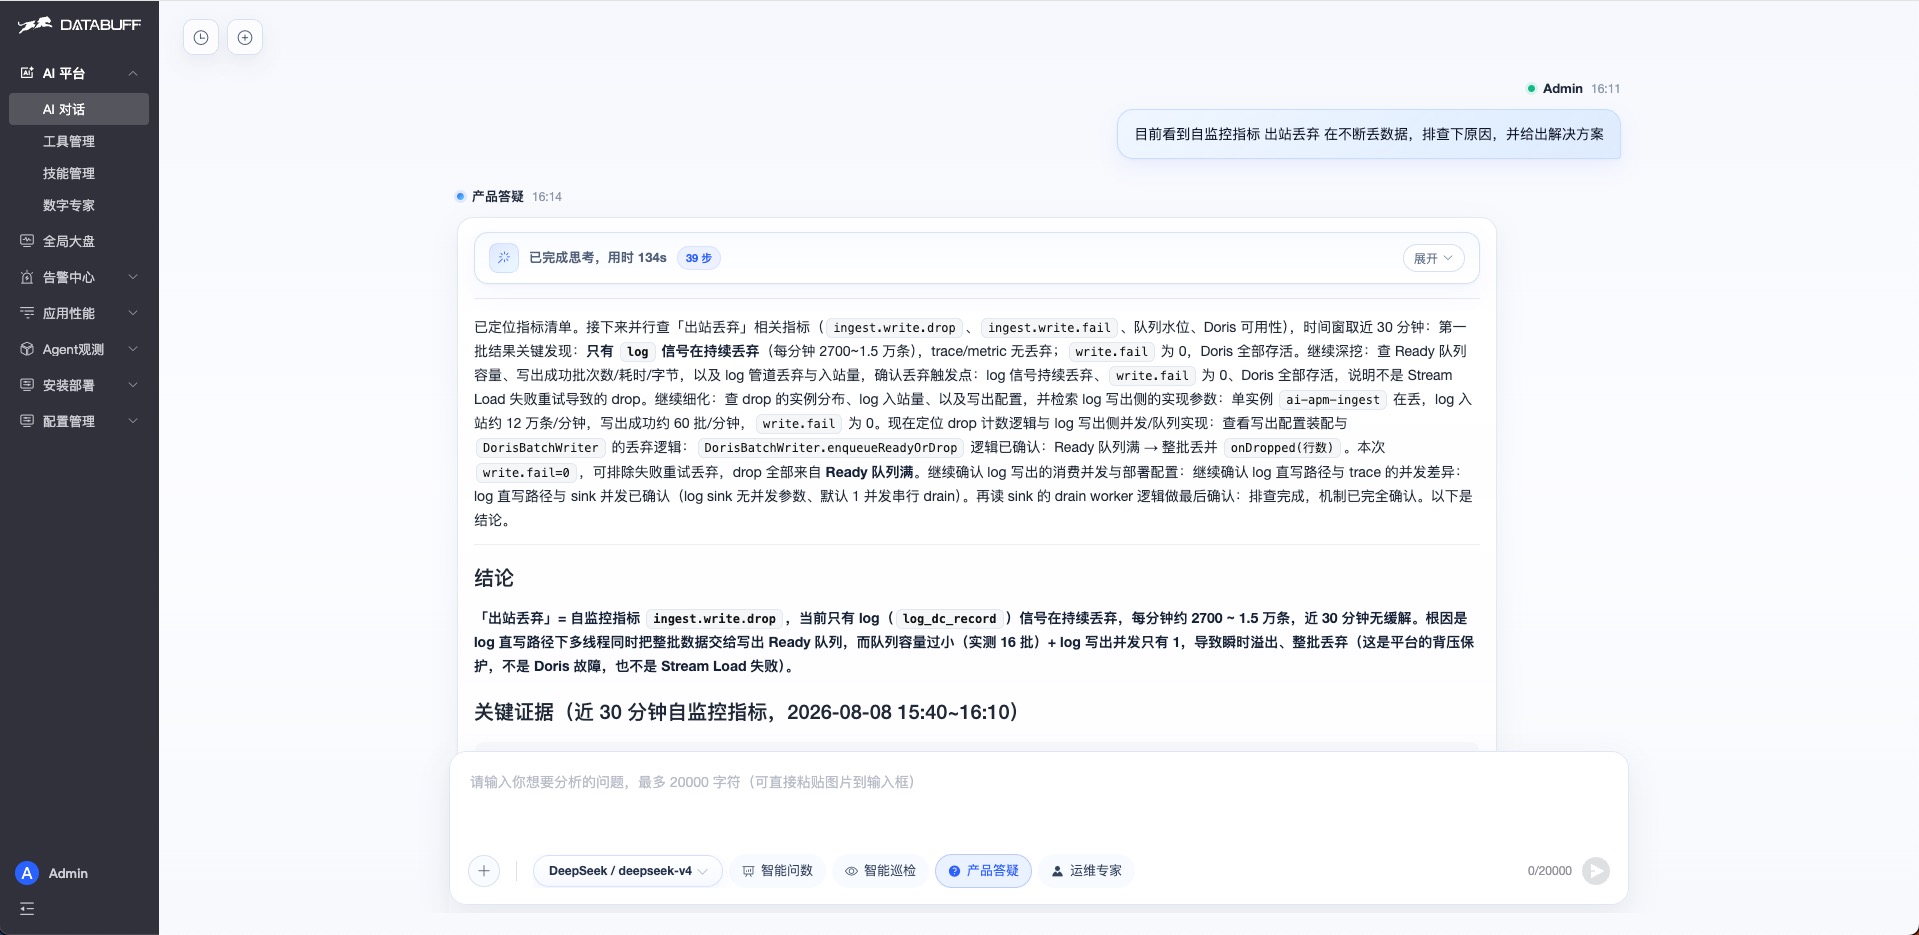
It packages "why it dropped, where it dropped, which param to tune, and to what value" into a conclusion with evidence, and hands over the fix suggestion:
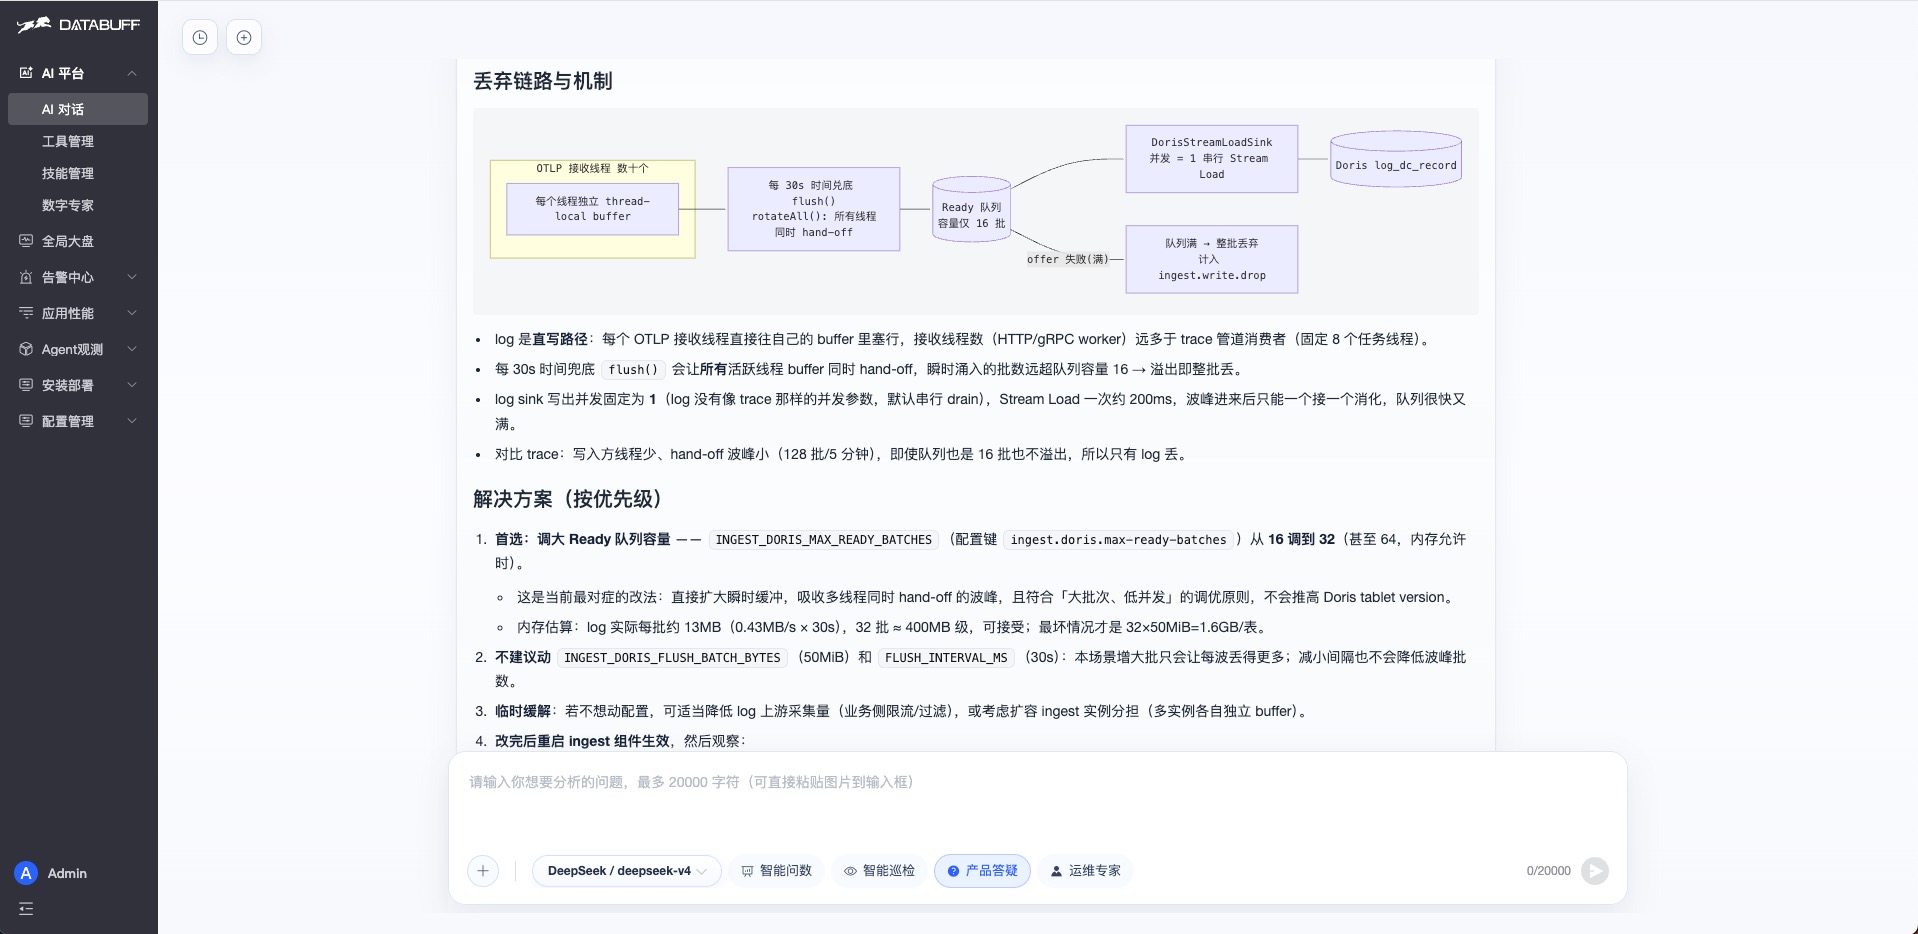
The suggested fix is exactly this group of INGEST_DORIS_* parameters — the core problem is a too-small queue, just make it bigger:
| Parameter | Before | After | Effect |
|---|---|---|---|
INGEST_DORIS_MAX_READY_BATCHES | 16 | 32 | Write queue too small for bursts; double it |
INGEST_DORIS_FLUSH_TIMEOUT_MS | 30s | 60s | Restore default write timeout |
INGEST_DORIS_FLUSH_BATCH_BYTES | 50 MiB | 50 MiB (unchanged) | Not touched this time |
And you don't change the params or restart by hand. The product support expert SSHs in, edits the config, and restarts ingest per the suggestion, then re-checks to confirm:
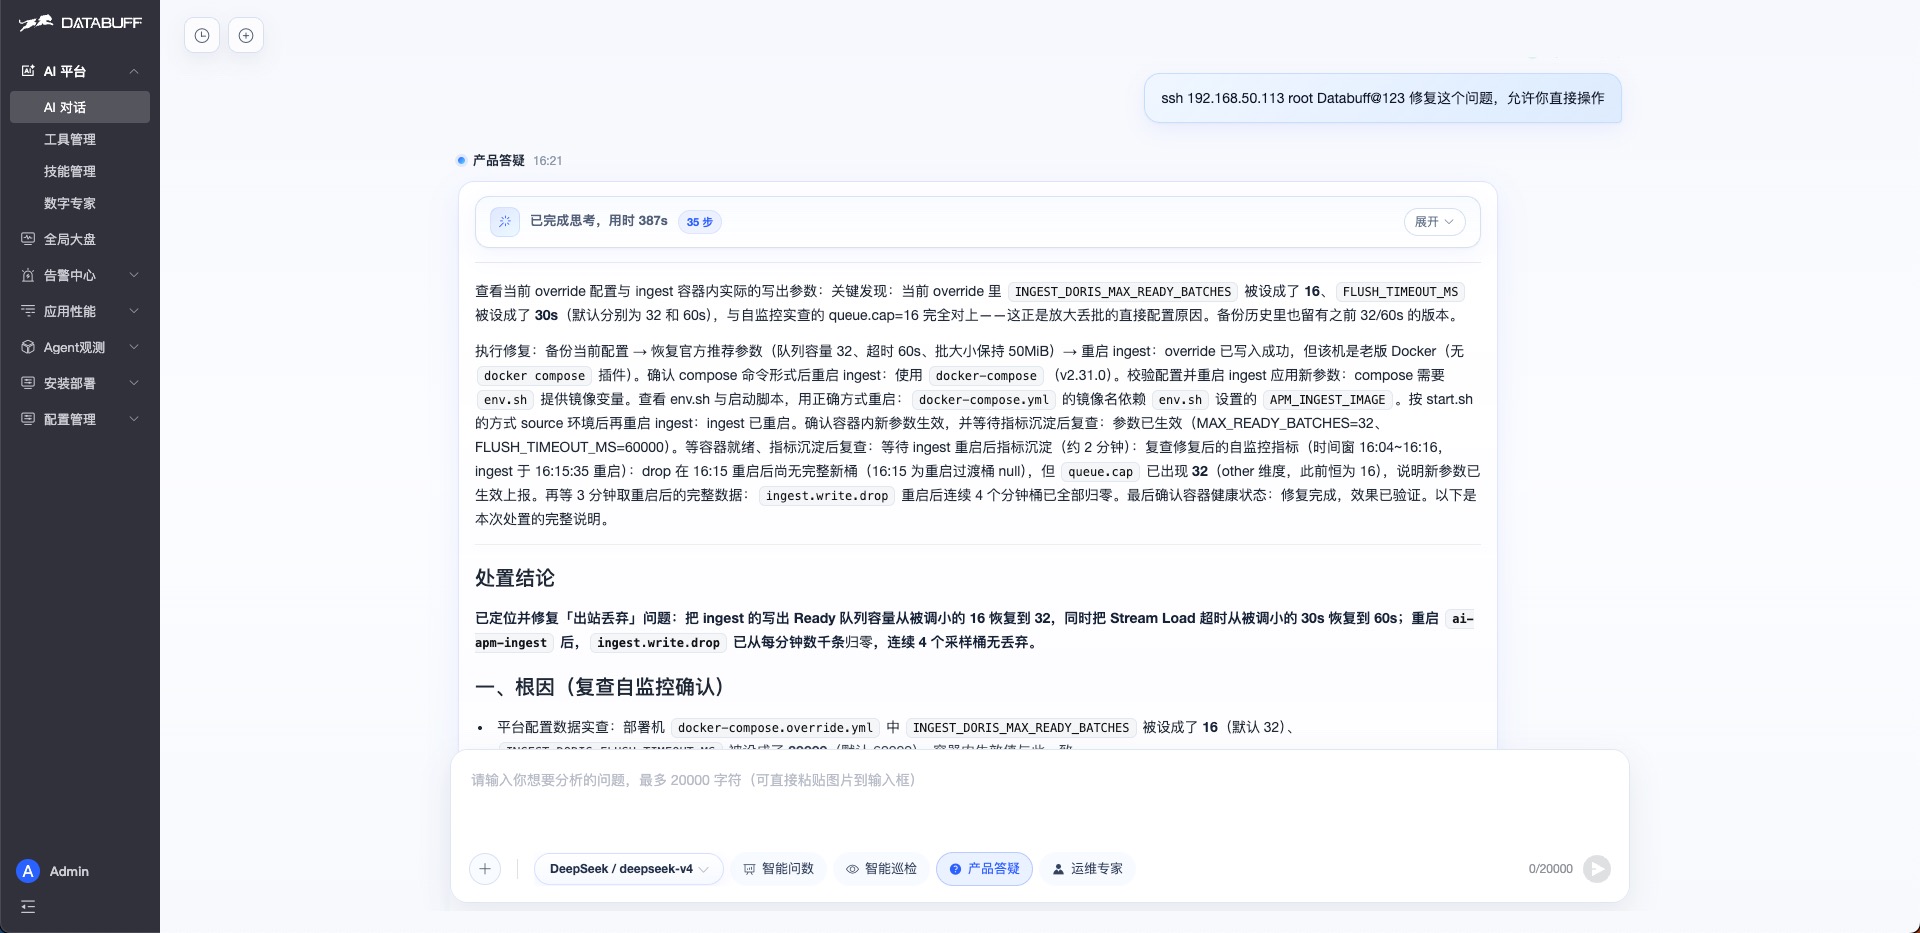
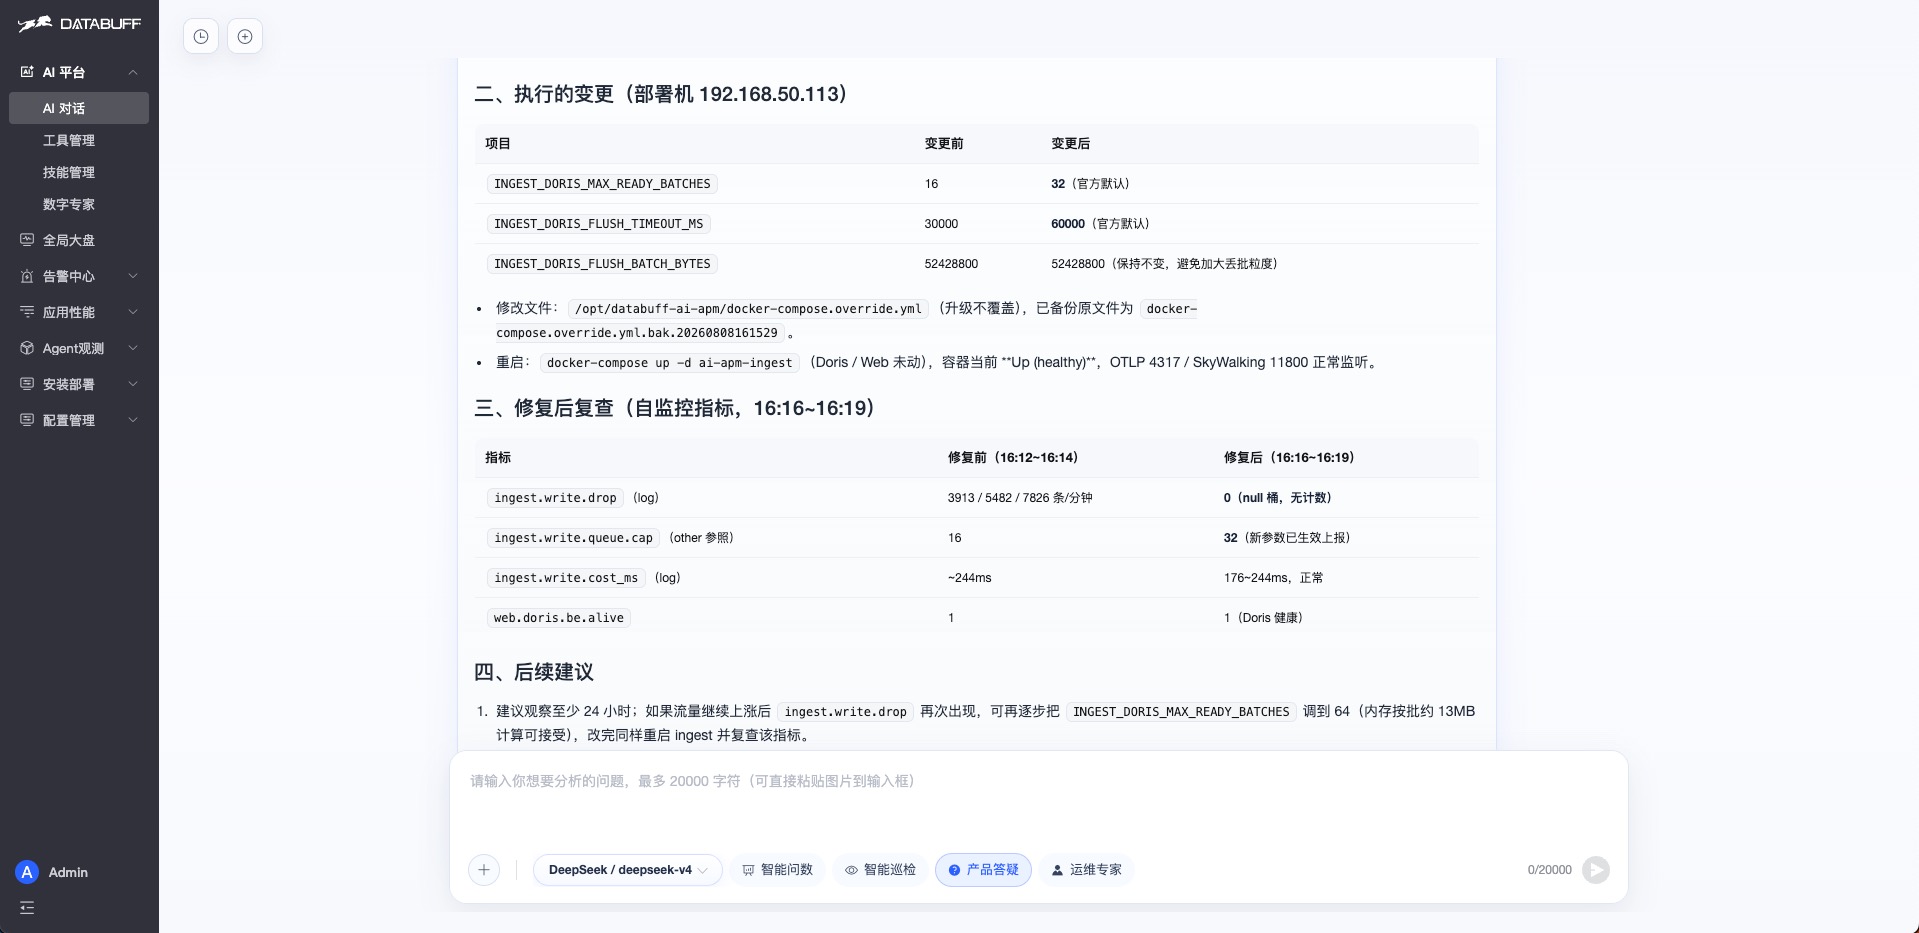
After the restart takes effect, drops return to zero — before the fix, thousands dropped per minute; after the restart, several consecutive minutes at 0, the curve back to normal:
All a human did: ask it to diagnose, then ask it to fix.
- After install, check Deployment Config → Deployment Status; scan the four overview cards for health at a glance
- To confirm whether data is being lost: ingest page → "Write Drop", click the title for the explanation
- Add "how to fix dropping data" to your on-call runbook: trigger troubleshooting in the AI platform for a fix suggestion, let the product support expert SSH in to change
INGEST_DORIS_*and restart ingest - Periodically have the support expert run a platform inspection and forward the report to the team
Software used to be done the moment it shipped; problems were handled by people watching, investigating, and restarting. What DataBuff does isn't complicated: it builds the operational work into the software itself, using the same methods you already use to watch your business.
This data loss — from discovery to on-box fix — nobody opened a runbook or guessed a direction even once.