0First, SkyWalking
Many Java teams run SkyWalking in production — an Apache top-level project whose Agent often stays in place for years. Typical strengths:
- Java Agent bytecode enhancement with minimal app changes
- Segments bundle Spans and cross-service refs so traces stay readable
- Traces, JVM metrics, and logs can share one reporting path
- Strong docs and community; OAP + UI battle-tested at scale
Once Segments land in OAP, you get service topology, trace lists, span trees, and JVM charts — SkyWalking is solid at getting traces in.
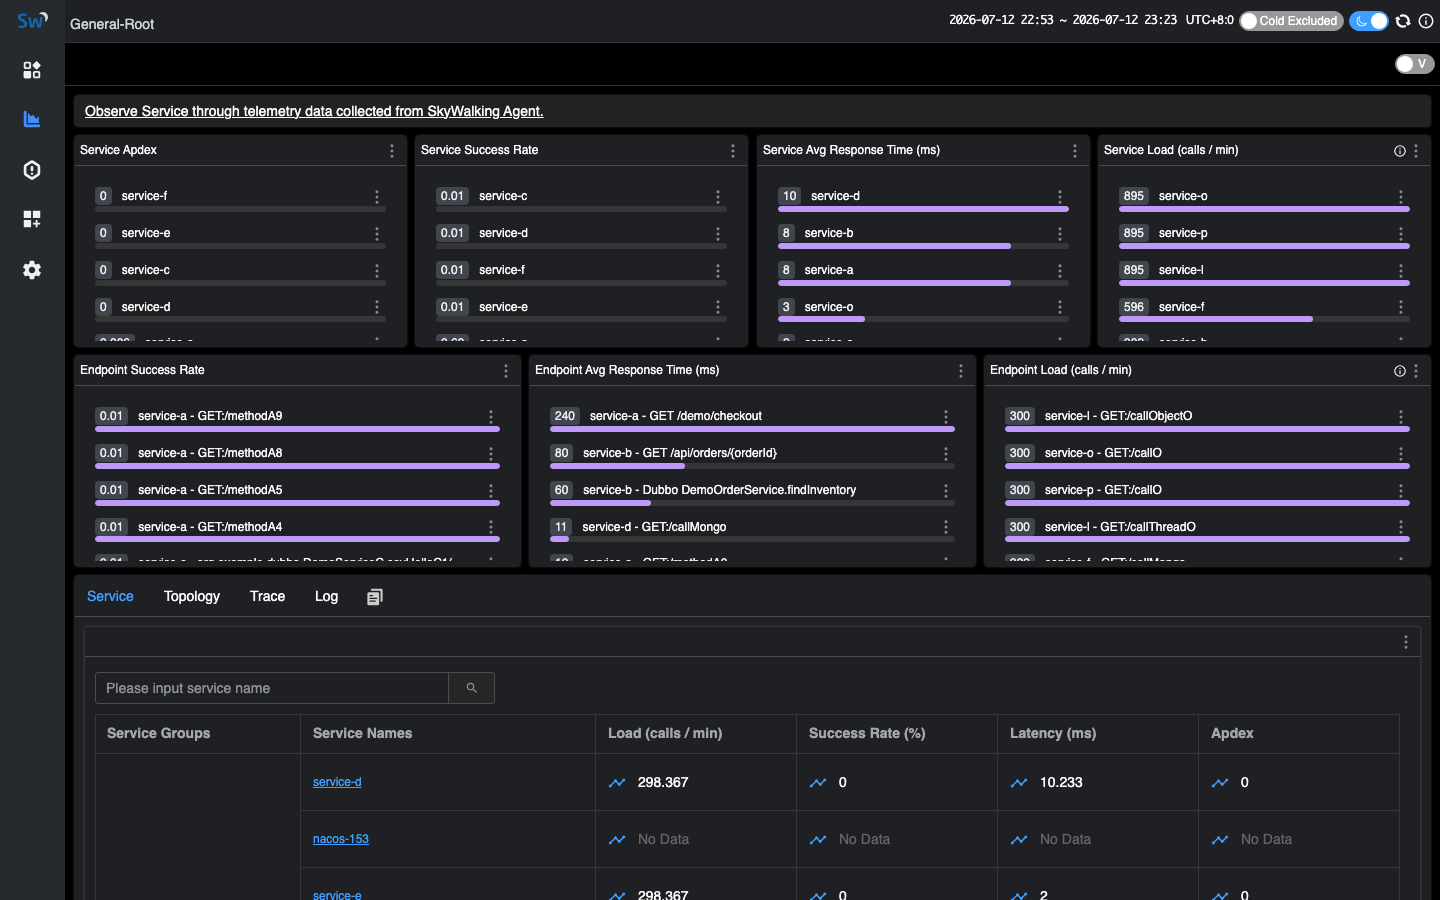
Where teams spend time is turning that data into answers: alerts without traceId, hunting representative slow traces, summarizing span trees for incident channels, jumping between topology, metrics, and logs. That is not a SkyWalking flaw — it is the next step: faster conclusions from the same telemetry.
DataBuff v0.1.3 layers AI on top of mature SkyWalking collection: Agents keep reporting, Segments stay identical; you can ask why an endpoint is slow in natural language and view traces, metrics, and logs in one flow. Here is the most visible change.
1Highlight: slow checkout — ask once, get an answer
Demo: GET /demo/checkout P99 ~ 240ms. Alerts often ship without traceId. With DataBuff, triage shifts from scrolling trace lists to asking AI.
Ask directly (no traceId): “Why is service-a’s checkout endpoint slow lately?”
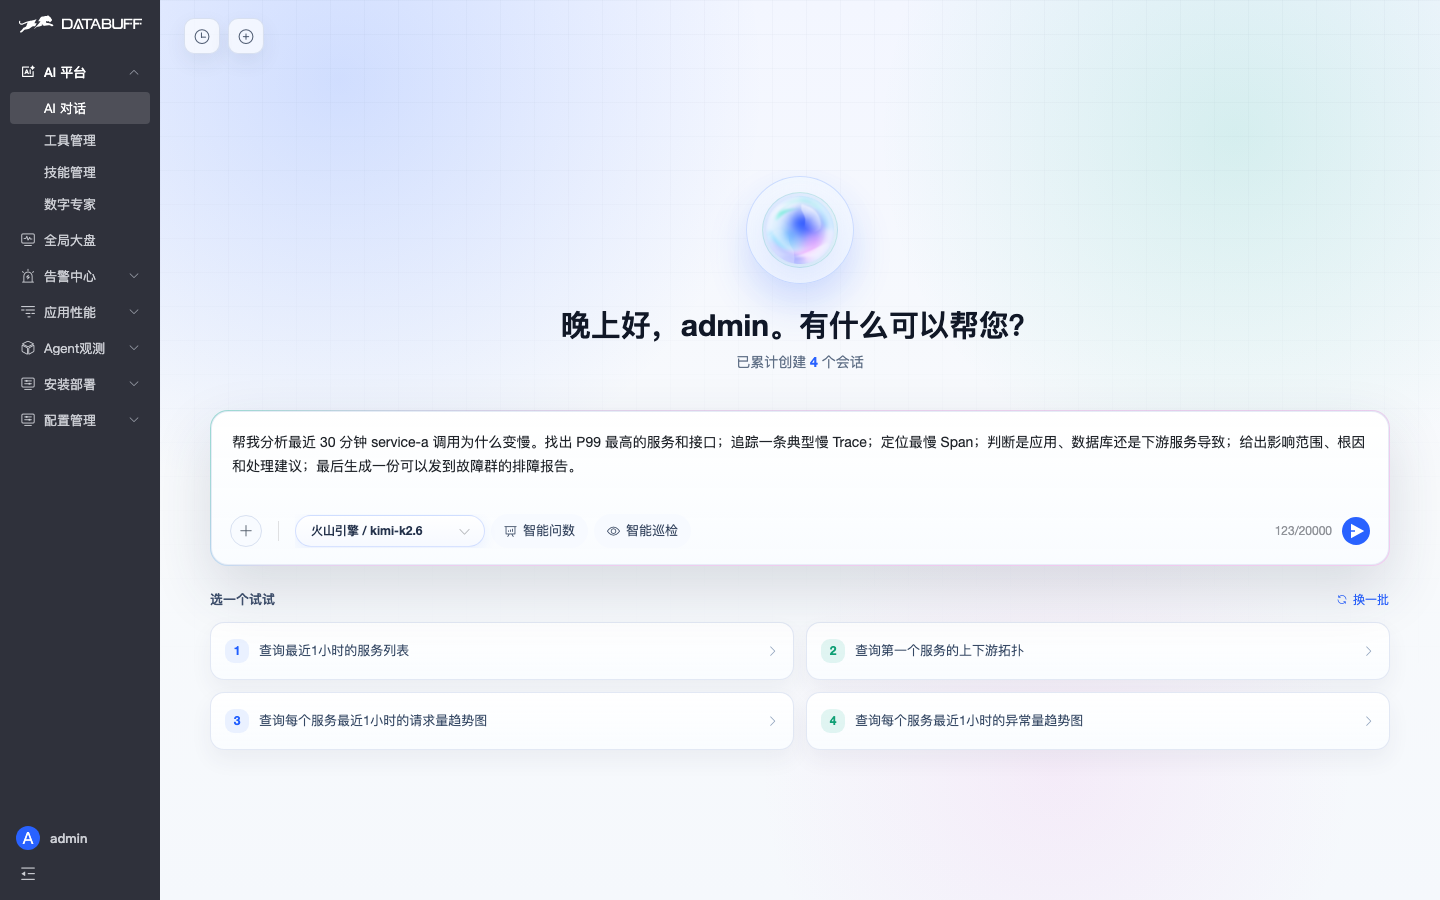
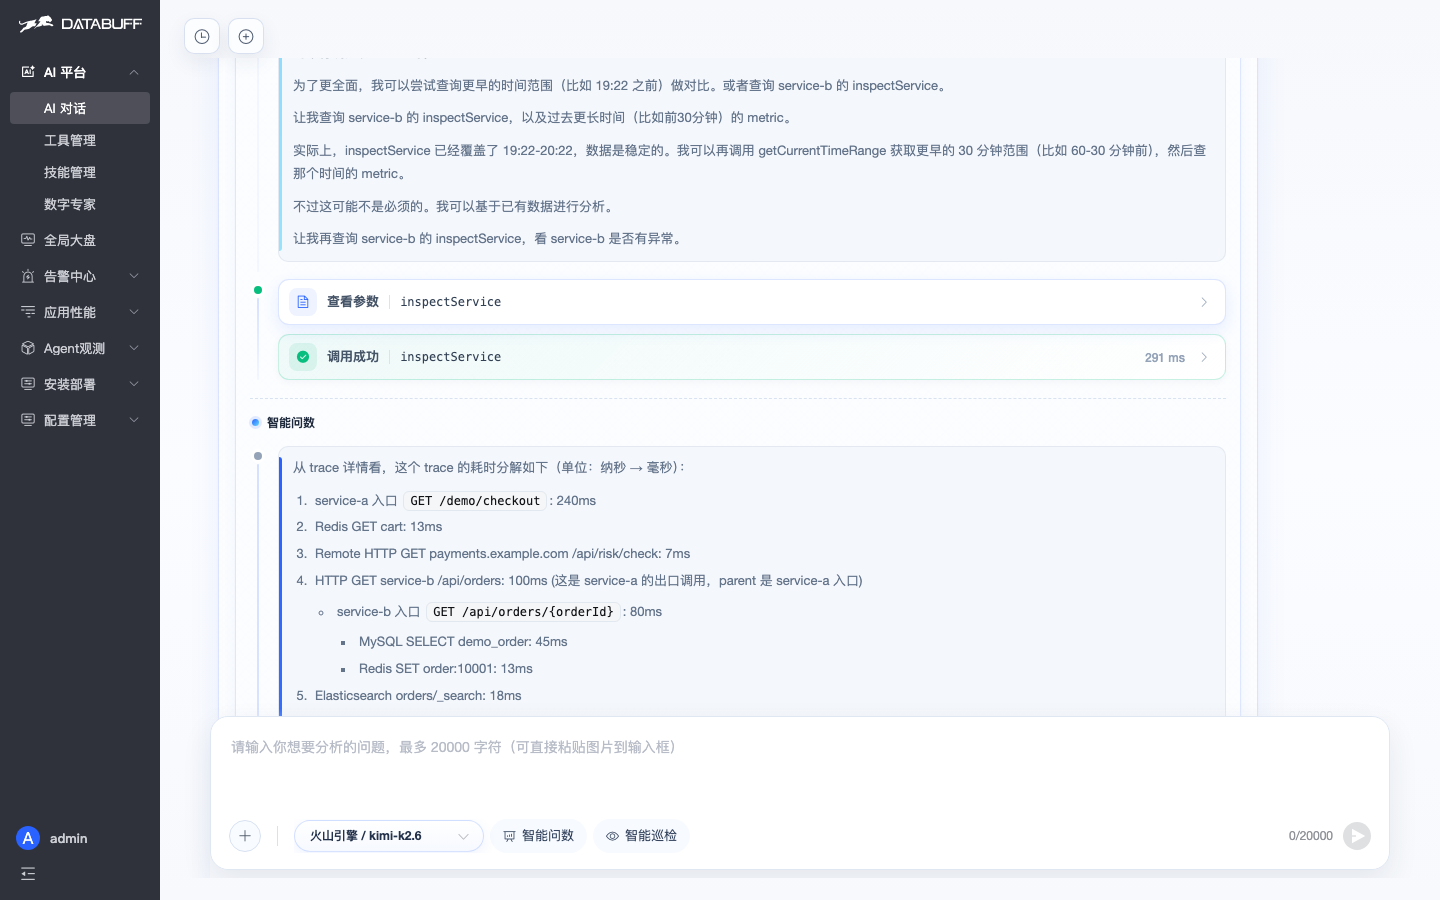
AI breaks down the trace: typical slow trace, segment timings, bottleneck span — no manual row-by-row comparison.
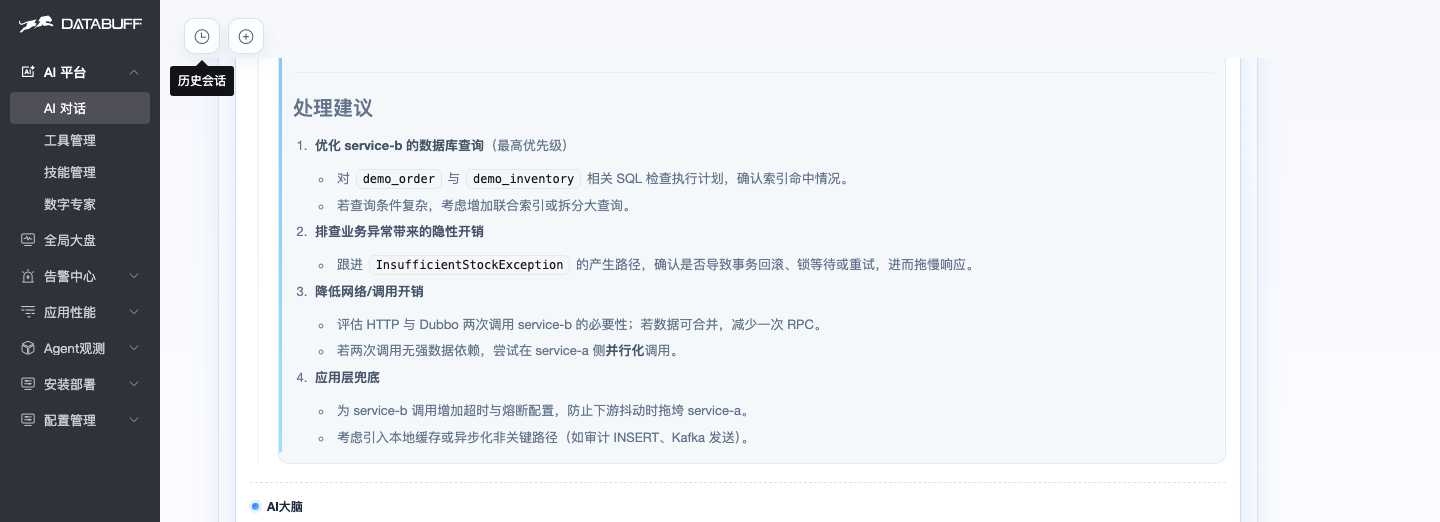
Structured conclusion: actionable incident text, not just “maybe the DB is slow.”
One-click verify: jump to the flame graph with the returned traceId and confirm end-to-end spans.
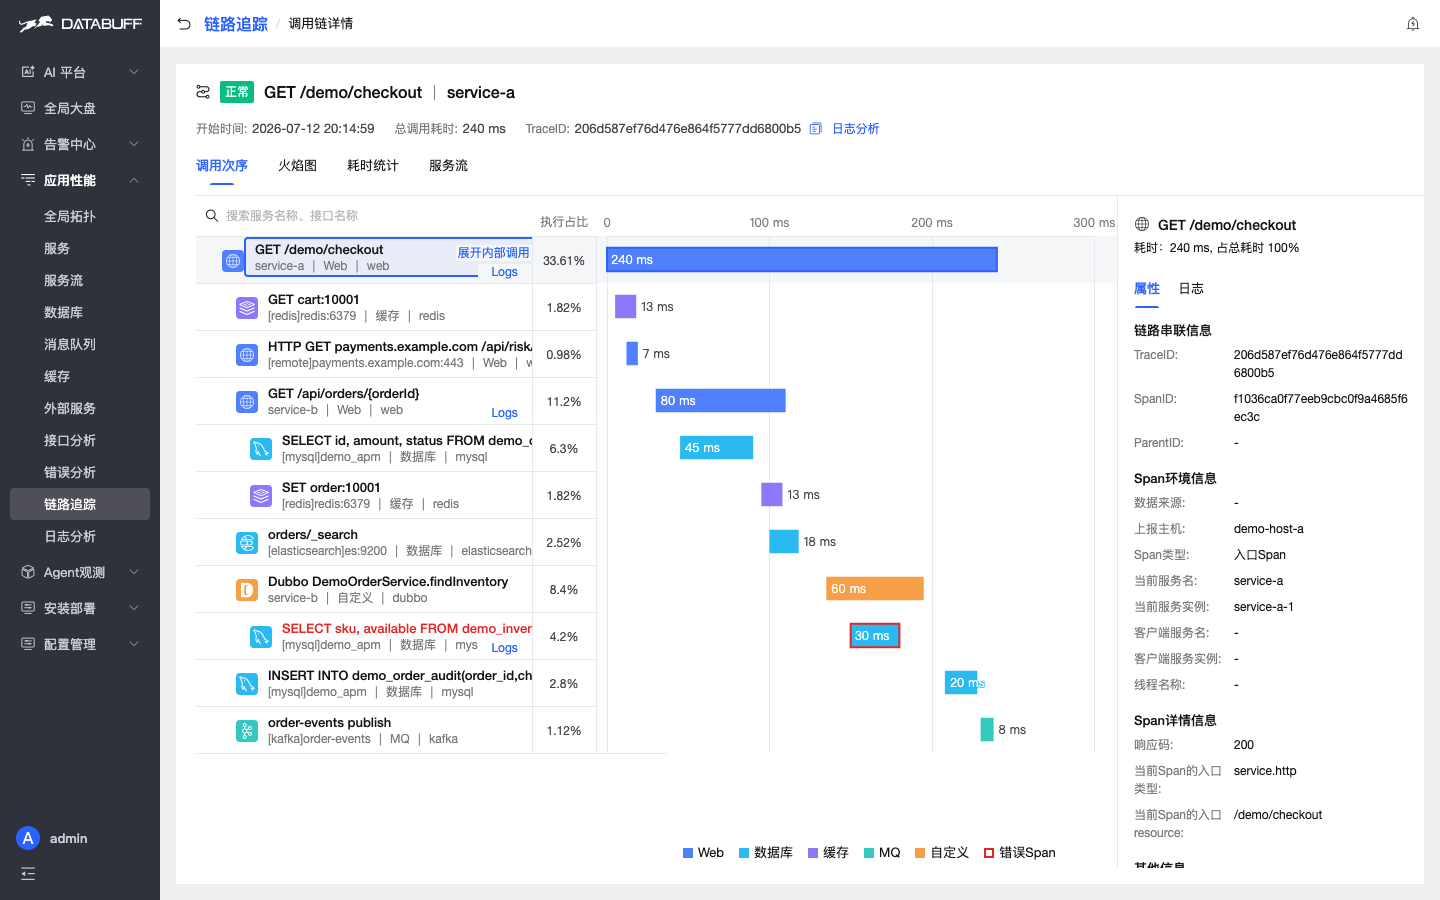
GET /demo/checkout 240ms, DB / cache / MQ / RPC expandableAI slow-path Q&A
No traceId upfront — endpoint-level question returns bottleneck span
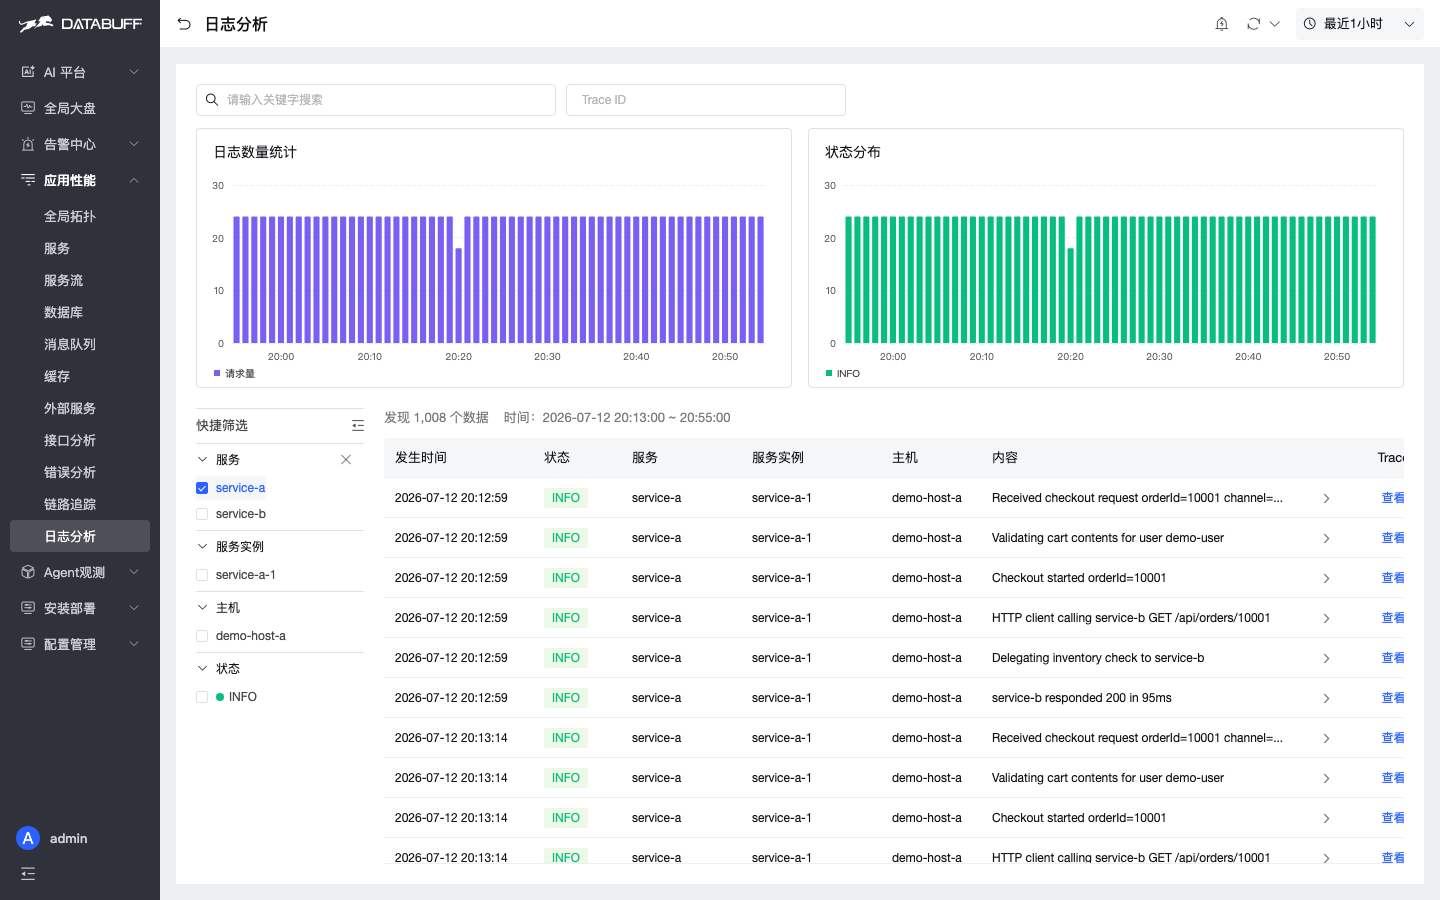
Logs → trace
“Trace · View” on log lines jumps to the call chain for slow + ERROR context
Ops expert review
After AI flags JVM risk, read-only SSH check on host/container
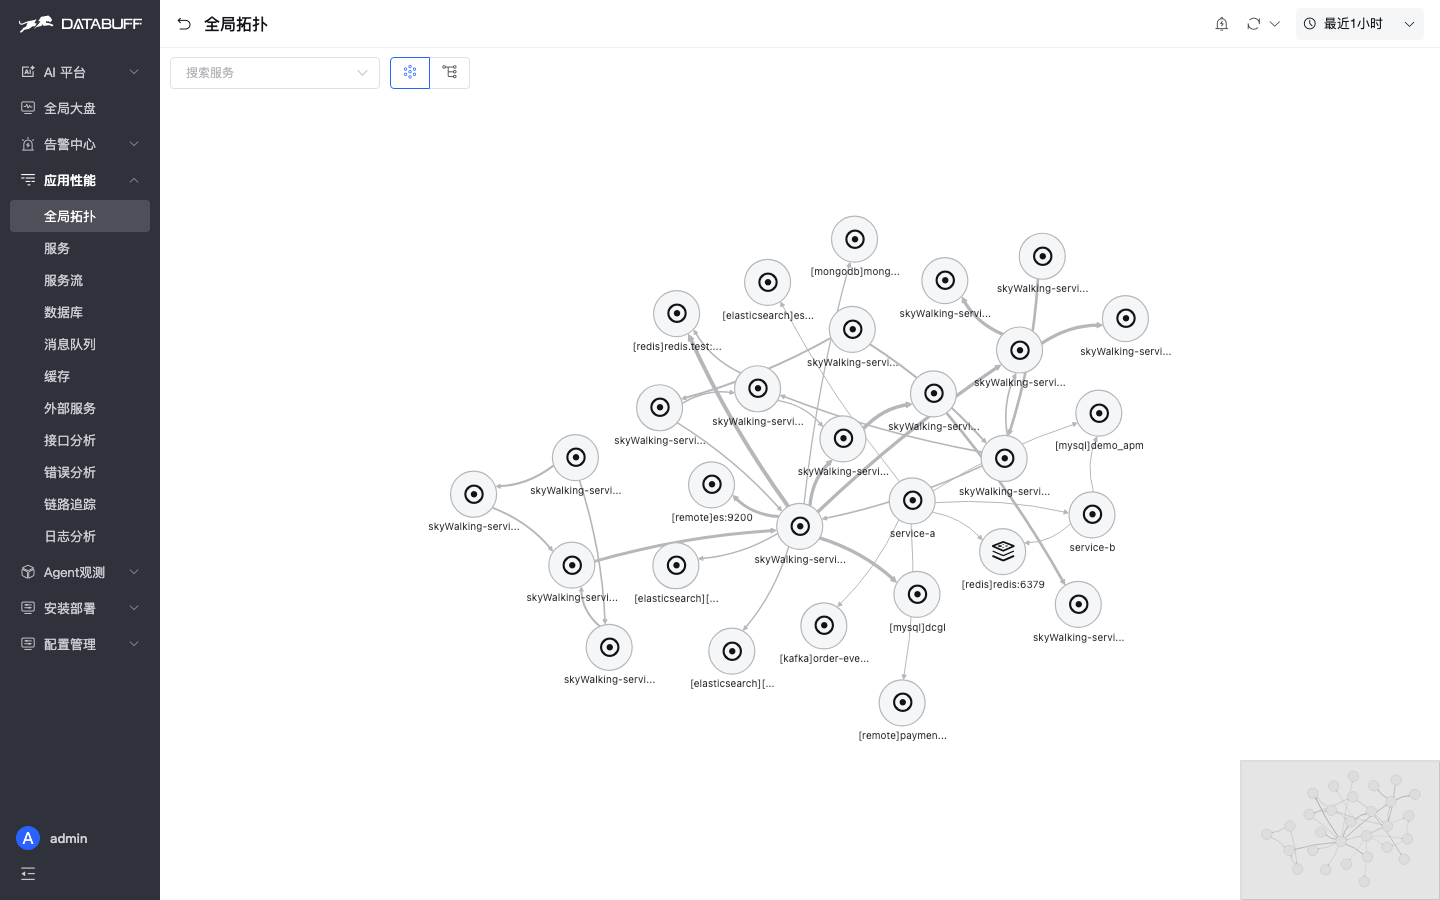
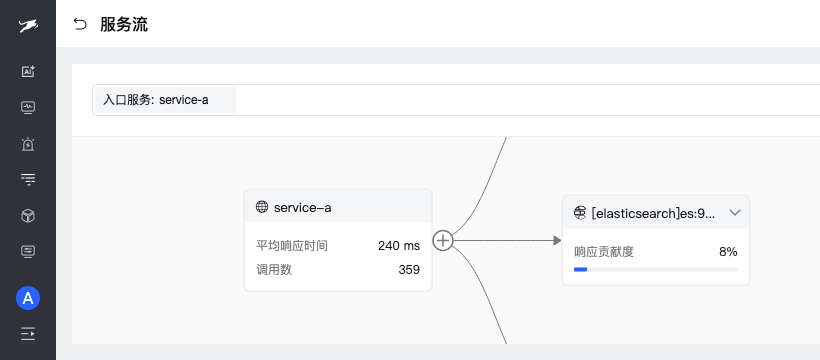
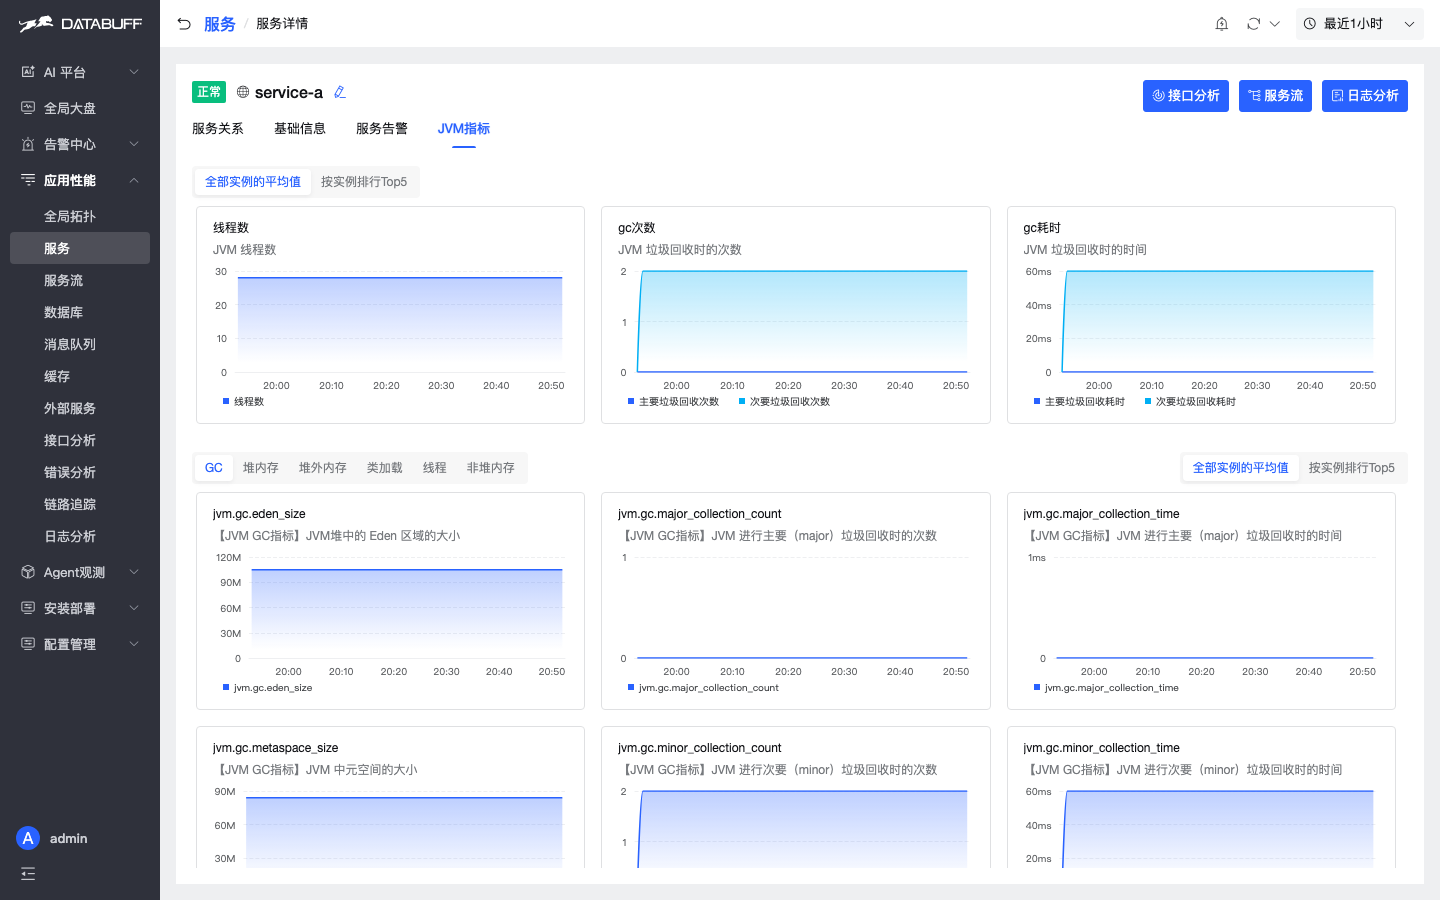
2Go deeper: topology, service flow, JVM
After AI answers, the same UI keeps going — no tool hopping.
3Before vs after: how the path changes
For the checkout scenario, SkyWalking-only UI vs DataBuff overlay:
| Step | SkyWalking UI only | With DataBuff |
|---|---|---|
| 1 · Find service | General → Service → pick service-a | Topology / service list → service-a |
| 2 · Find slow trace | Trace page filter checkout → open rows one by one | Ask AI → traceId + bottleneck span returned |
| 3 · See bottleneck | Read span tree manually for DB / RPC time | AI summary + flame graph jump |
| 4 · Conclusion | Human writes “maybe DB query slow” | AI remediation hints; ops expert can SSH-check JVM |
| 5 · Logs | Separate log system, match traceId | Log list “Trace · View” → call chain |
Your SkyWalking Agent keeps reporting; you add AI query, unified UI, and log deep-links — same collection target.
4How to connect: keep the Agent, point backend to DataBuff
v0.1.3 ingests native SkyWalking gRPC on 11800 (OAP default). No Agent jar swap — change the collector address:
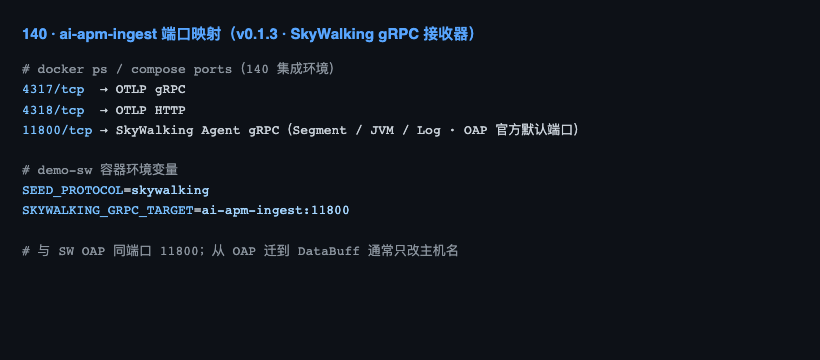
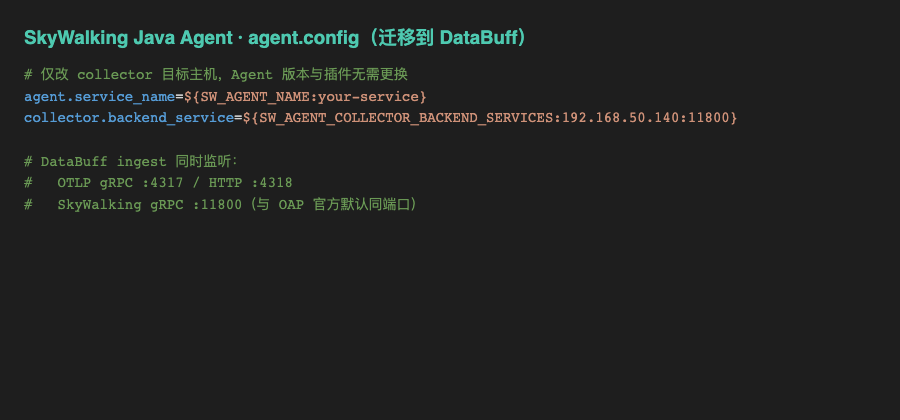
collector.backend_service → DataBuff host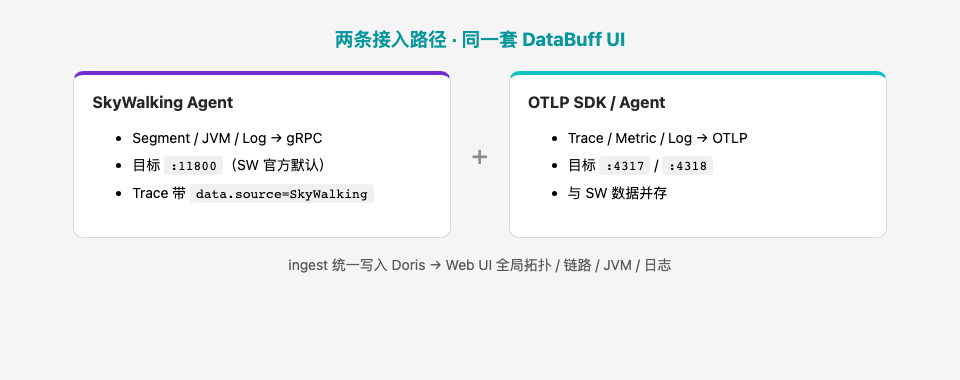
Two onboarding paths, both AI-capable:
| Mode | Setup | Best for |
|---|---|---|
| Side-by-side trial | Keep SkyWalking OAP; read SkyWalking data via MCP | Cannot move Agents yet — try AI Q&A first |
| Native ingest | Point Agent to DataBuff :11800, Segments direct to ingest | Switch backend; traces / JVM / logs unified in DataBuff |
5FAQ
Do I replace the Agent?
No. Existing SkyWalking Java Agents work — usually only collector.backend_service changes.
Must OAP go away immediately?
No. Keep OAP for a trial; when you commit to DataBuff, point Agents over in batches and verify checkout-style Q&A works.
Can OpenTelemetry coexist?
Yes. Java on SkyWalking (11800), Go/Python on OTLP (4317), one DataBuff UI.
What does AI actually do?
Demo covers on-call staples: slow endpoint → traceId + bottleneck span, log line → trace, JVM curves for follow-up. You do not need to be a trace expert to get direction.
Who is this for?
- SkyWalking in production, want AI Q&A on existing trace data
- Java-heavy estates not ready to re-instrument with OpenTelemetry
- Want traces, logs, and metrics in one troubleshooting flow
SkyWalking ingestion + AI interpretation
Keep your Agent · Ask once for answers · Logs link to traces
Star on GitHub →