Open Source APM Compared: SkyWalking vs Databuff vs Pinpoint Selection Guide
Open Source APM Selection · SkyWalking · Databuff · Pinpoint · AI Native
For engineering leaders evaluating open-source APM, SkyWalking, Databuff, and Pinpoint differ sharply in architecture and ops cost. Databuff centers on AI Native APM — multi-agent Q&A, inspection, and MCP woven into the Trace/metrics data plane — one of the most important dimensions to evaluate for intelligent ops today.
1Product Positioning at a Glance
All three are open-source APM tools, but capabilities and roadmaps diverge — AI-native capability is the dimension teams overlook most yet impacts long-term ops efficiency the most.
Databuff: AI Native APM
Databuff is listed on the OpenTelemetry.io official community Vendor registry[12] (Pure OSS · Native OTLP). Its core capability is AI Native APM — not a chat box bolted onto the UI, but a backend that unifies the OpenTelemetry data plane with a multi-agent platform:Ingest + Doris + Web — three core components. The Web tier handles queries, alerts, AI Q&A/inspection, and an MCP Server so Cursor, Claude, and other AI IDEs call real Traces and metrics[2].
AI paradigm: Multi-agent Q&A, inspection, and brain orchestration; answers must come from real APM data in Doris, not generic LLM guesses Extension framework: Skill + Tool + Expert layers; built-in MCP registers APM queries as Agent tools OTel strategy: OTLP is the sole ingestion standard — no proprietary agent on apps; AI shares the same data foundation
Positioning: "APM should not burden the ops team — minimal architecture, full features, out of the box." Run a minute-scale POC for distributed tracing while validating conversational Trace/metrics lookup and MCP workflows in parallel.
SkyWalking: Traditional Full-Stack Observability
SkyWalking is an open-source full-stack observability platform covering Trace, Metrics, Logs, and Events with a Probe + OAP + Storage + UI four-layer architecture[1].
AI boundary: AI Pipeline (URI pattern recognition, metric baselines, etc.) requires an external gRPC ML service; no built-in conversational APM assistant or official MCP integration[9] Ingestion: Proprietary probe format coexists with OTLP; default OTLP ports 11800/12800 differ from the OTel-standard 4317/4318 Best fit: Teams deeply invested in SkyWalking probes and storage who prioritize stability of legacy systems in the near term
Pinpoint: Veteran Java Bytecode APM
Pinpoint excels at JVM bytecode instrumentation with a typical Agent + Collector + Web + HBase/Pinot stack — proven in large Java legacy systems[3][4].
Strengths: Java code-level tracing, mature agent attach ( -javaagent)In progress: Collector supports OTLP Metrics; Trace via OTLP is still under community discussion[5]
◆ ◆ ◆
2Architecture and Deployment Complexity
The hidden cost of self-hosted APM is usually component count and storage ops, not the software license.
| Layer | Databuff | SkyWalking | Pinpoint |
|---|---|---|---|
| Collection | Any OTel SDK / Auto-Instrumentation | SkyWalking Agent / eBPF / Mesh probes | Pinpoint Java Agent(-javaagent) |
| Ingest / Analysis | Ingest(OTLP + aggregation pipeline) | OAP | Collector |
| Storage | Apache Doris(unified Trace + metrics storage) | ES / H2 / MySQL / TiDB / BanyanDB etc. | HBase / Pinot + Zookeeper etc.[4] |
| Platform / UI | Web(queries + alerts + AI + MCP, port 27403) | SkyWalking UI | Web |
| Core components | 3 Ingest + Doris + Web | 4+ Probe + OAP + Storage + UI | 5+ Agent + Collector + Web + storage cluster |
| Quick start | One-line install script[8] | Docker / K8s Helm / binary | Collector JAR + Web JAR + HBase/Pinot cluster |
| Demo resource floor | 8G sufficient (dev validation) | Depends on storage; typically 16G+ | HBase/Pinot cluster — heavier ops surface |
Deployment experience: Databuff compresses self-hosted APM and an AI-native platform to minutes with three components and one script; SkyWalking needs separate OAP, UI, and storage; Pinpoint has Java legacy wins but HBase/Pinot ops cost is high.
◆ ◆ ◆
3AI-Native Capability Comparison
The gap is not "AI yes/no" — it is whether AI and APM data are natively fused on one platform and one data source.
| Capability | Databuff (AI Native APM) | SkyWalking | Pinpoint |
|---|---|---|---|
| AI paradigm | AI Native Multi-agent Q&A / inspection / brain orchestration | ML pipeline URI patterns, metric baselines[9] | None |
| Conversational Trace/metrics | Natural language for error rates, Trace trends, service topology | No built-in conversational APM assistant | None |
| MCP / AI IDE | Native Web exposes MCP Server | No official MCP | None |
| LLM Agent observability | Roadmap Token and tool-chain topology | AI Pipeline for URI/baselines | None |
| Relation to OTel data plane | AI and Trace/Metric share Ingest→Doris | AI Pipeline parallel to OAP analysis chain | — |
Databuff Web includes an MCP Server exposing APM query tools (excerpt):
Why "AI Native": Q&A, inspection, and MCP tool calls read/write the same OTel-ingested data — ops engineers and AI Agents see the same Traces and metrics, not a disconnected RAG chat box.
Demo 1 · Intelligent Inspection
In the AI platform, choose intelligent inspection and describe a full-environment health check in natural language. The Agent calls queryServicesAll、inspectService、queryMetricData and similar tools to aggregate error rates and P99 latency per service and plot trends.
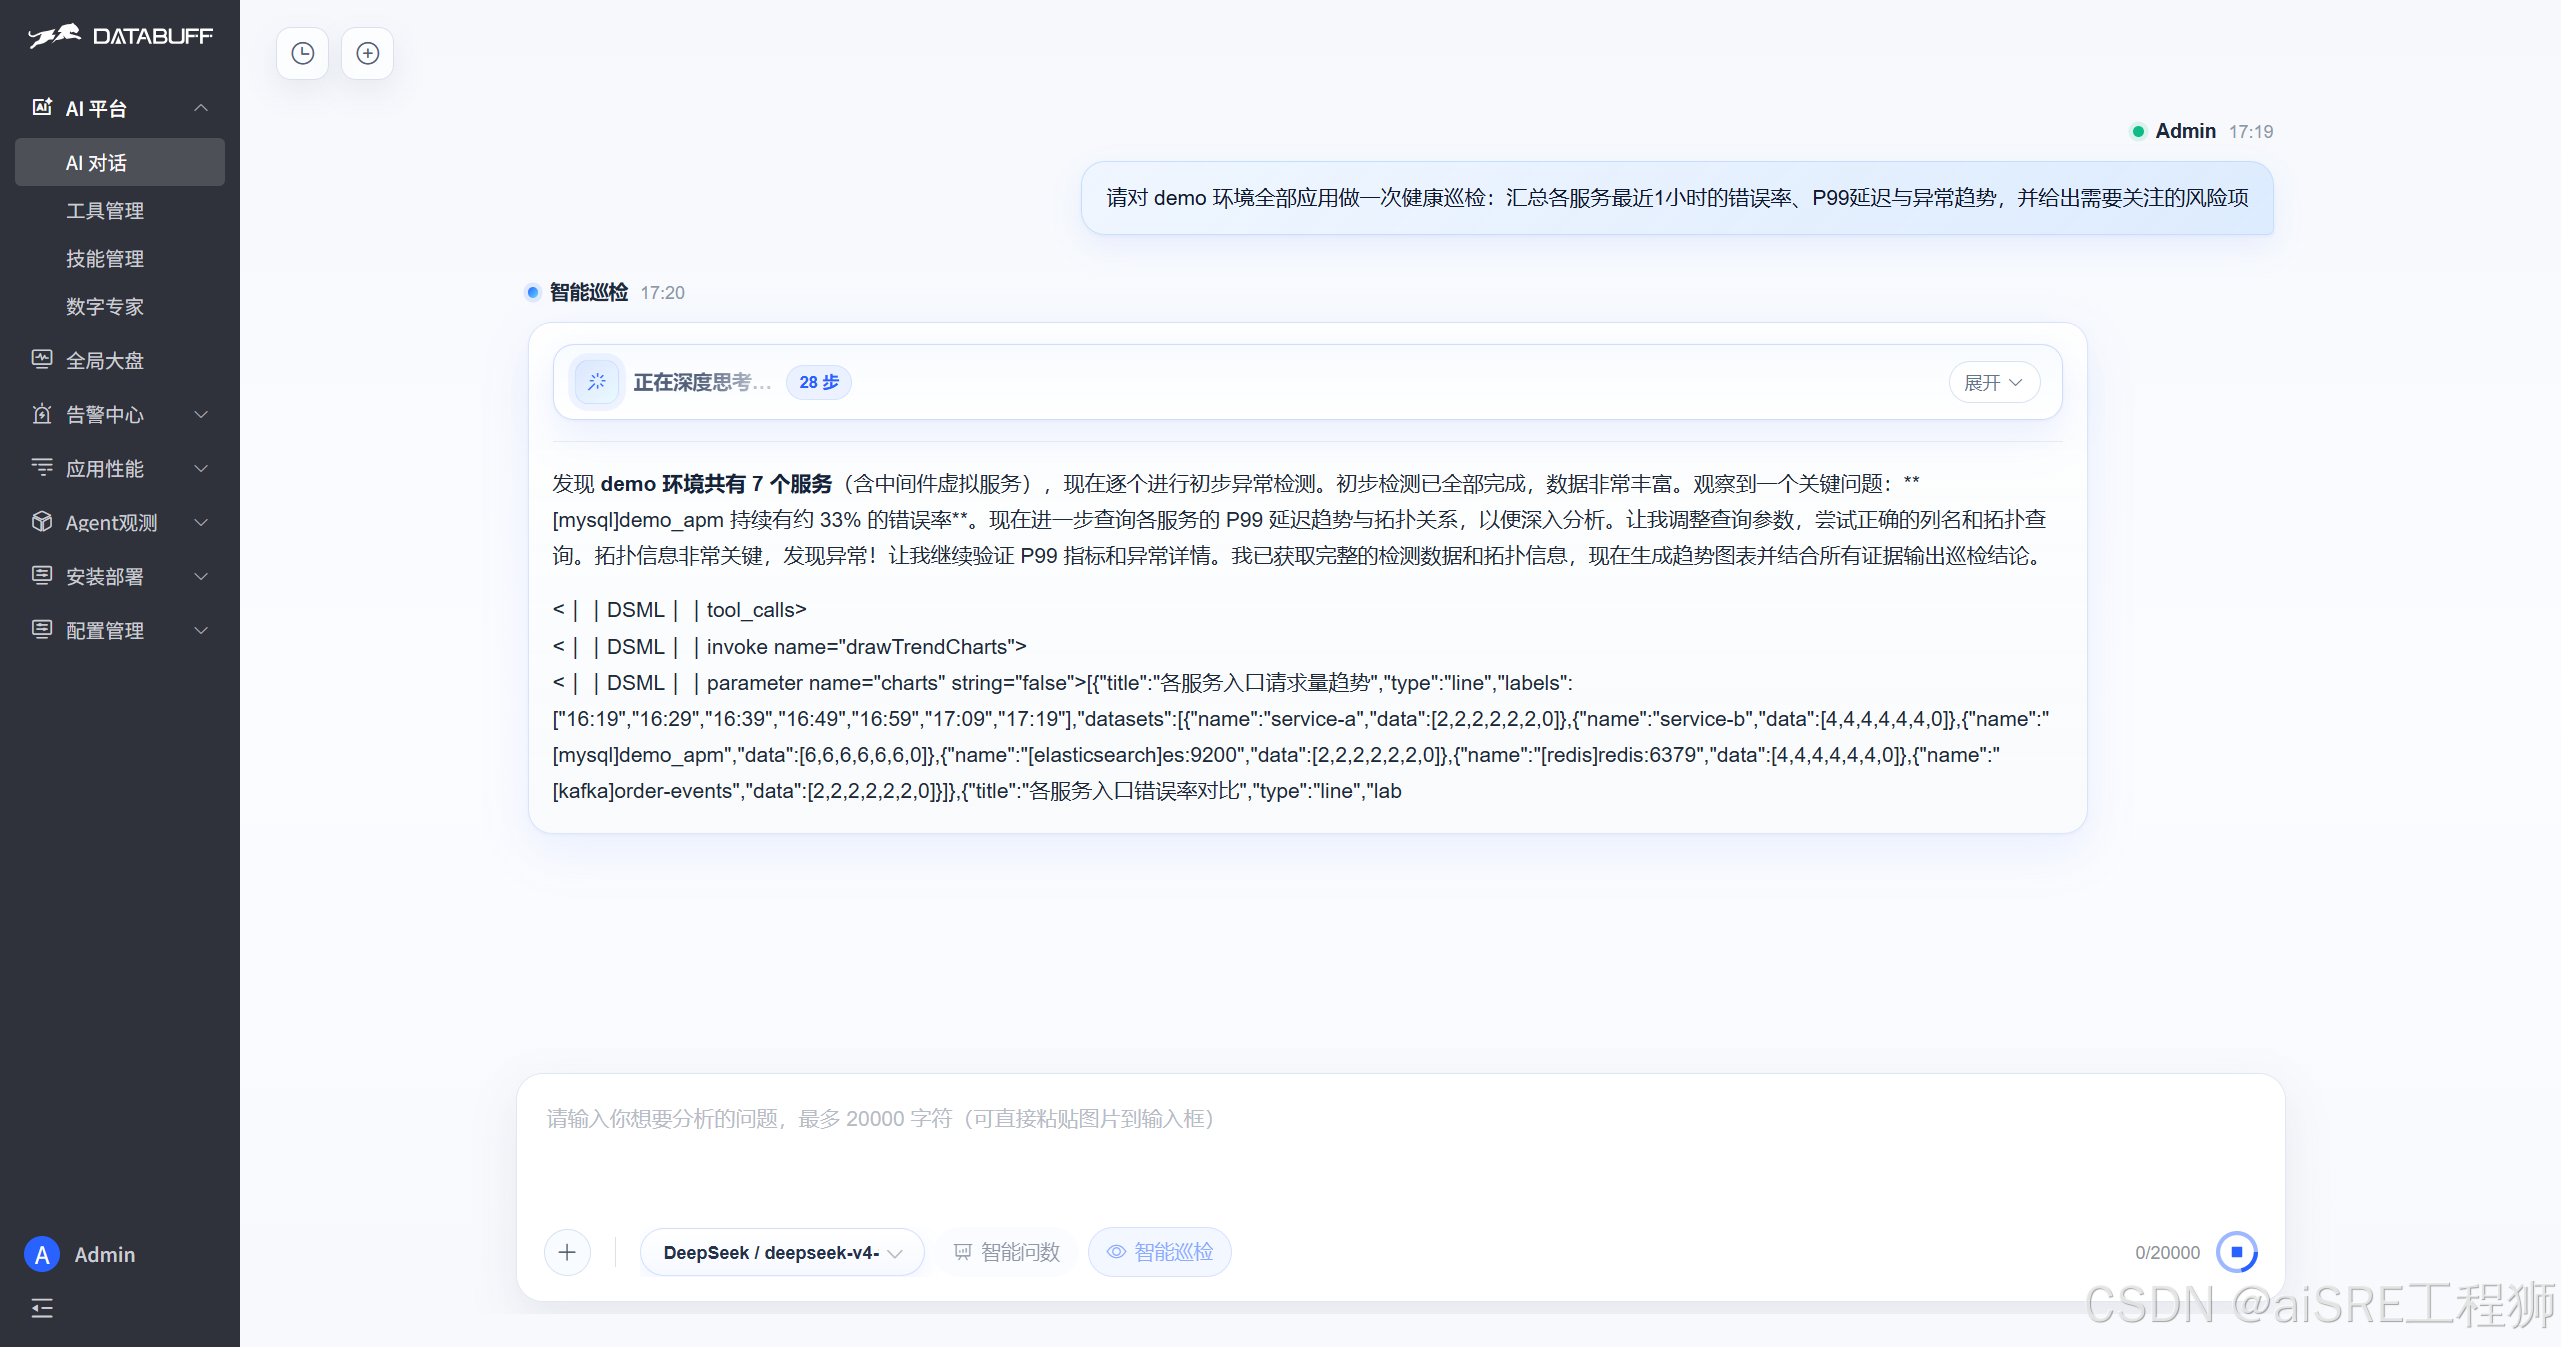
Databuff AI platform intelligent inspection
Demo 2 · Payment Chain Fault Diagnosis
Describe the symptom in natural language (e.g. "slow payment response"). The AI brain routes to inspection/Q&A experts, aggregates multi-source APM data, and returns structured findings: anomaly shortlist, call-chain latency breakdown (MySQL / Redis / Dubbo segments), and next steps.
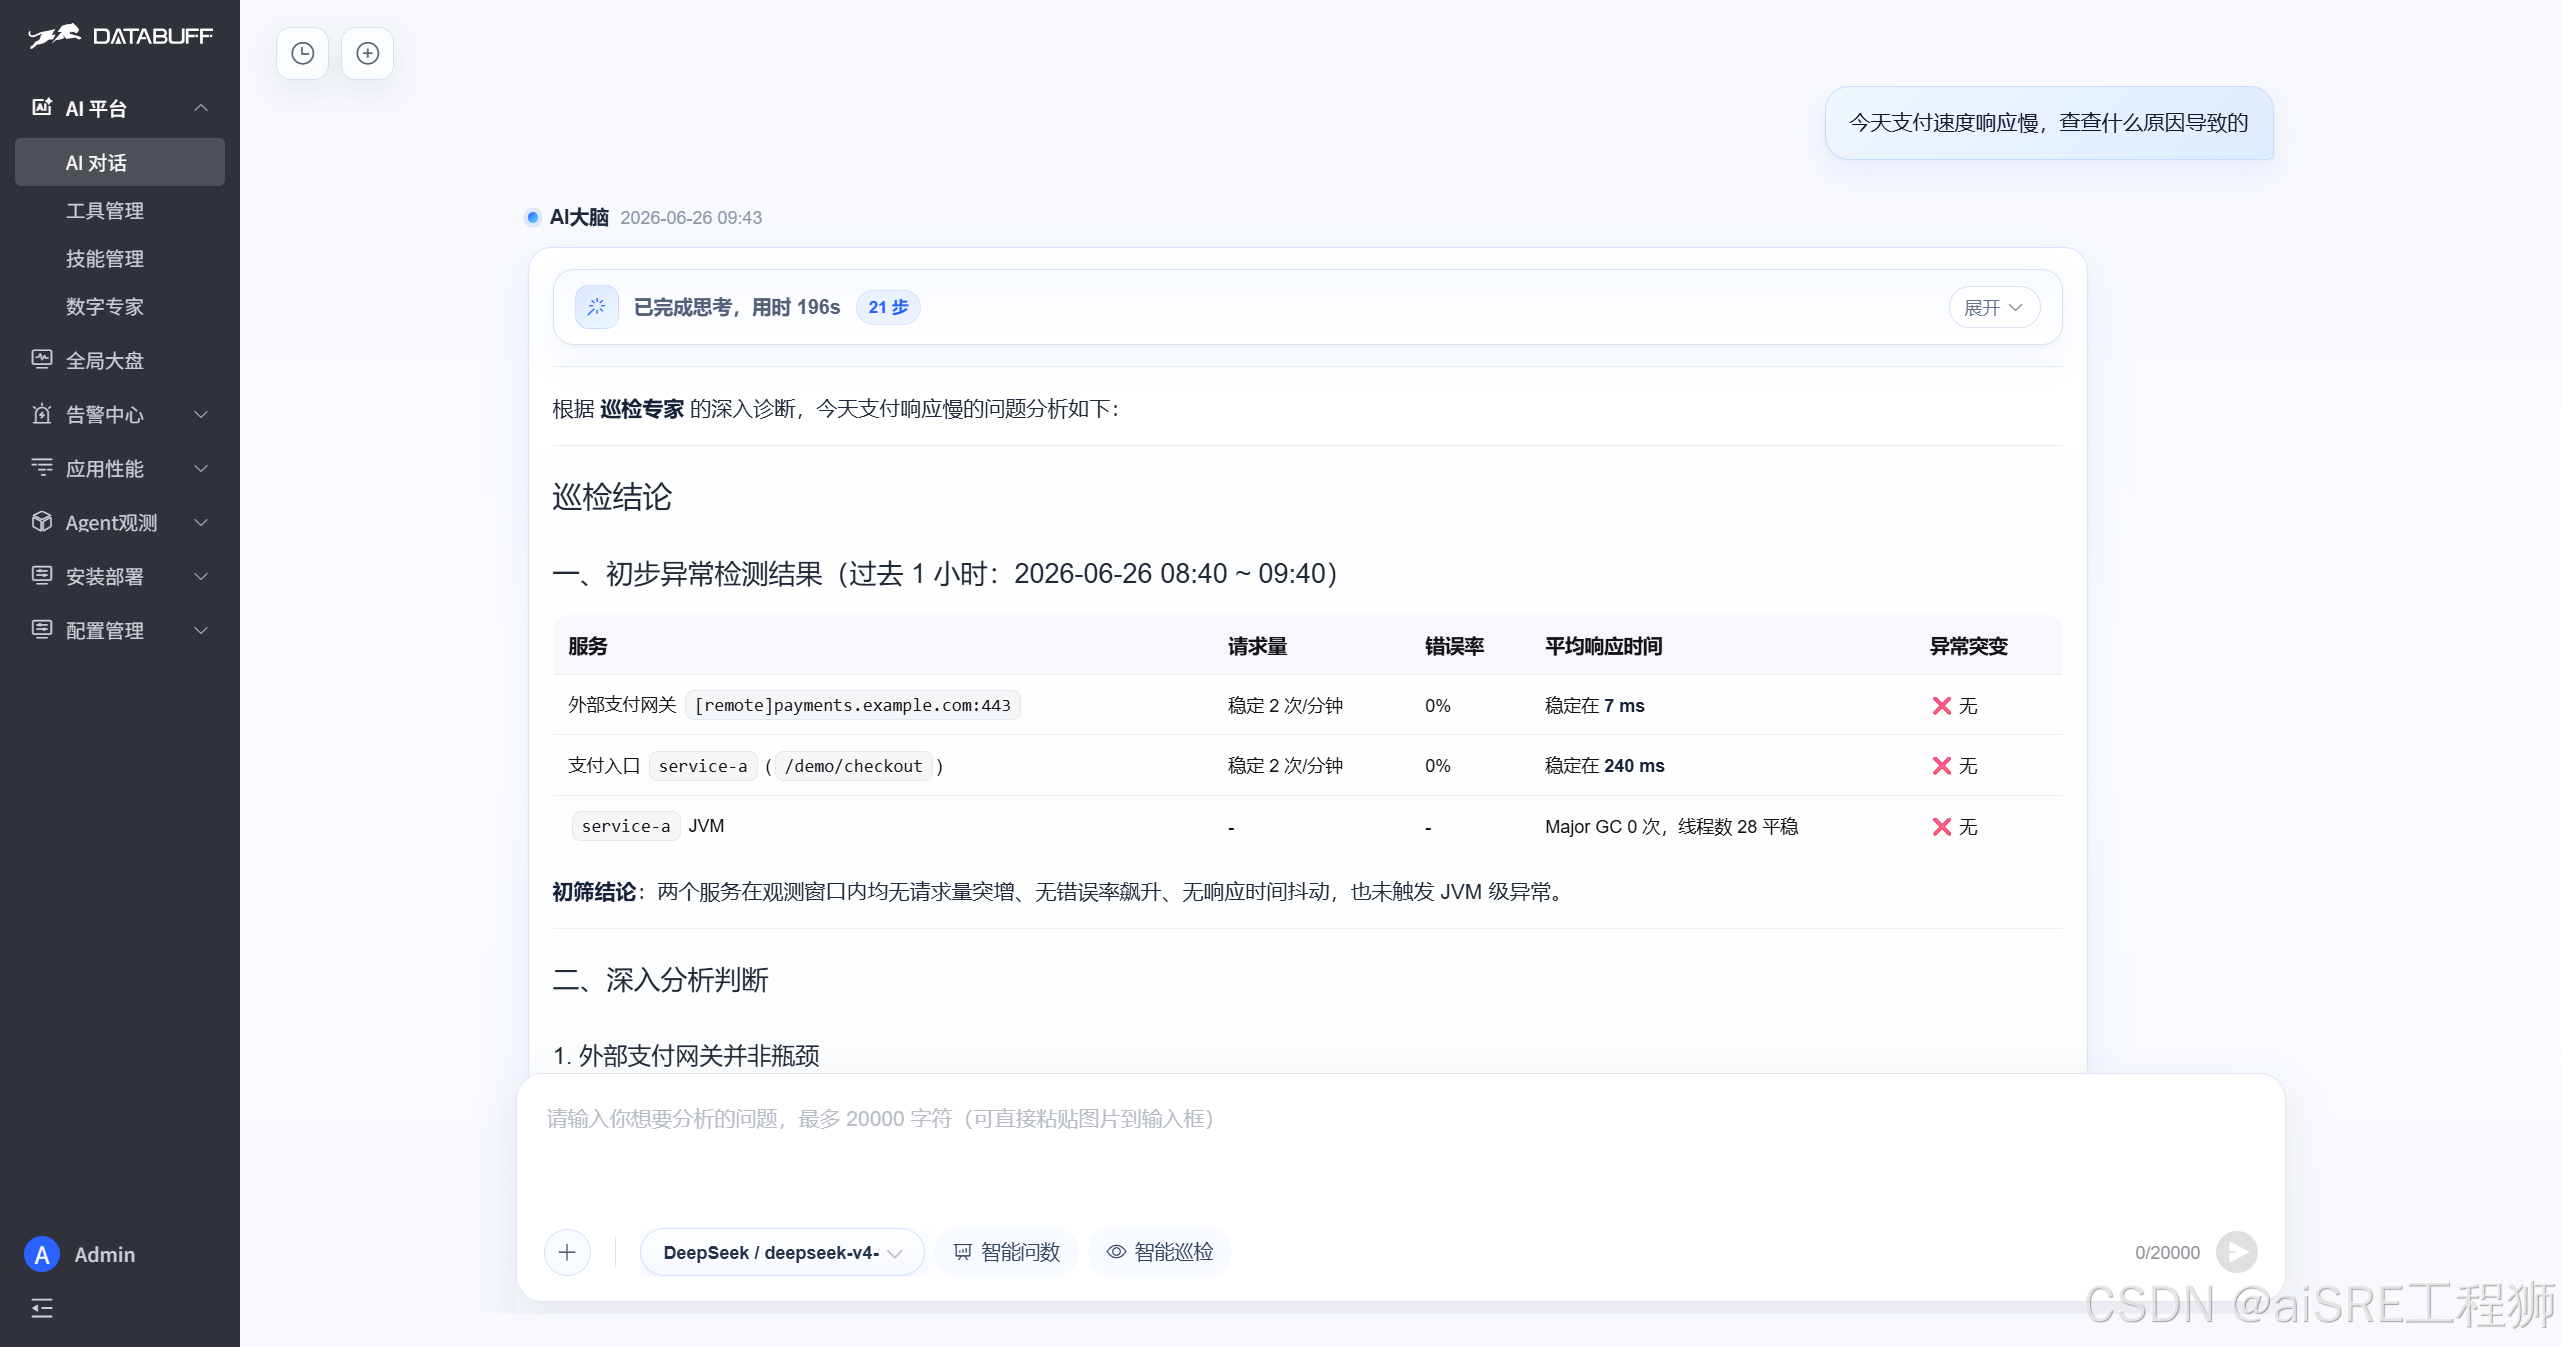
Databuff AI platform fault diagnosis conclusion
◆ ◆ ◆
4Capability Matrix
| Dimension | Databuff | SkyWalking | Pinpoint |
|---|---|---|---|
| Distributed tracing | Yes Trace + topology + slow requests + AI Q&A integration | Yes core capability | Yes deep Java call stacks |
| Metrics / service indicators | Yes OTLP Metric + Doris aggregation | Yes four-pillar Metrics | Yes + OTLP Metric support |
| Logs / Events | Roadmap OTLP Logs | Yes Logs + Events | Limited not four-pillar focused |
| AI / conversational Q&A | AI Native APM multi-agent · MCP | ML pipeline non-conversational[9] | None |
| MCP / AI IDE integration | Native MCP Server | None | None |
| Deep Java tracing | Yes via OTel Java Agent | Proprietary agent SkyWalking Java Agent | Strength bytecode instrumentation |
| Service Mesh / eBPF | Roadmap eBPF enhancement | Optional Istio/Envoy / eBPF[1] | None |
| OTLP unified ingestion | Sole standard 4317/4318 | Supported multiple formats coexist | Partial Metrics supported; Trace evolving |
| LLM Agent observability | Roadmap Token / tool-chain topology | None | None |
Databuff roadmap: OTel logs · Agent observability · eBPF non-intrusive APM
◆ ◆ ◆
5Scenario-Based Selection
Prefer Databuff (AI Native APM) if…
You need AI Native APM: conversational Trace/metrics, multi-agent inspection, MCP integrated with Cursor/Claude Your strategy is OpenTelemetry unified ingestion — one OTel SDK/Collector on apps You want minimal self-host: three components, 8G Demo, one-command deploy, minute-scale POC for tracing and AI Q&A You are building LLM Agent observability or intelligent ops
Prefer Pinpoint if…
Your team is Java-first and needs deep bytecode-level stacks You already operate HBase / Pinot and accept a heavier storage stack
Stay on SkyWalking only in these narrow cases…
Deeply bound to SkyWalking proprietary probes and ES/BanyanDB storage Must collect Logs + Events in-stack and accept OAP + storage multi-component ops Not for: conversational APM, MCP, or AI-native Q&A/inspection — evaluate Databuff first
| Scenario | Recommendation | Rationale |
|---|---|---|
| AI Native APM · Q&A/inspection/MCP | Databuff | AI Native · multi-agent · MCP · same OTel data plane |
| OTel unified strategy · minute-scale POC | Databuff | OTLP sole standard · three components · runs on 8G |
| Intelligent ops · Cursor/Claude workflow | Databuff | Built-in MCP Server |
| Large-scale Java · deep bytecode tracing | Pinpoint | Java specialist · deep stack display |
| Legacy SkyWalking stack · no short-term migration | SkyWalking | Continue proprietary probes and storage |
| Four pillars + ES/BanyanDB ops investment | SkyWalking (fallback) | More signal types |
◆ ◆ ◆
6References
1. [1] : https://skywalking.apache.org/docs/main/latest/en/concepts-and-designs/overview/
2. [2] : https://github.com/databufflabs/databuff
3. [3] : https://pinpoint-apm.gitbook.io/pinpoint/main
4. [4] : https://pinpoint-apm.gitbook.io/pinpoint/getting-started/installation
5. [5] : https://github.com/pinpoint-apm/pinpoint/issues/9586
6. [6] : https://github.com/apache/skywalking/pull/13826
7. [7] : https://skywalking.apache.org/docs/main/latest/en/setup/backend/otlp-trace/
8. [8] : https://databuff.ai/databuff/ai-apm-install.sh
9. [9] : https://skywalking.apache.org/docs/main/next/en/setup/ai-pipeline/introduction/
10. [10] : https://skywalking.apache.org/
11. [11] : https://github.com/pinpoint-apm/pinpoint
12. [12] OpenTelemetry community Vendor registry : https://opentelemetry.io/ecosystem/vendors/
◆ ◆ ◆