Same-host lab: DataBuff (OTLP :4318) and SkyWalking (Agent gRPC :31180) side by side on the same Demo (service-a / service-b). Host: 192.168.50.140 · DataBuff v0.1.7 · SkyWalking 10.4.0. Marks: ✅ verified in this lab · △ present but limited · ❌ no equivalent. Green bold cells are clear DataBuff leads.
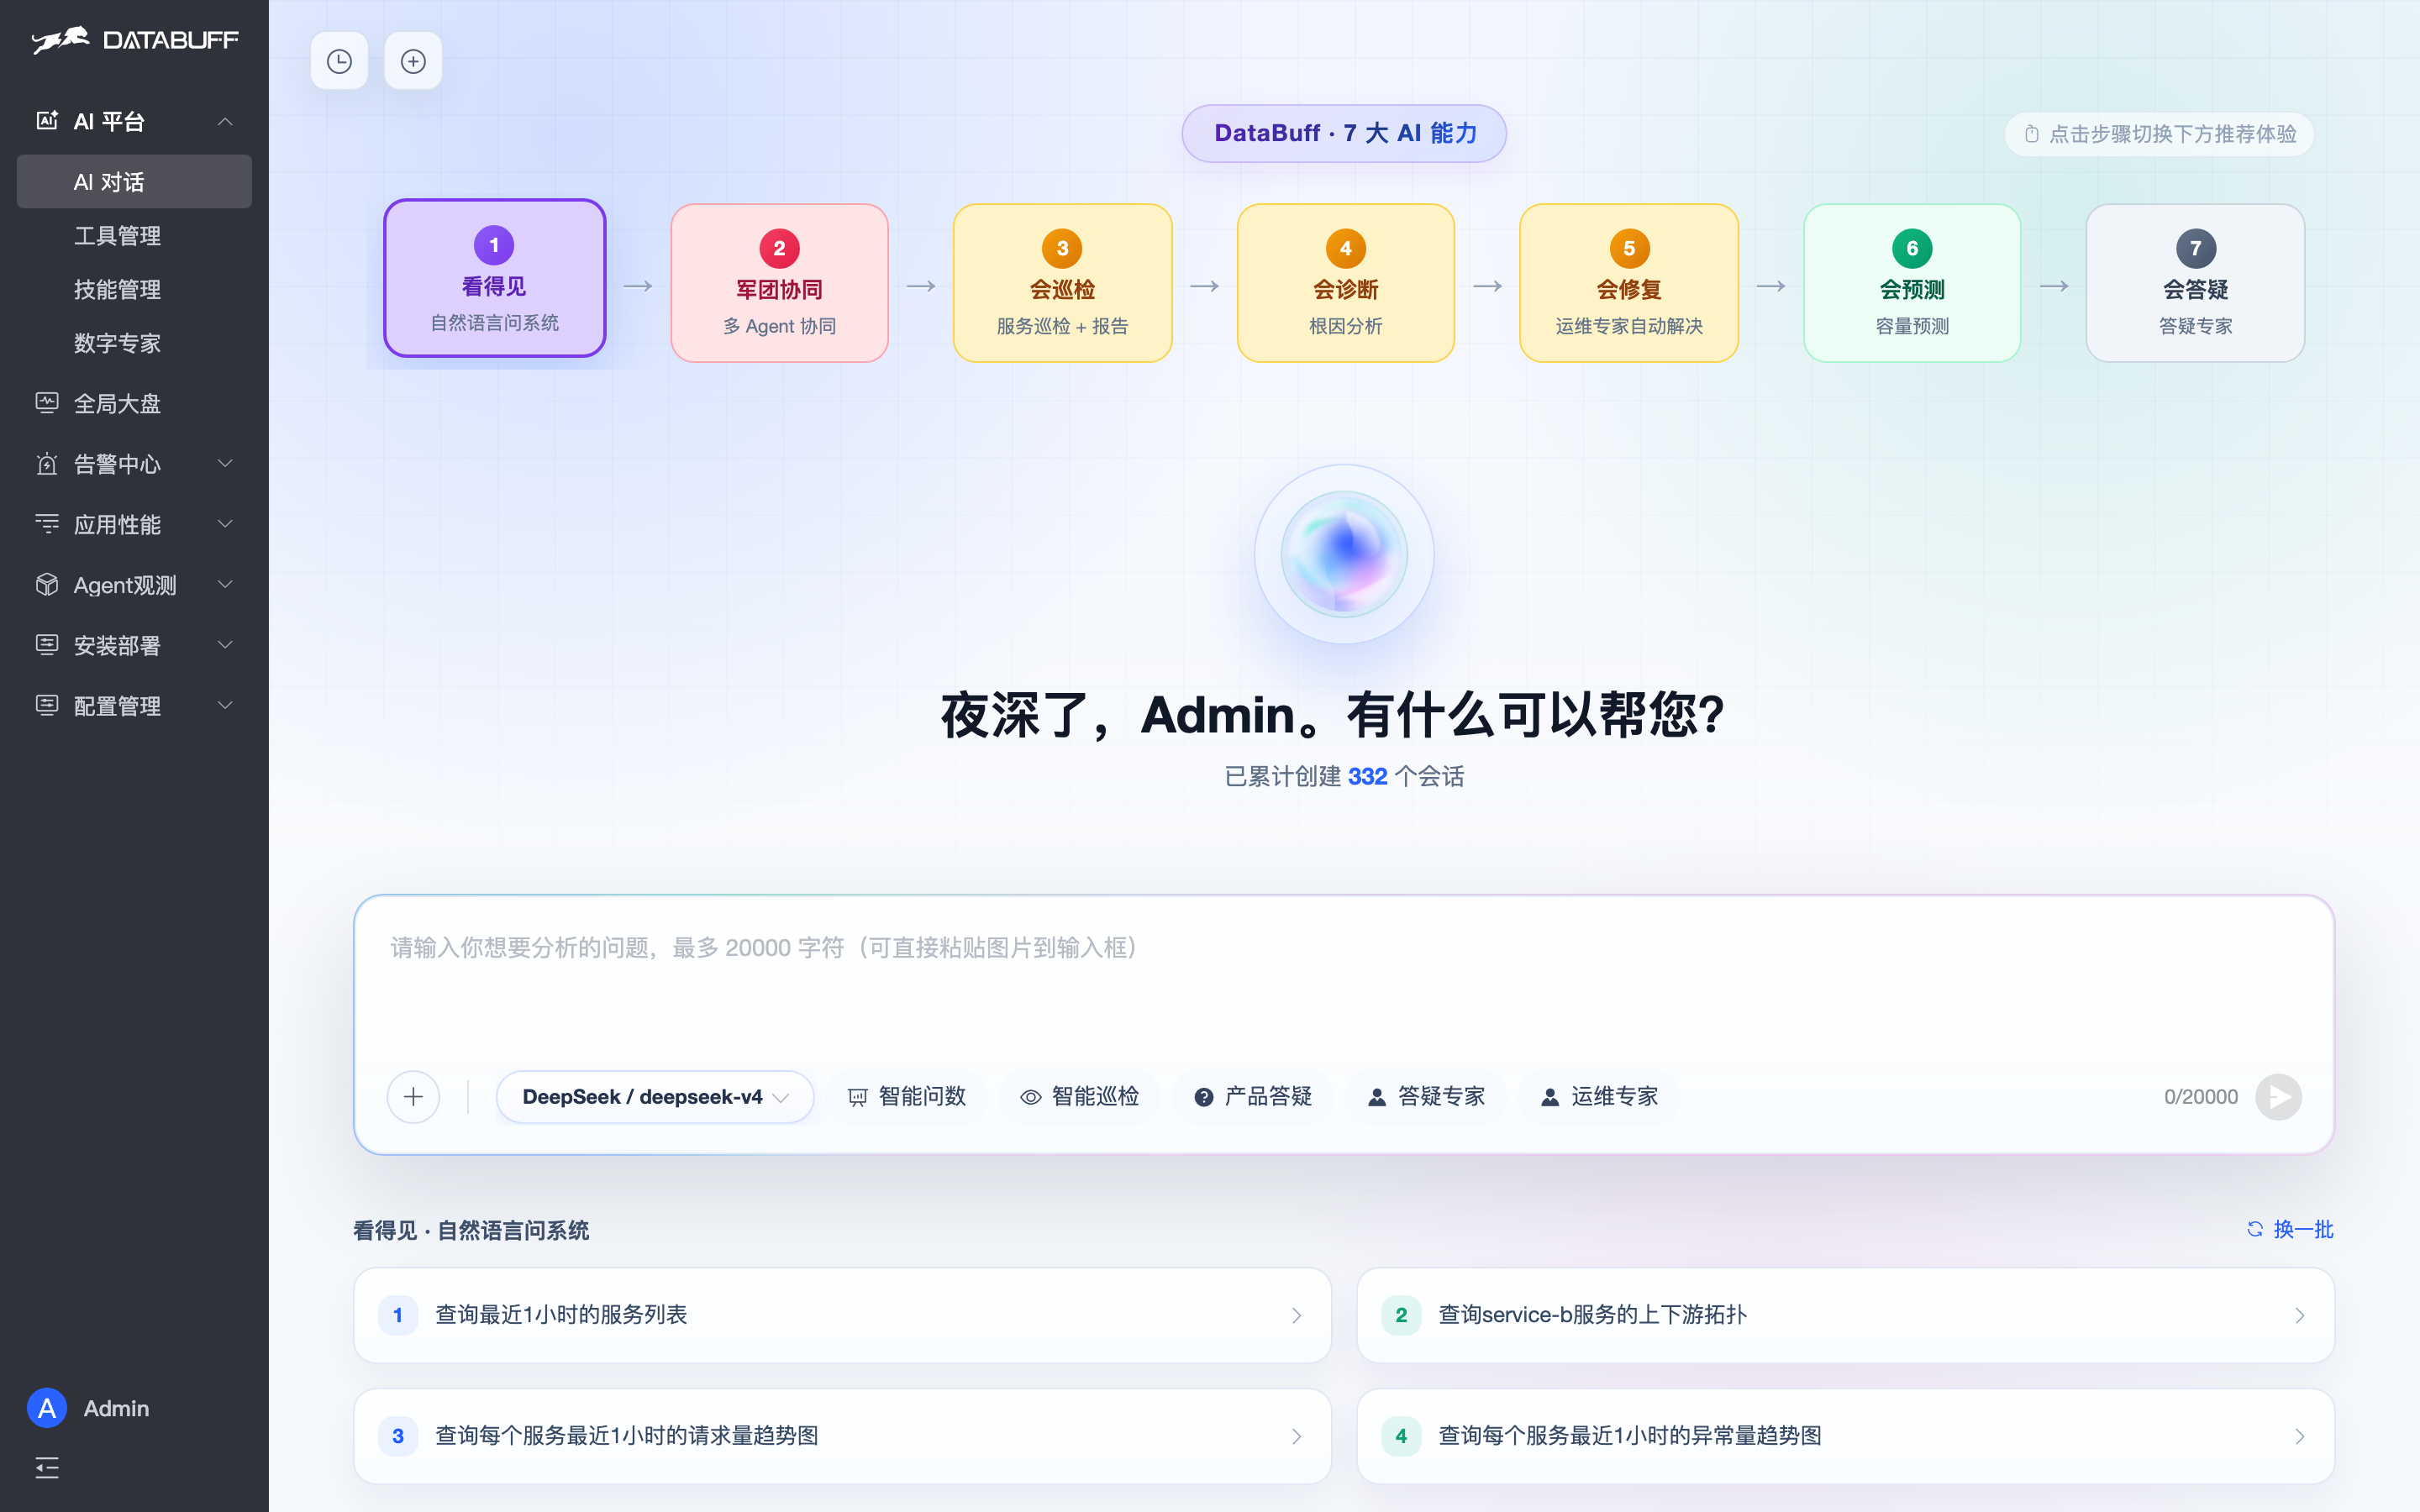
Seven AI capabilities (v0.1.7: See → Squad → Inspect → Diagnose → Repair → Predict → Answer)
| Capability | SkyWalking 10.4.0 | DataBuff v0.1.7 |
|---|---|---|
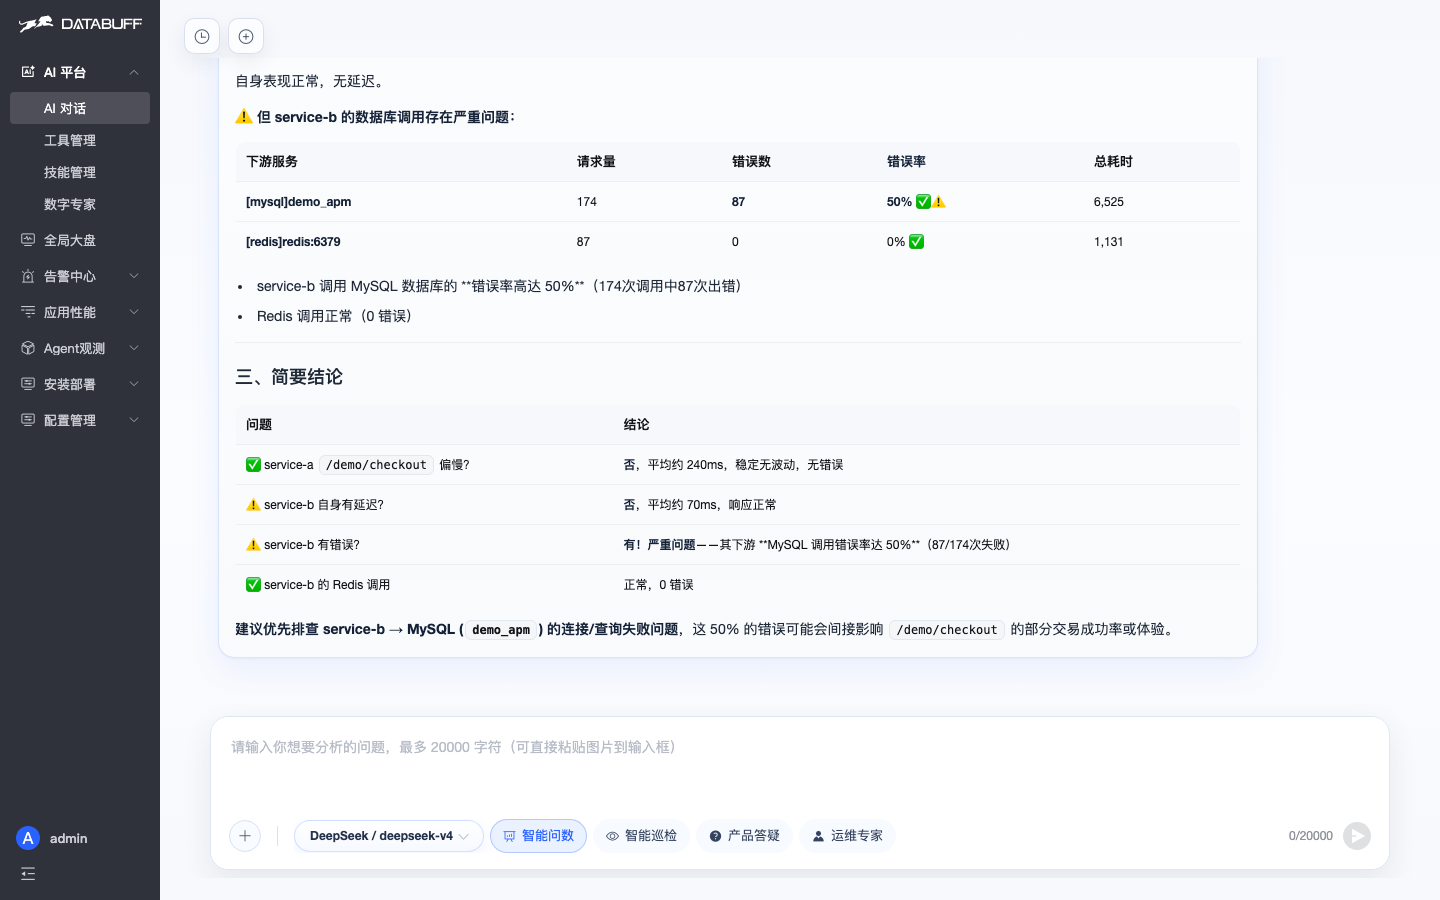
| ① See · natural-language questions | ❌ | ✅ Ask about services / topology / trends; AI reads telemetry |
| ② Squad · multi-agent collaboration | ❌ | ✅ Parallel evidence gathering; reusable task orchestration |
| ③ Inspect · service inspection + report | ❌ | ✅ One-shot inspection with evidence and actions |
| ④ Diagnose · bottleneck / RCA evidence | ❌ | ✅ Trace / metrics / topology evidence (not a black-box “root cause”) |
| ⑤ Repair · Ops Expert actions | ❌ | ✅ Repair under policy + human approval; dangerous-command denylist |
| ⑥ Predict · capacity / trends | ❌ | ✅ Capacity and trend analysis — from after-the-fact to ahead-of-time |
| ⑦ Answer · product Q&A | ❌ | ✅ Answers deploy / ingest / config from docs and code |
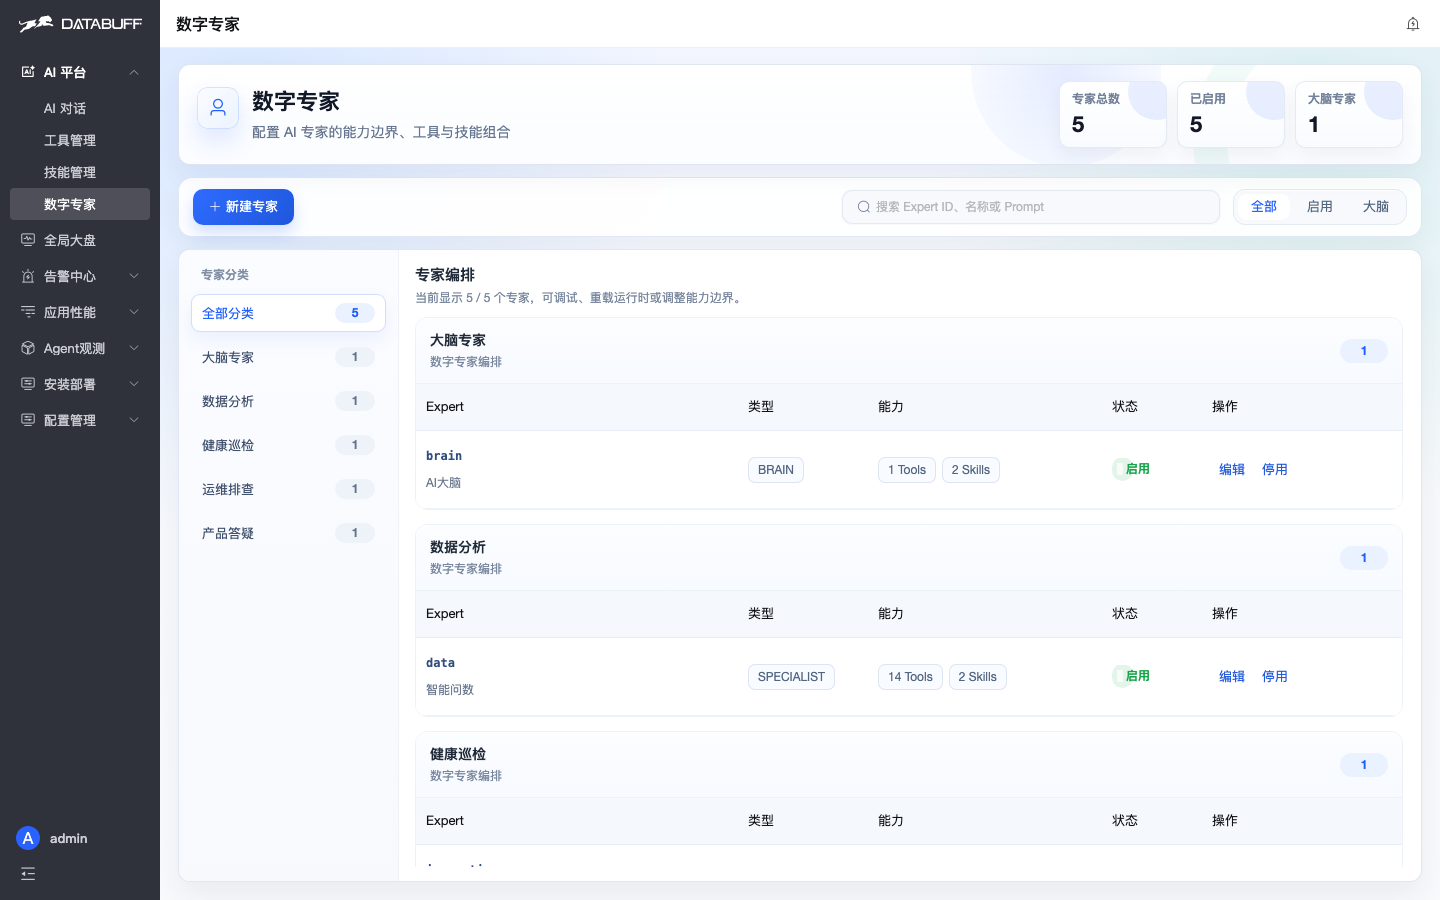
| Extend · MCP / Skill / custom experts | ❌ | ✅ External MCP / Skill and custom digital experts |
Largest gap: SkyWalking has no equivalent AI platform; DataBuff exposes the seven capabilities as configurable home entries with APM as AI context, plus external MCP / Skill and custom experts.
APM
| Capability | SkyWalking 10.4.0 | DataBuff v0.1.7 |
|---|---|---|
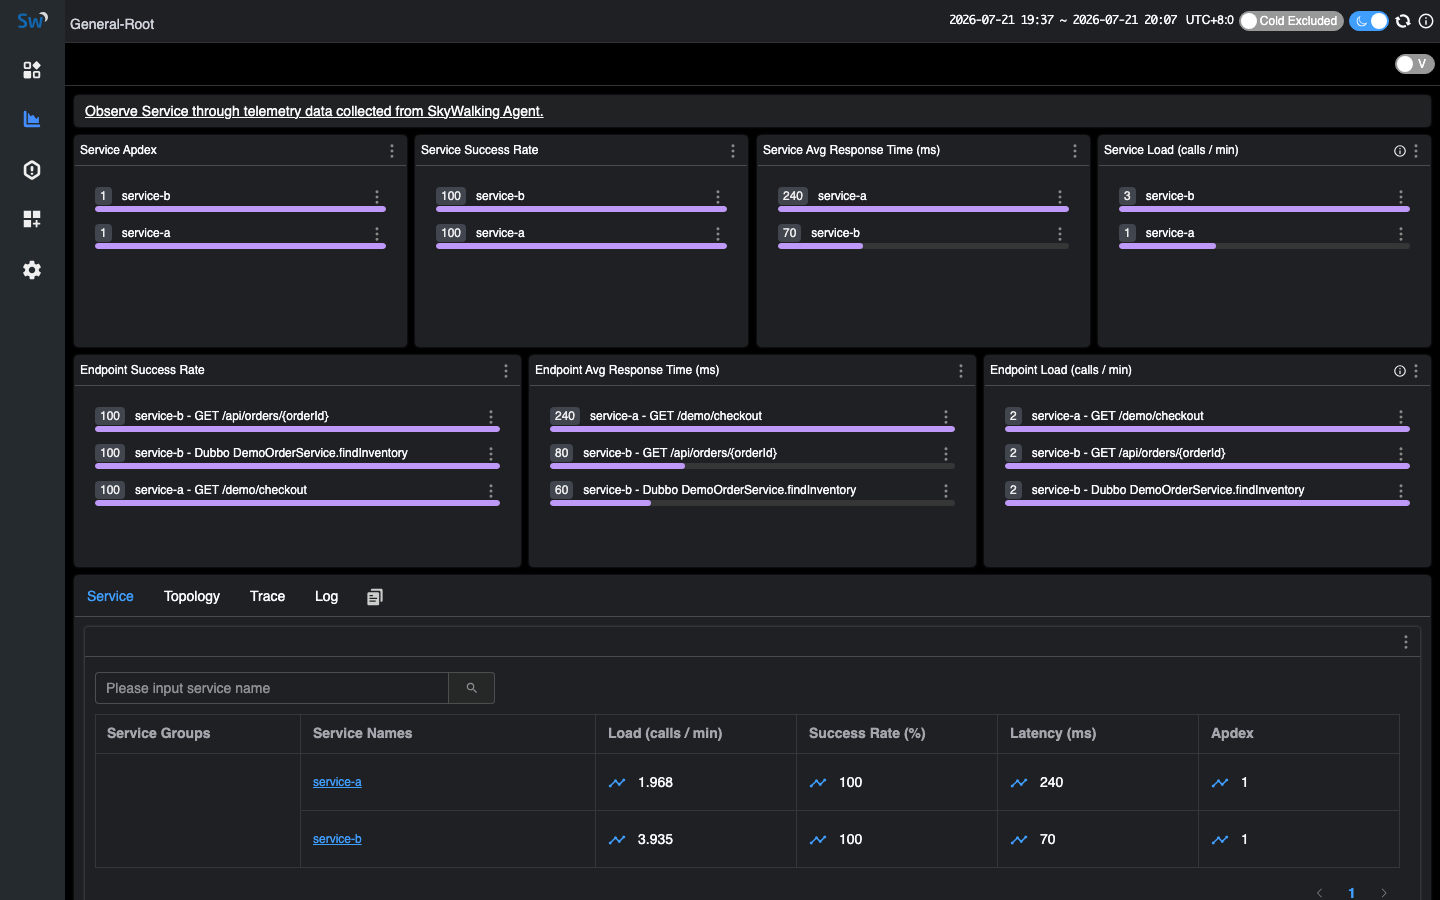
| 1. Global topology | ✅ Topology (incl. middleware nodes) | ✅ Topology + health colors + drill-down |
| 2. Service list & golden metrics | ✅ Apdex / success / latency / Load | ✅ Service list + charts; same demo shows service-a / b |
| 3. Service-level topology | ✅ | ✅ |
| 4. Service call analysis (up/downstream + Trace) | ❌ | ✅ Upstream/downstream structure, latency/contribution; drill to Trace |
| 5. Instance golden metrics | ✅ Instance metrics | ✅ Instance golden-metric charts / list |
| 6. Instance topology | ❌ | ✅ Dedicated instance topology |
| 7. Instance call analysis (up/downstream + Trace) | ❌ | ✅ Per-instance up/downstream + Trace |
| 8. Endpoint topology | ❌ | ✅ Dedicated endpoint topology |
| 9. Endpoint call analysis (up/downstream + Trace) | ❌ | ✅ Per-endpoint caller/callee + Trace |
| 10. Service flow (service / endpoint Trace contribution) | ❌ Topology answers “who connects”, no service flow | ✅ Response contribution from entry; service / endpoint Trace view |
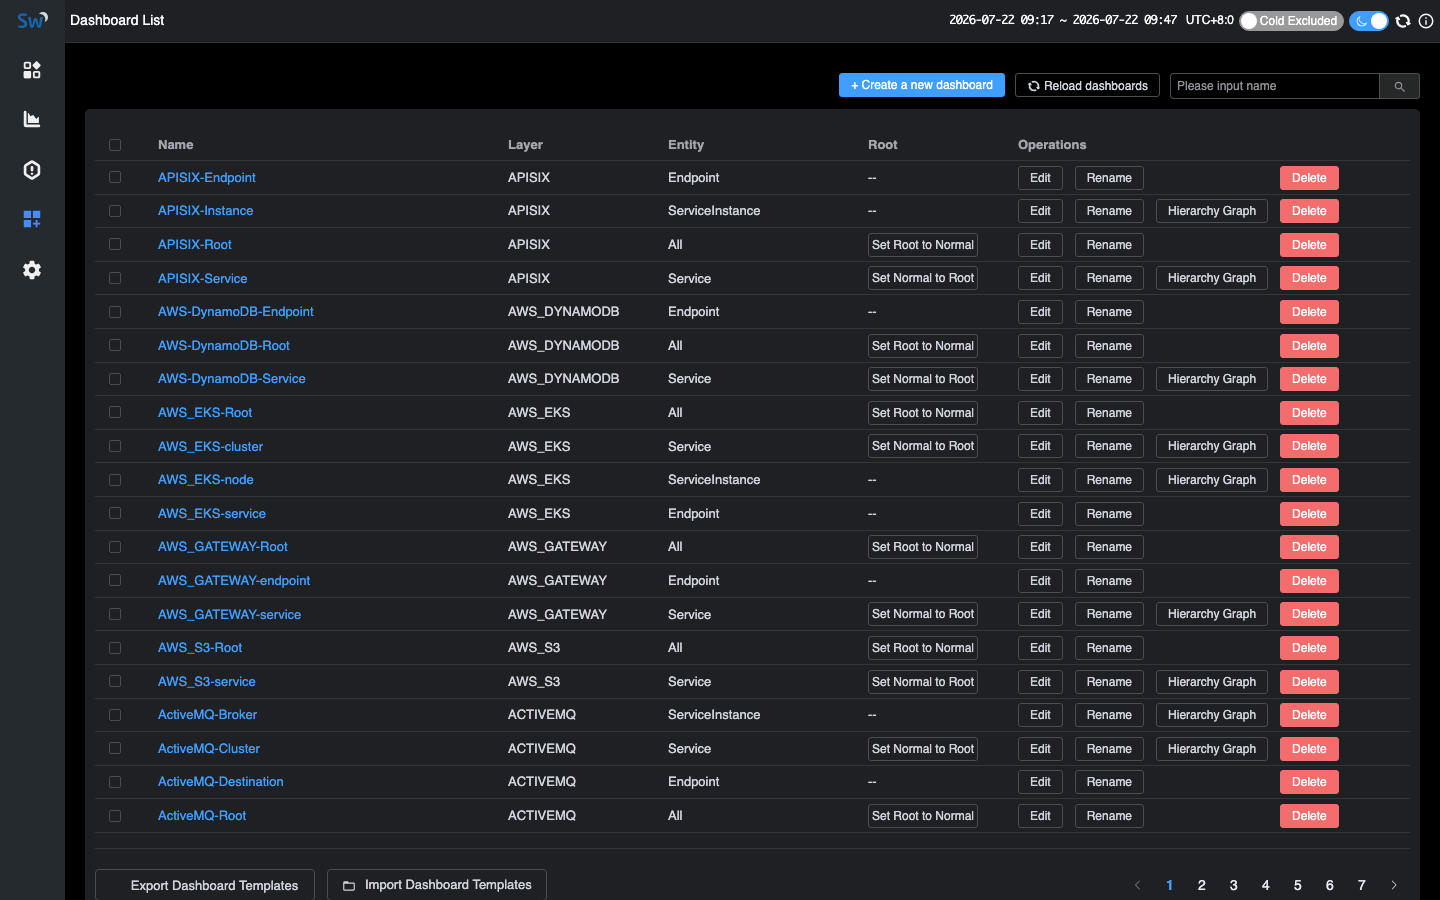
| 11. Middleware / external pages (DB / cache / MQ / external) | ✅ Dashboard middleware boards (DB / cache / MQ, …) | ✅ Dedicated APM pages + linked call analysis / Trace |
| 12. Error analysis (stats + endpoint) | ❌ | ✅ Error stats + endpoint drill-down |
| 13. Trace list / search | ✅ Service / endpoint / status / latency filters | ✅ Charts + list, multi-dimension filters |
| 14. Trace detail | ✅ Span timeline / Tags | ✅ Call-order waterfall + Span attributes |
| 15. Trace Span → logs | ✅ Trace / Span can link to logs | ✅ Top “Log analysis” + Span Logs / Logs tab |
| 16. Log list / search | ✅ | ✅ |
| 17. Log detail | ✅ | ✅ |
| 18. Log → Trace | ✅ Log → Trace | ✅ Log → Trace, down to Span |
| 19. Profiling (Tracing / AsyncProfiler / eBPF) | ✅ All three | ❌ Not yet |
| 20. Custom dashboards | ✅ Built-in; service + middleware boards | ❌ Not yet |
Basics (incl. Span↔logs) exist on both sides; SW also has middleware Dashboard boards (rows 11 / 20). DataBuff leads on service / instance / endpoint call analysis (with Trace), instance / endpoint topology, service flow, APM pages linked to call analysis / Trace, error depth, and Log→Trace down to Span. Profiling and dashboard customization depth are SkyWalking strengths DataBuff does not cover yet.
Alerting
| Capability | SkyWalking 10.4.0 | DataBuff v0.1.7 |
|---|---|---|
| How rules are configured | △ OAP alarm-settings.yml (or dynamic config); not built in UI | ✅ Alert center in product |
| Threshold alerts | △ Supported via YAML / MQE | ✅ Managed in platform |
| Smart alerts | ❌ No equivalent product capability | ✅ Smart-alert entry linked with APM metrics |
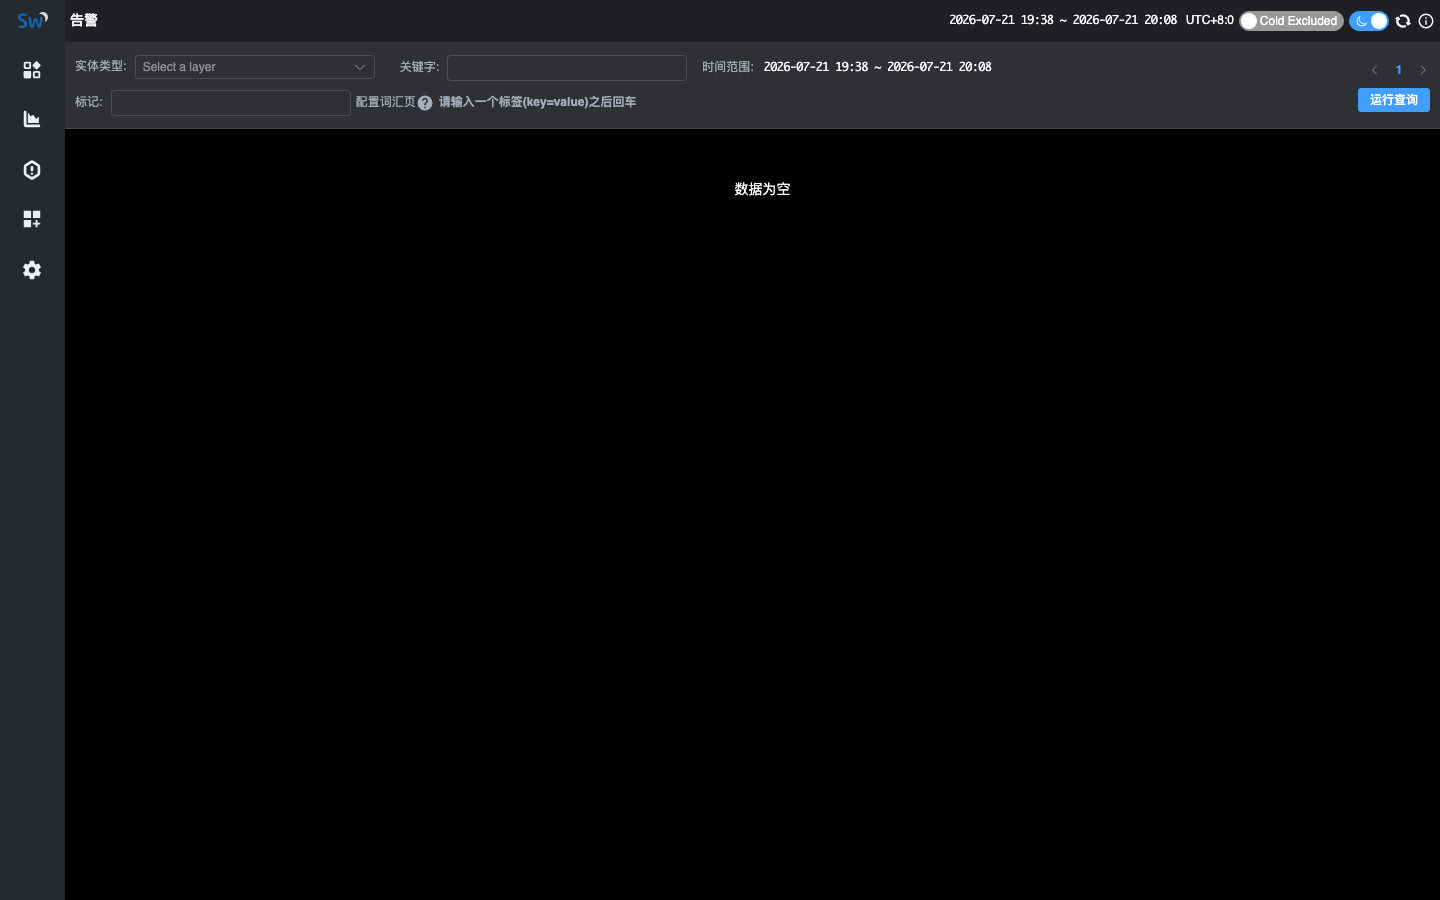
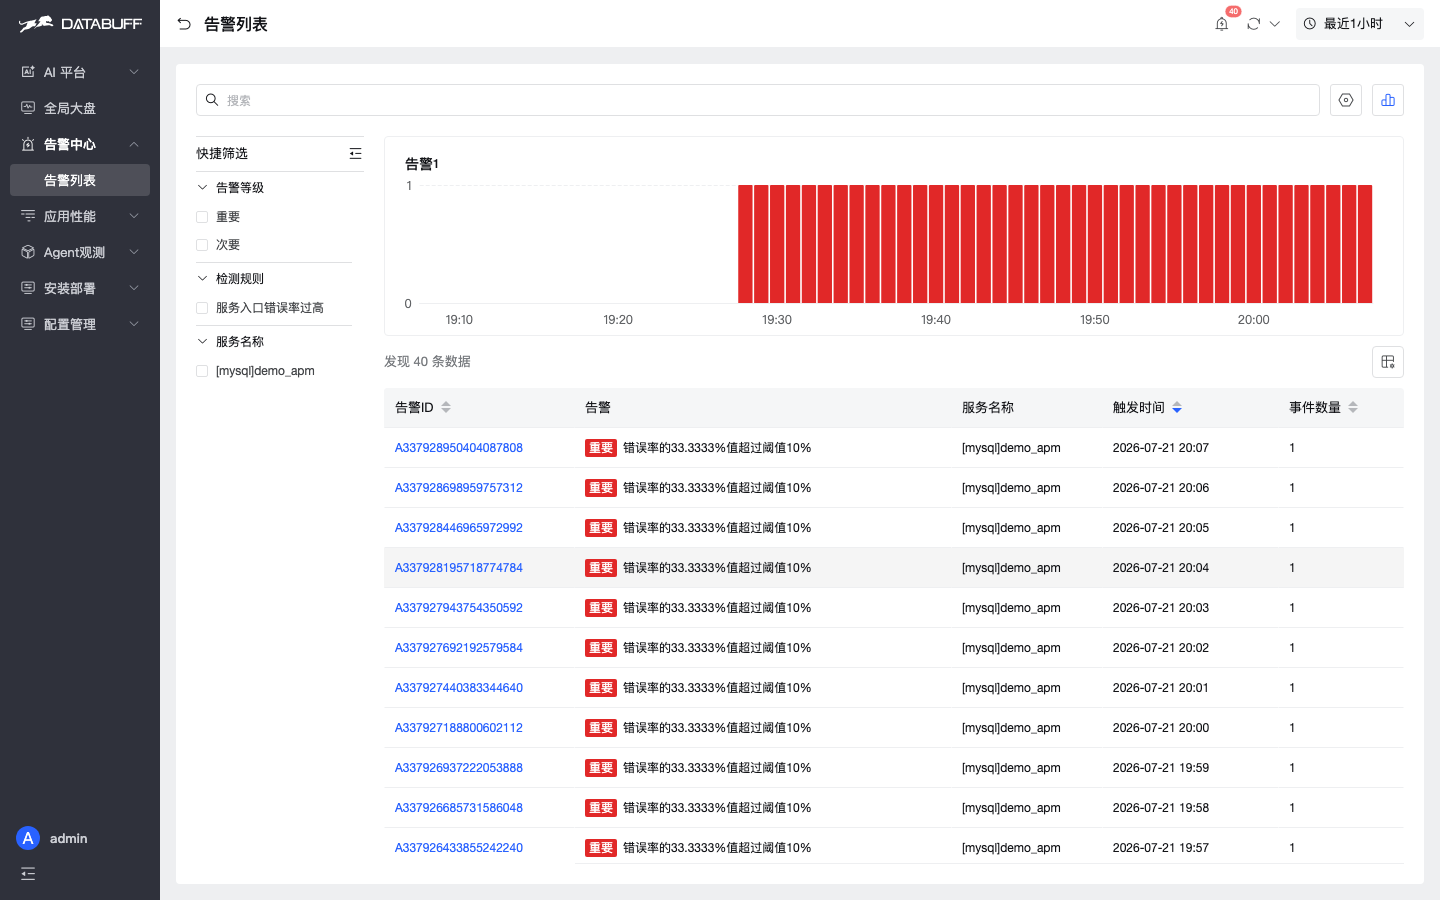
| Alert event list | △ UI exists; empty in this lab | ✅ Non-empty in this lab |
| Alerts linked to service / middleware | △ Mostly hooks; stitch APM yourself | ✅ List links back into APM |
Gaps are at both ends: how to configure (backend file vs alert center) and what you can do after (events / hooks vs list + smart alerts + service context).
When to pick which
| Scenario | Better fit | Note |
|---|---|---|
| Keep SW Agents, want AI / dedicated pages first | DataBuff (side-by-side) | Point ingest at DataBuff |
| Need the seven AI capabilities | DataBuff | No SW AI platform |
| MCP / Skill / custom experts | DataBuff | SW has no such layer |
| See who slows the entry response | DataBuff | Service flow + contribution |
| Call analysis → Trace (service / instance / endpoint) | DataBuff | No SW path |
| Slow SQL / cache / MQ with call analysis / Trace linkage | DataBuff | SW has Dashboard boards; lacks APM pages + call-analysis linkage |
| Tracing / AsyncProfiler / eBPF Profiling | SkyWalking | DataBuff not yet |
| Custom dashboards / middleware boards | SkyWalking | DataBuff not yet |
| Lightweight Trace only, no AI | Either | No need to migrate for brand |
Boundary: Deep SW plugin lock-in or hard need for Profiling / custom dashboards → stay on SkyWalking. DataBuff fits keep-Agent + AI + APM depth, side-by-side or gradual switch; Profiling and dashboards are not yet peer capabilities.
2. Screenshot evidence (explains the tables)Screenshots from 192.168.50.140 (AI home matches the v0.1.7 product entry). Captions map to capability rows. Focus on DataBuff extras: seven AI capabilities / dedicated pages / alerting. Profiling is a SkyWalking strength (no filler screenshot here); custom dashboards shown via SkyWalking below — DataBuff has no equivalent yet.
Seven AI capabilities (SkyWalking has no equivalent UI; DataBuff evidence)
Services & topology
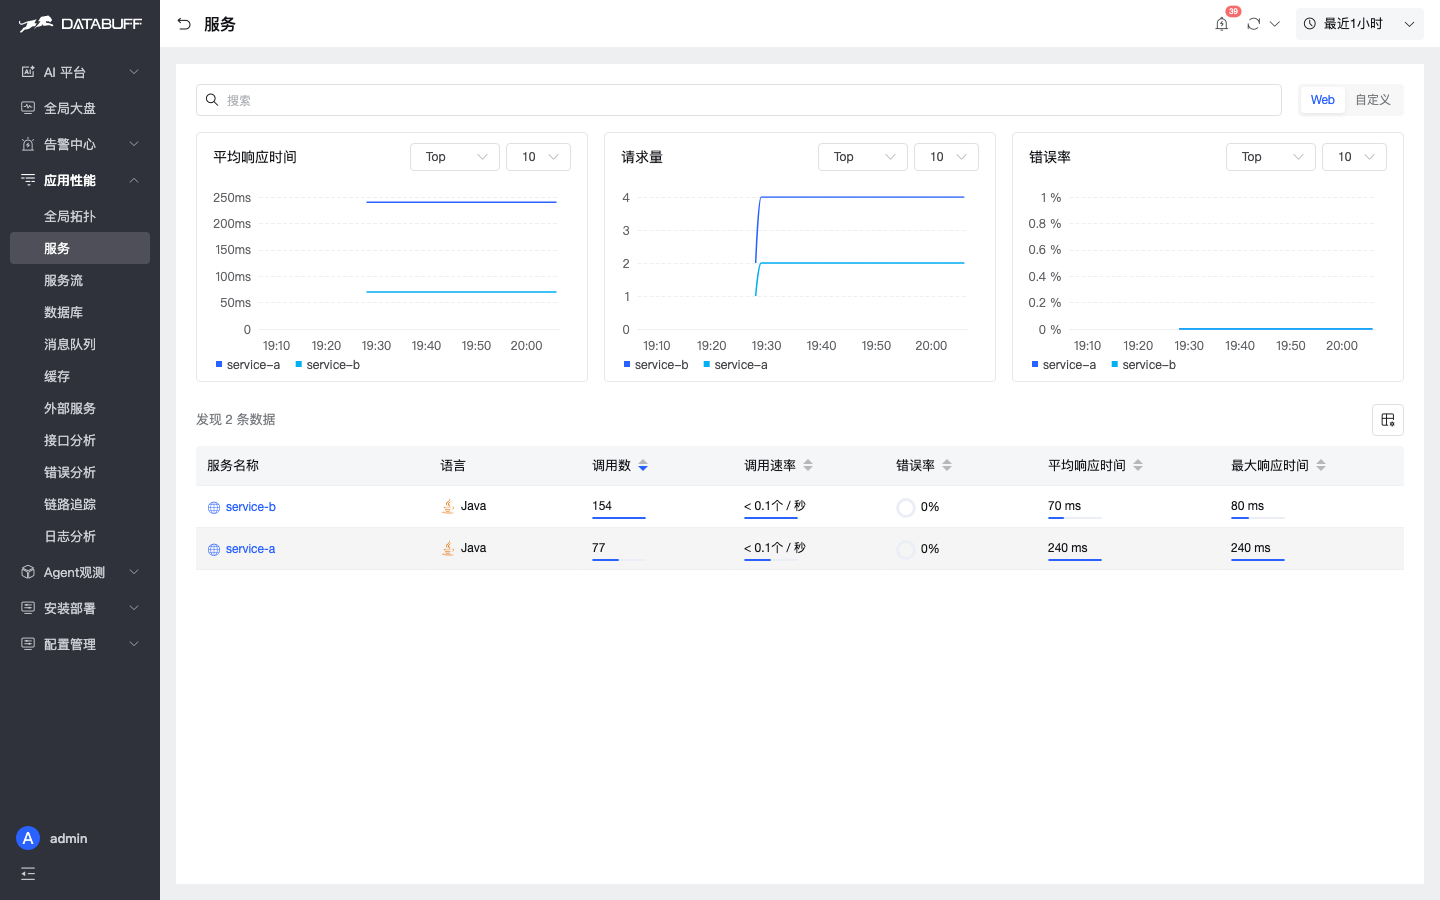
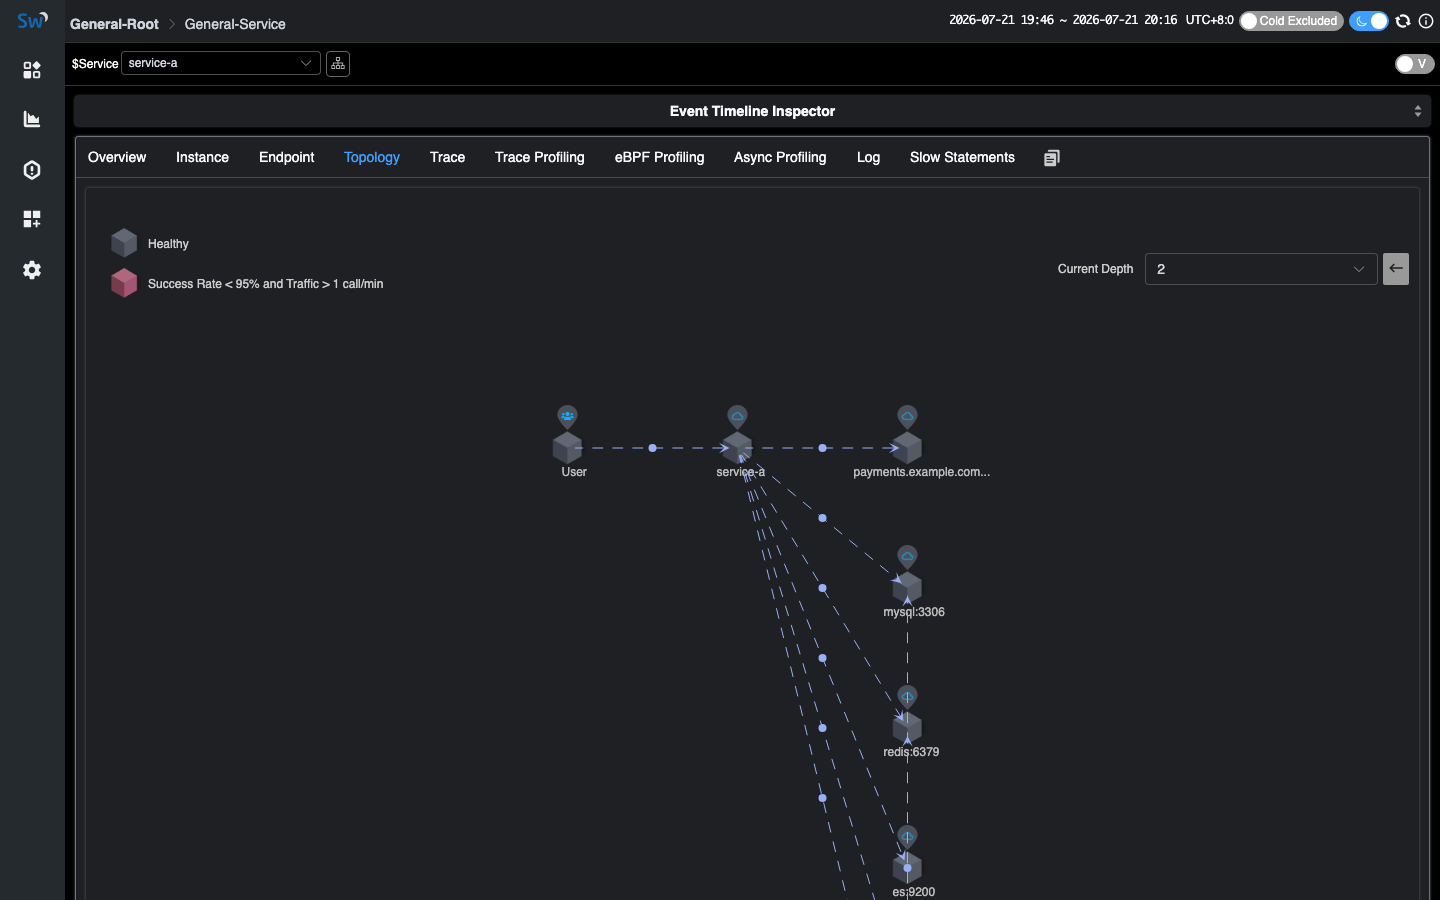
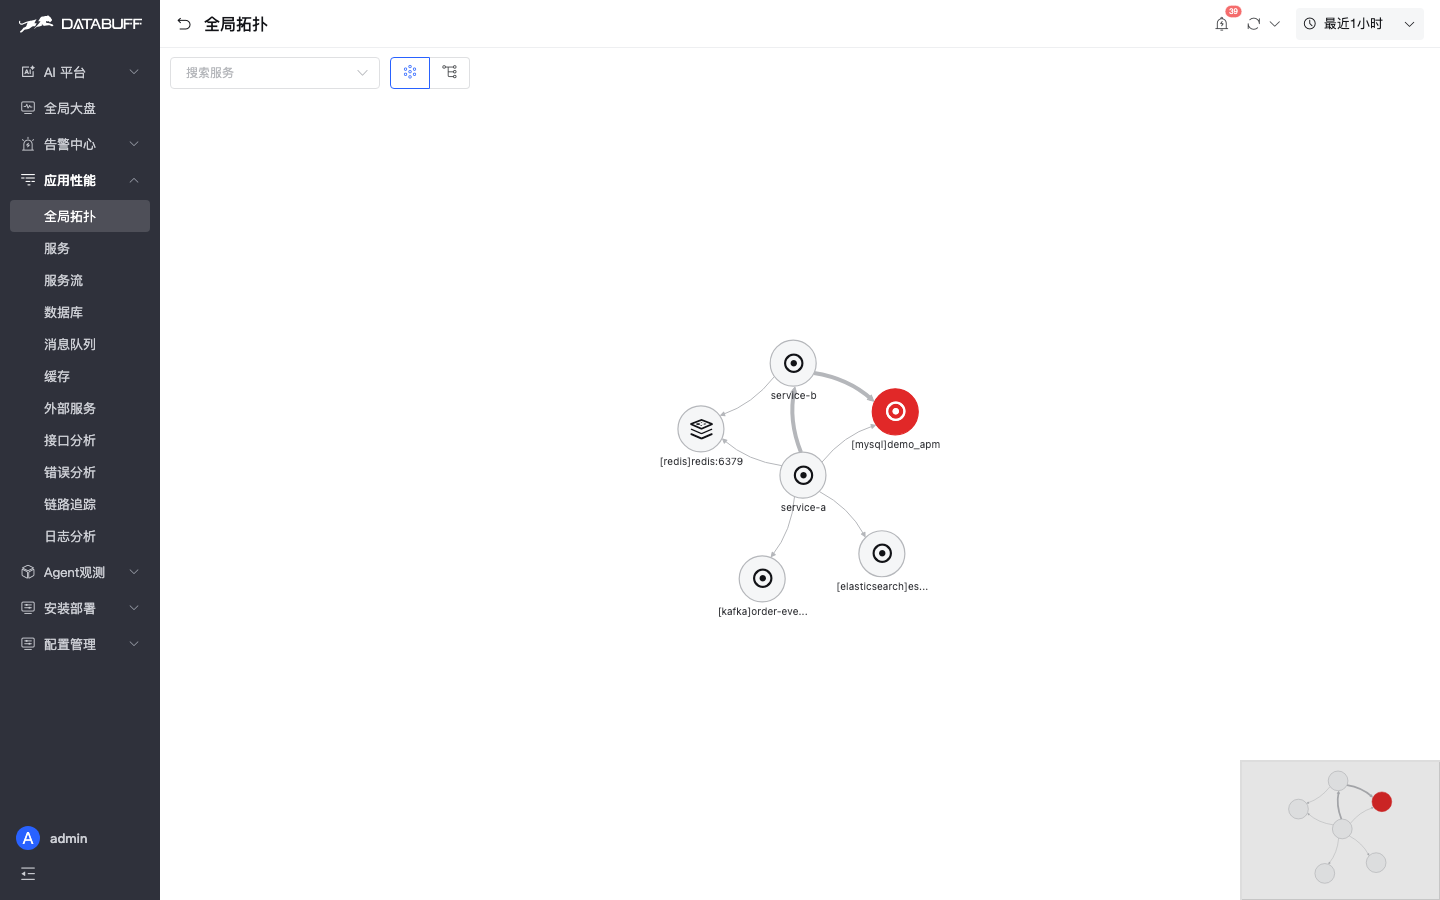
Service / instance / endpoint call analysis + service flow (rows 4 / 7 / 9 / 10)
SkyWalking has global/service topology and instance metrics, but no service / instance / endpoint call analysis (with up/downstream metrics and Trace), and no instance/endpoint topology or service-flow Trace contribution view. DataBuff can drill to Trace on rows 4, 7, 9; service flow (10) expands from entry service-a with downstream response contribution (e.g. service-b ~58%) — from “who connects” to “who slows it, then open Trace”.
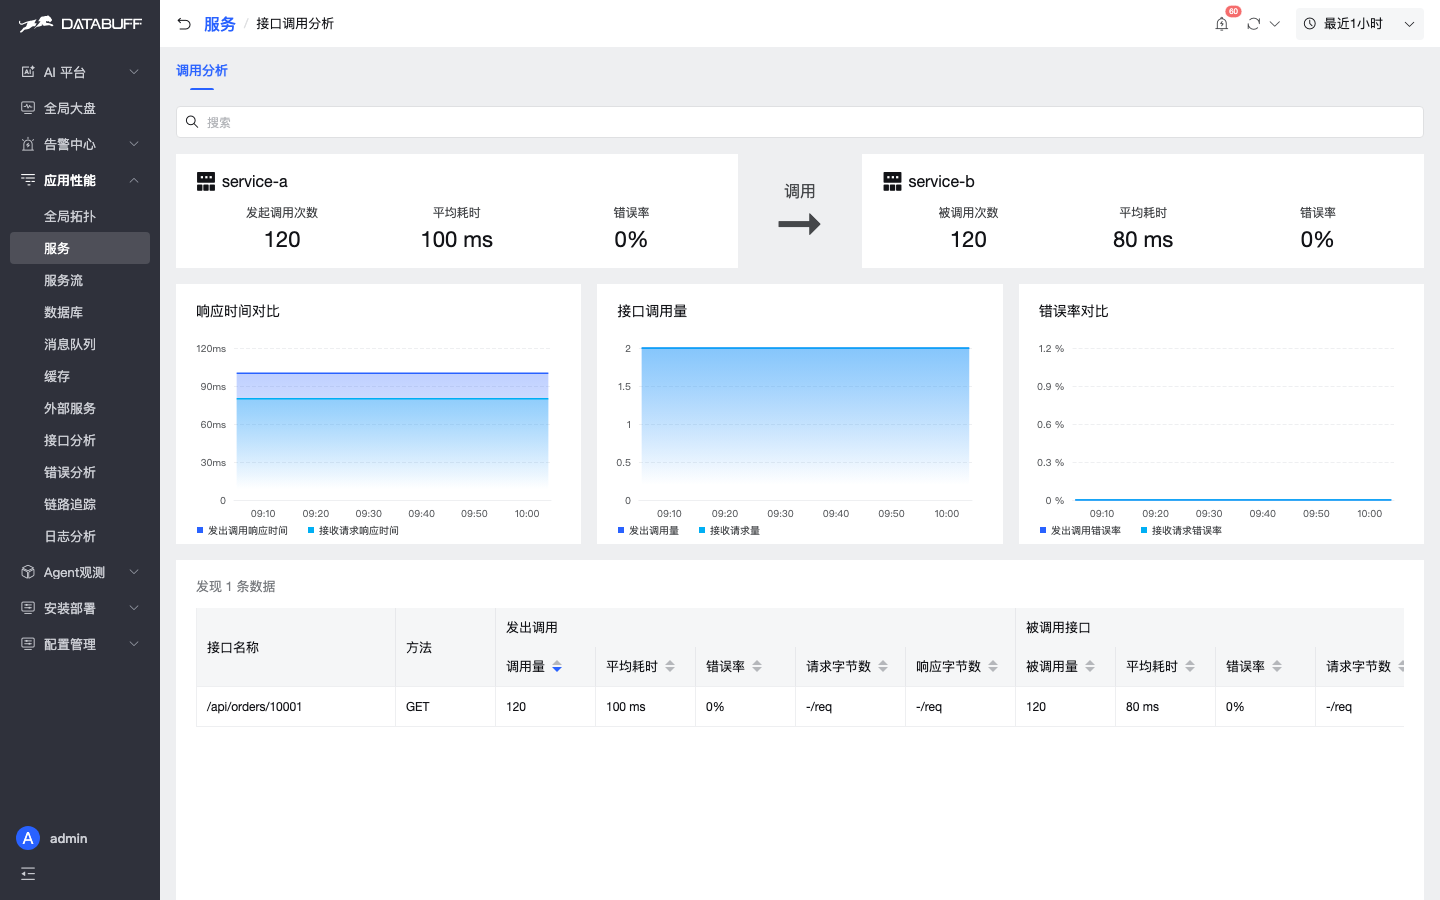
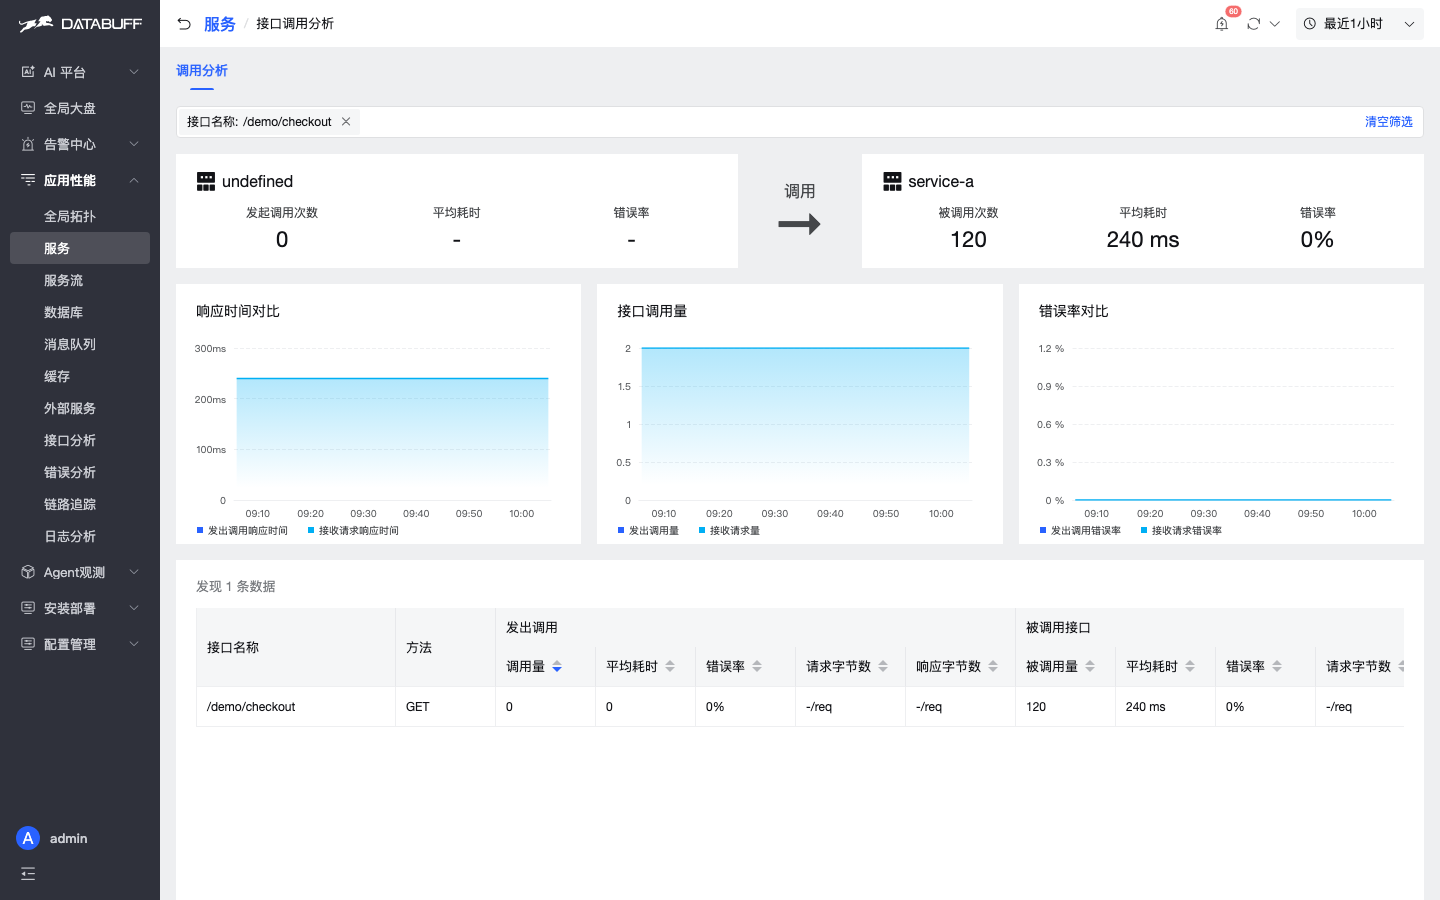
/demo/checkout — volume / latency / errors (no SW page)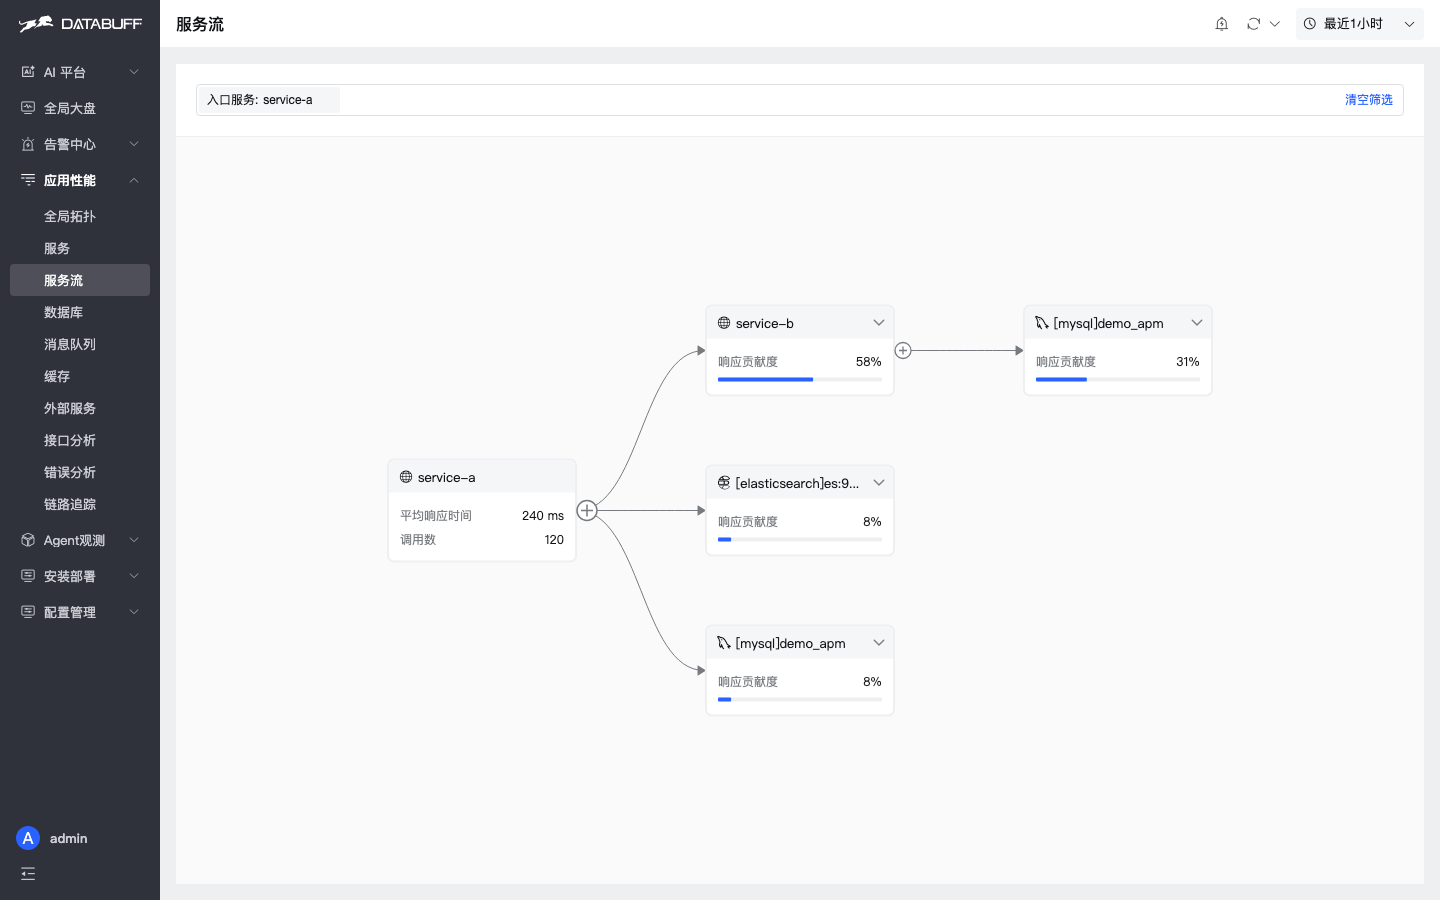
Trace
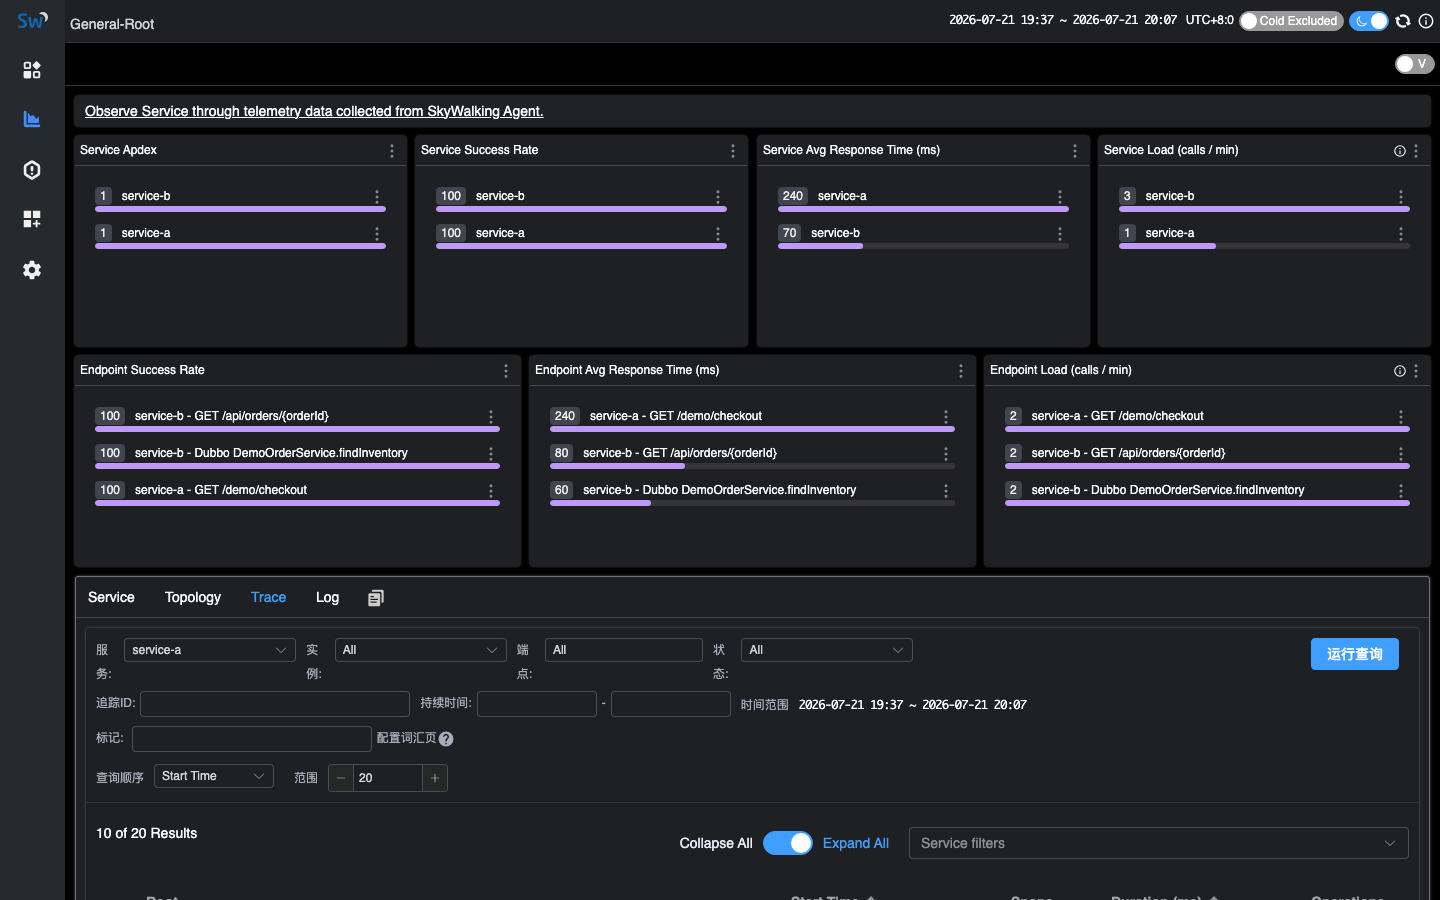
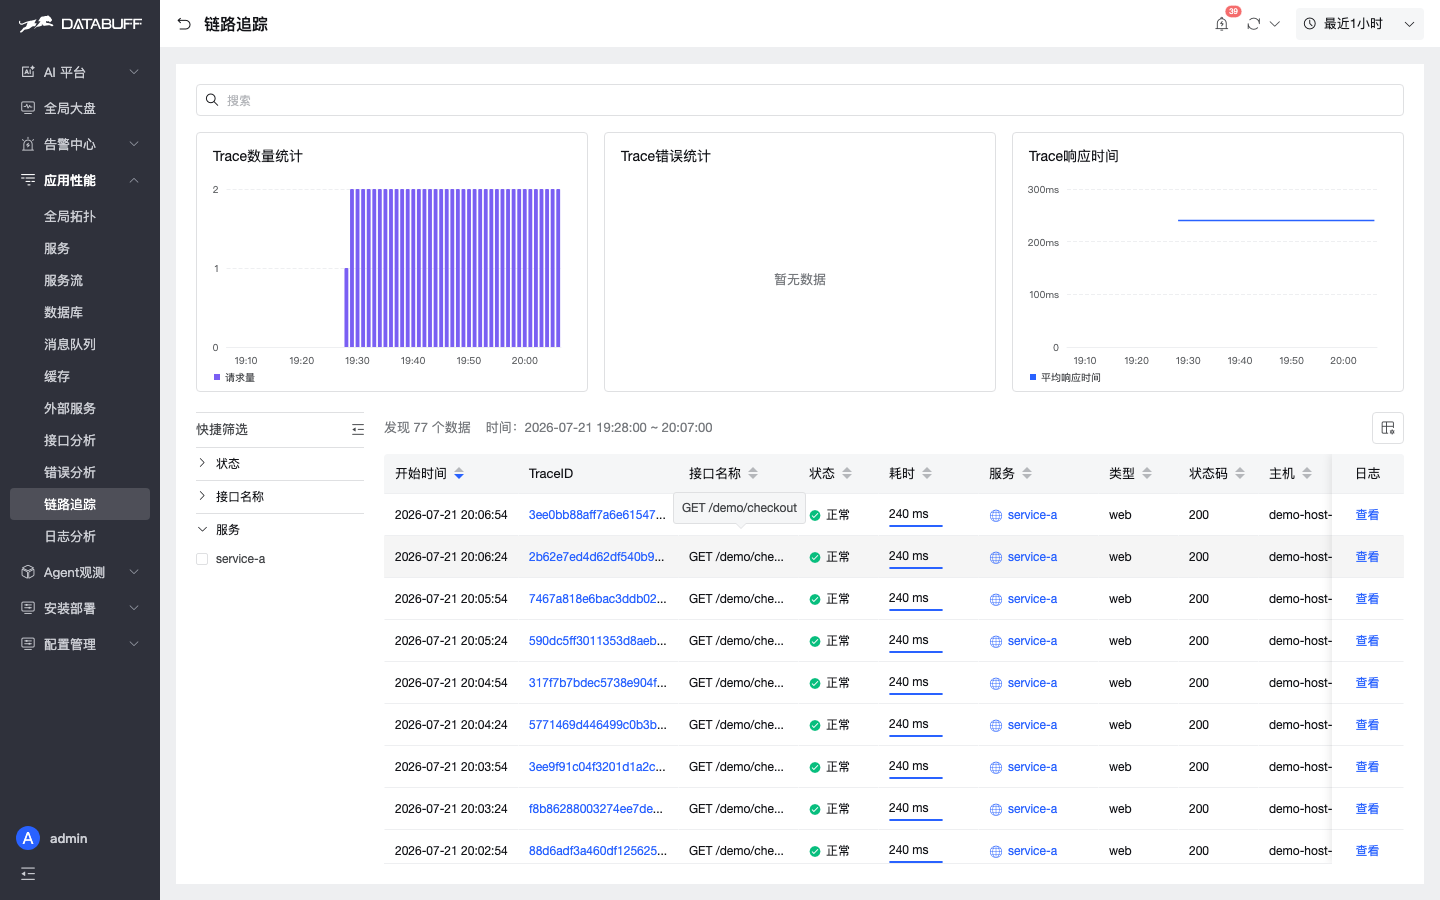
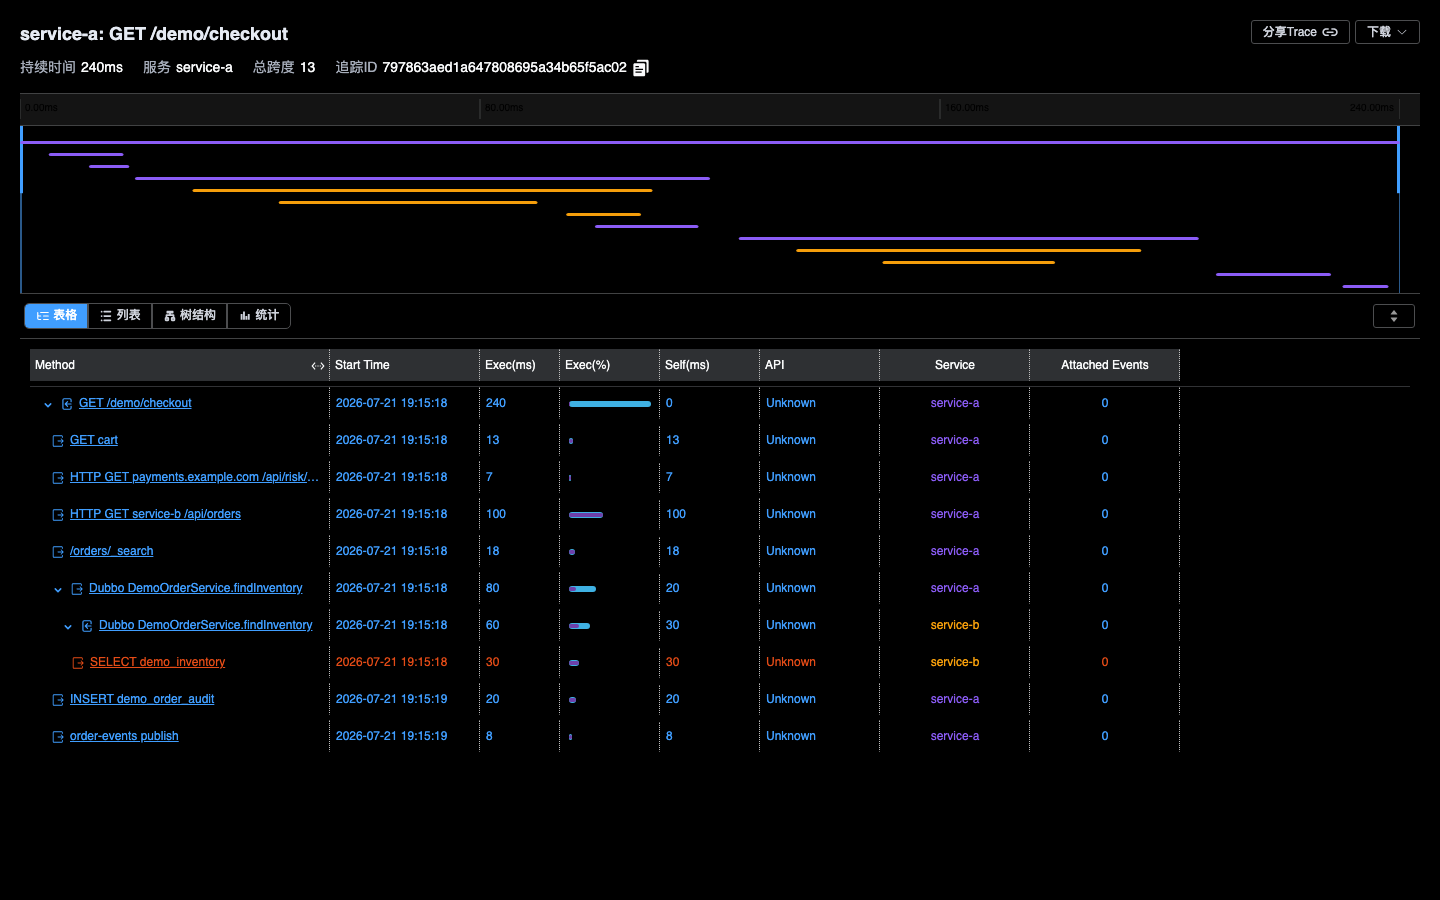
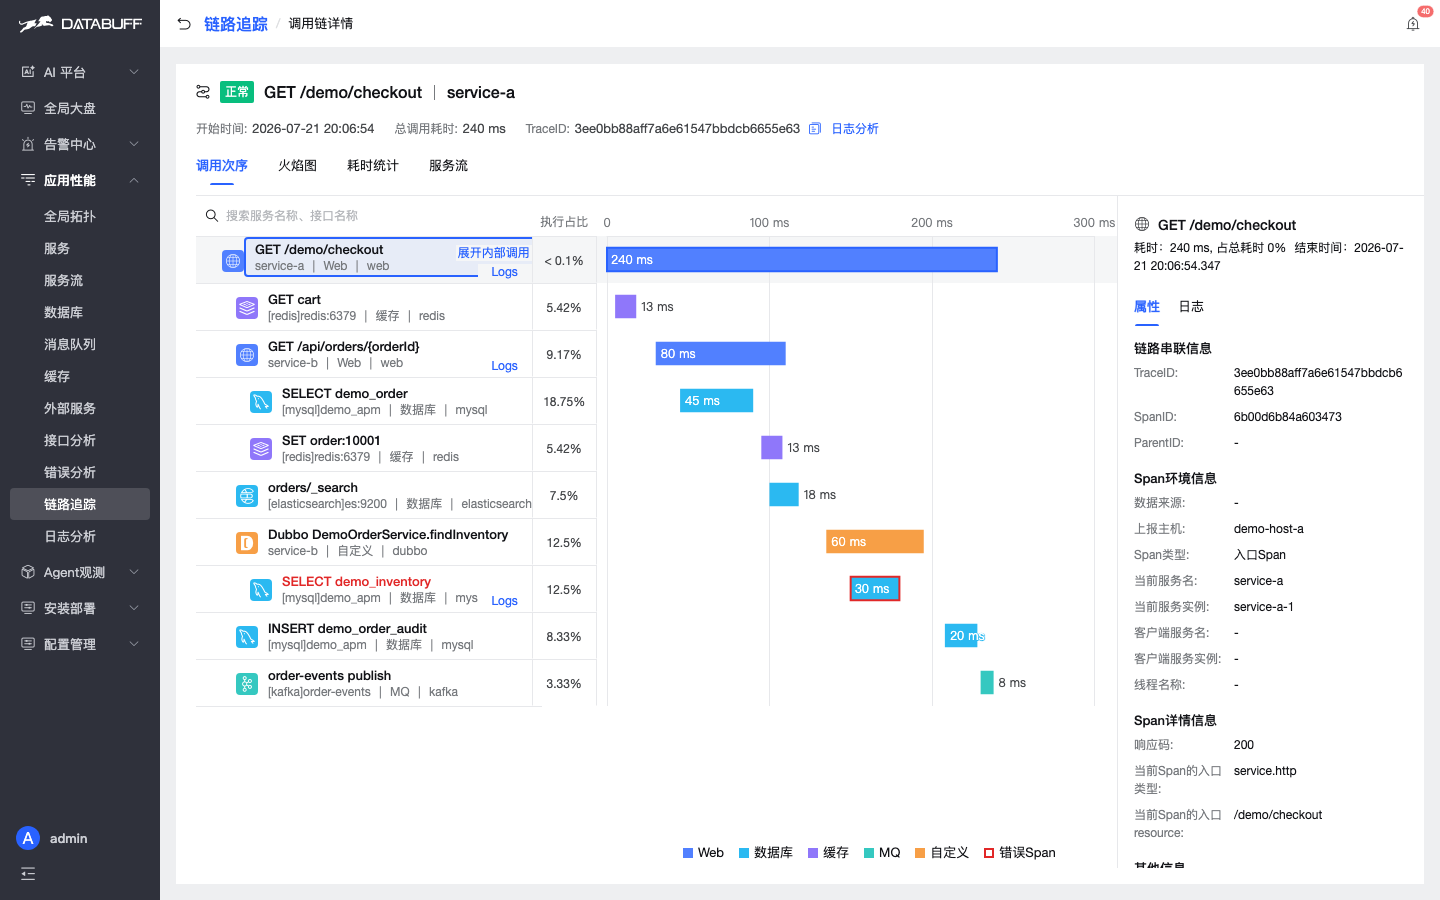
Log / Metric (linkage granularity)
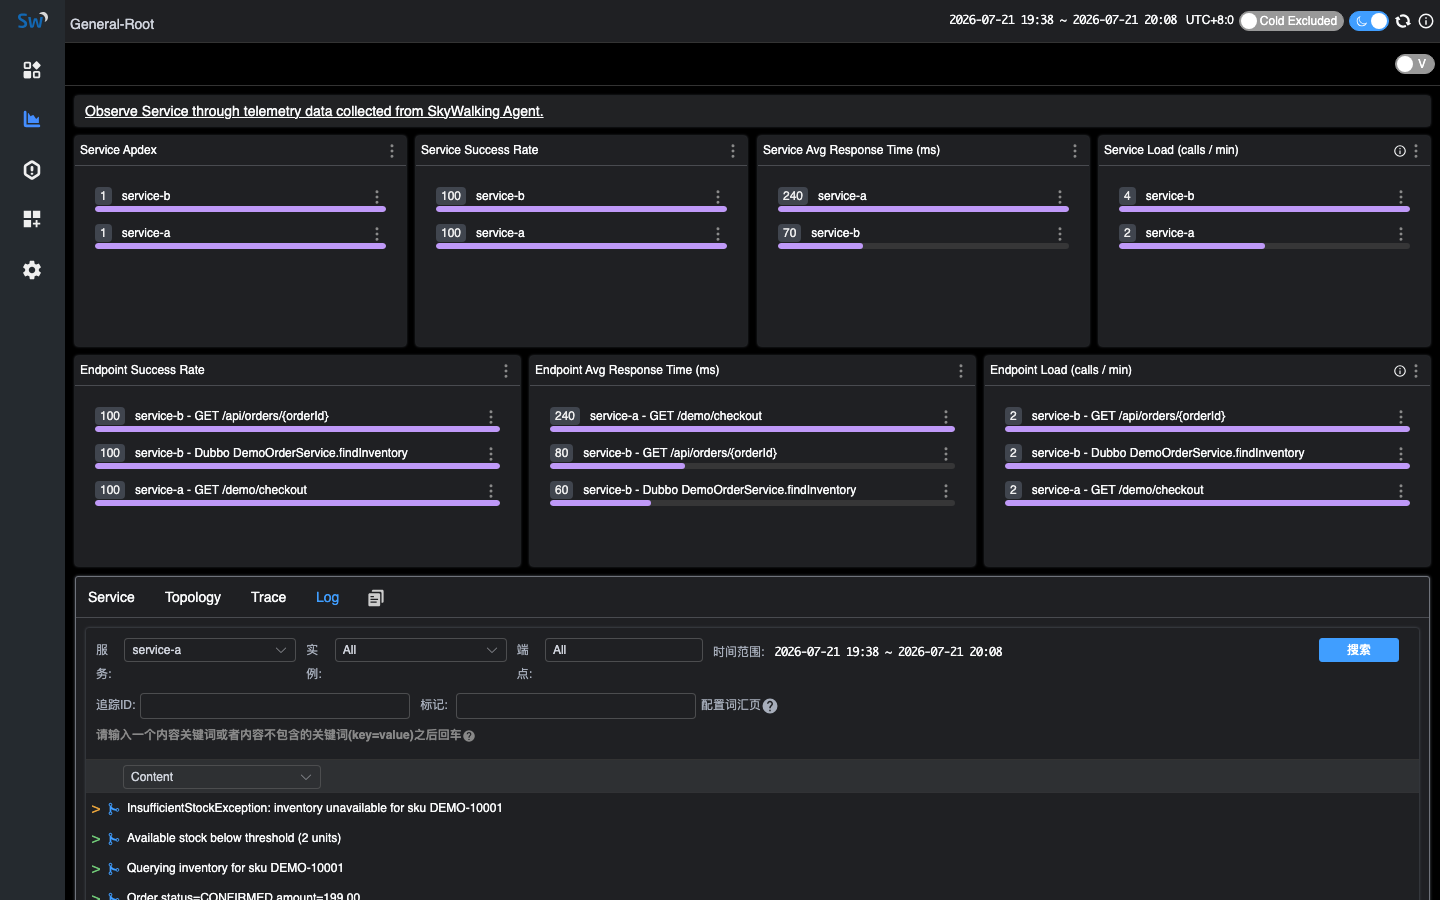
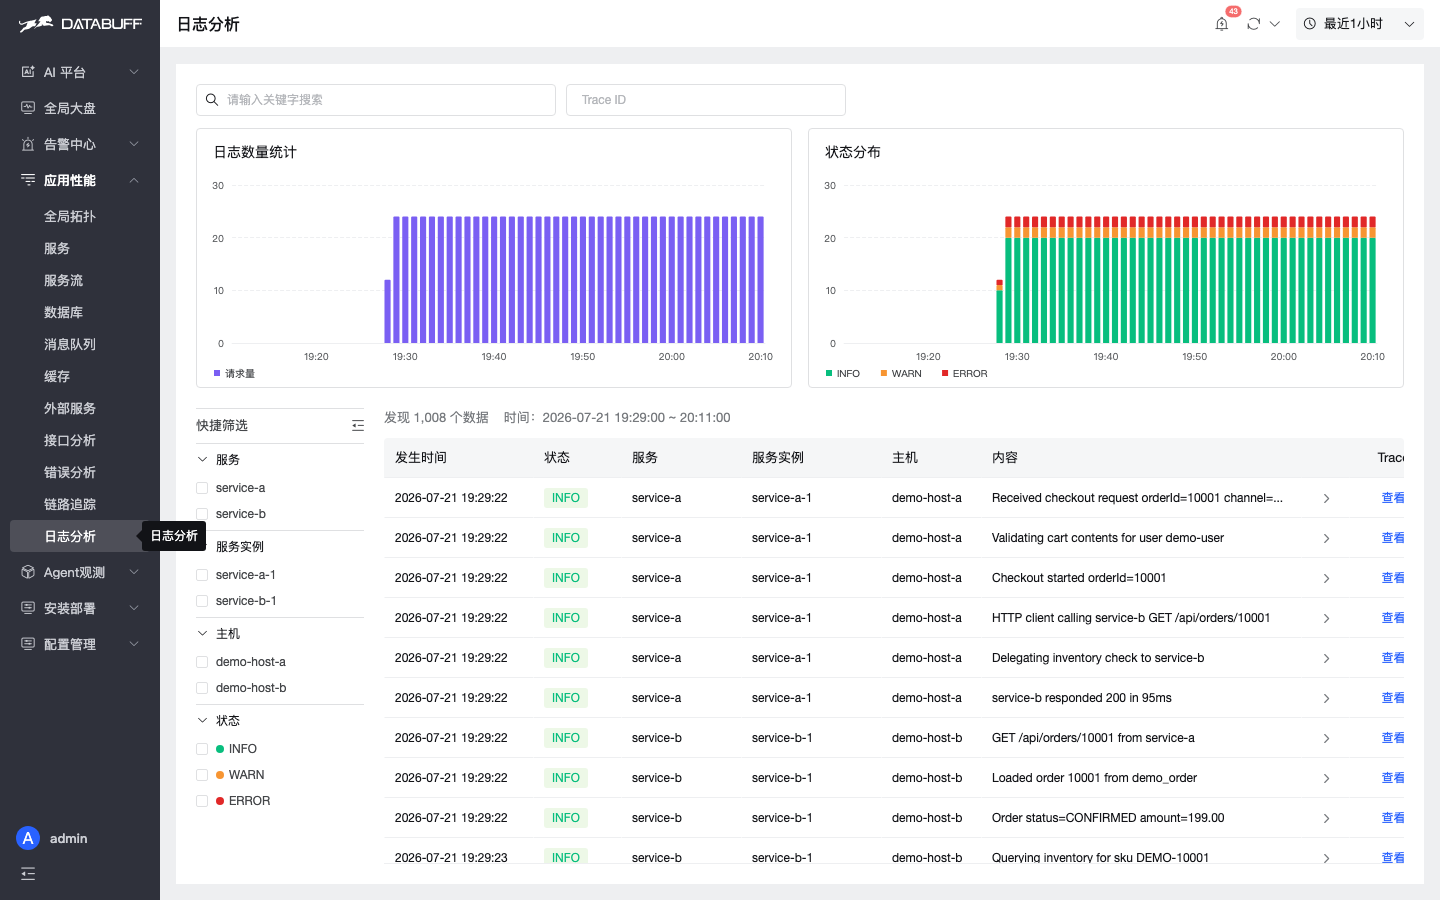
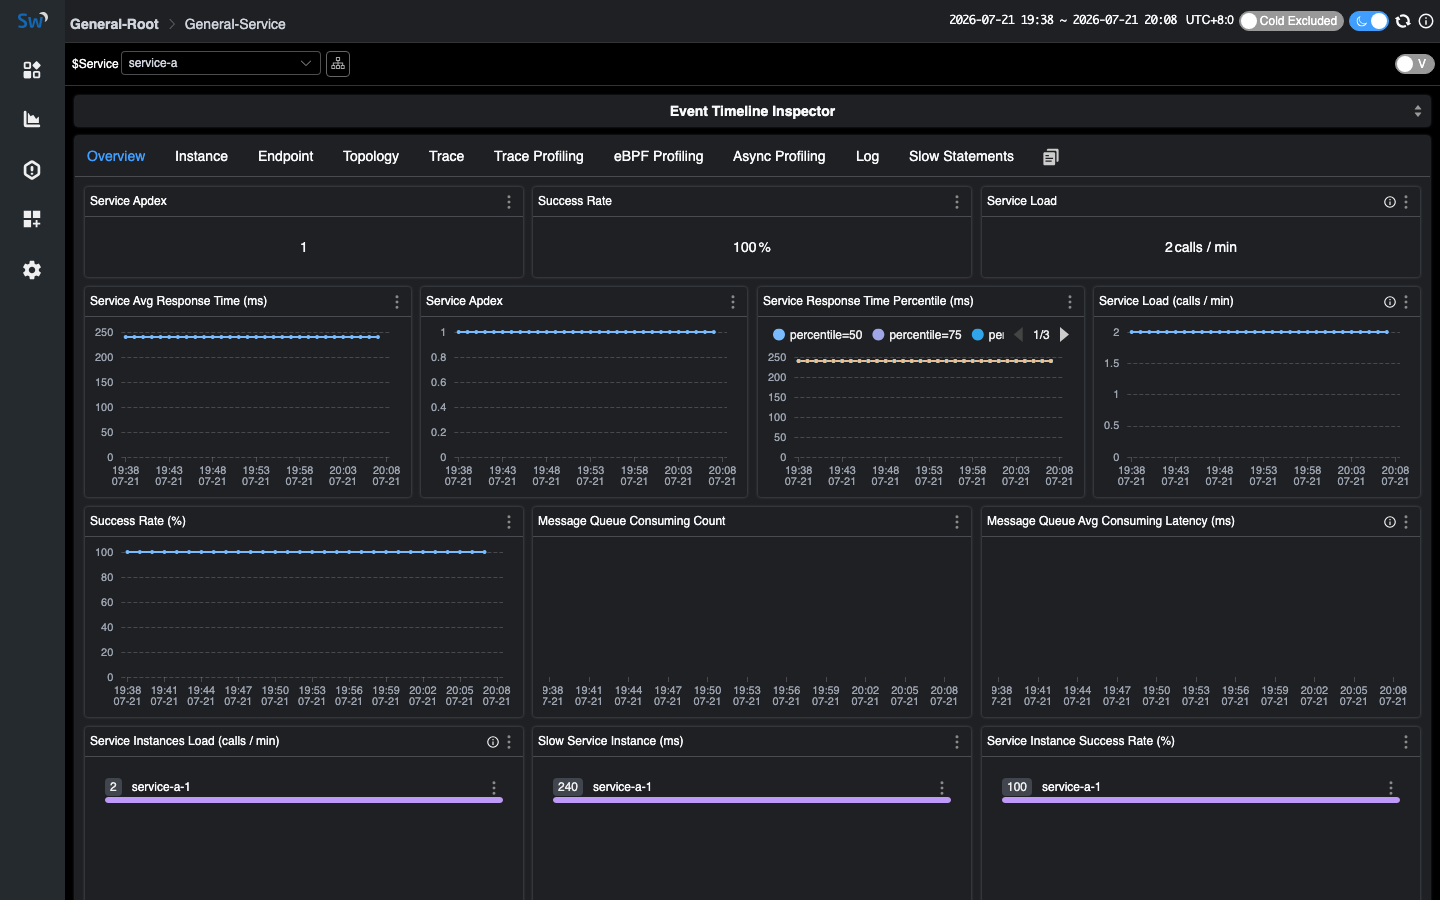
Dashboards (row 20; SkyWalking strength — DataBuff not yet)
DataBuff APM pages (rows 11 / 12; SW middleware via Dashboard evidence above)
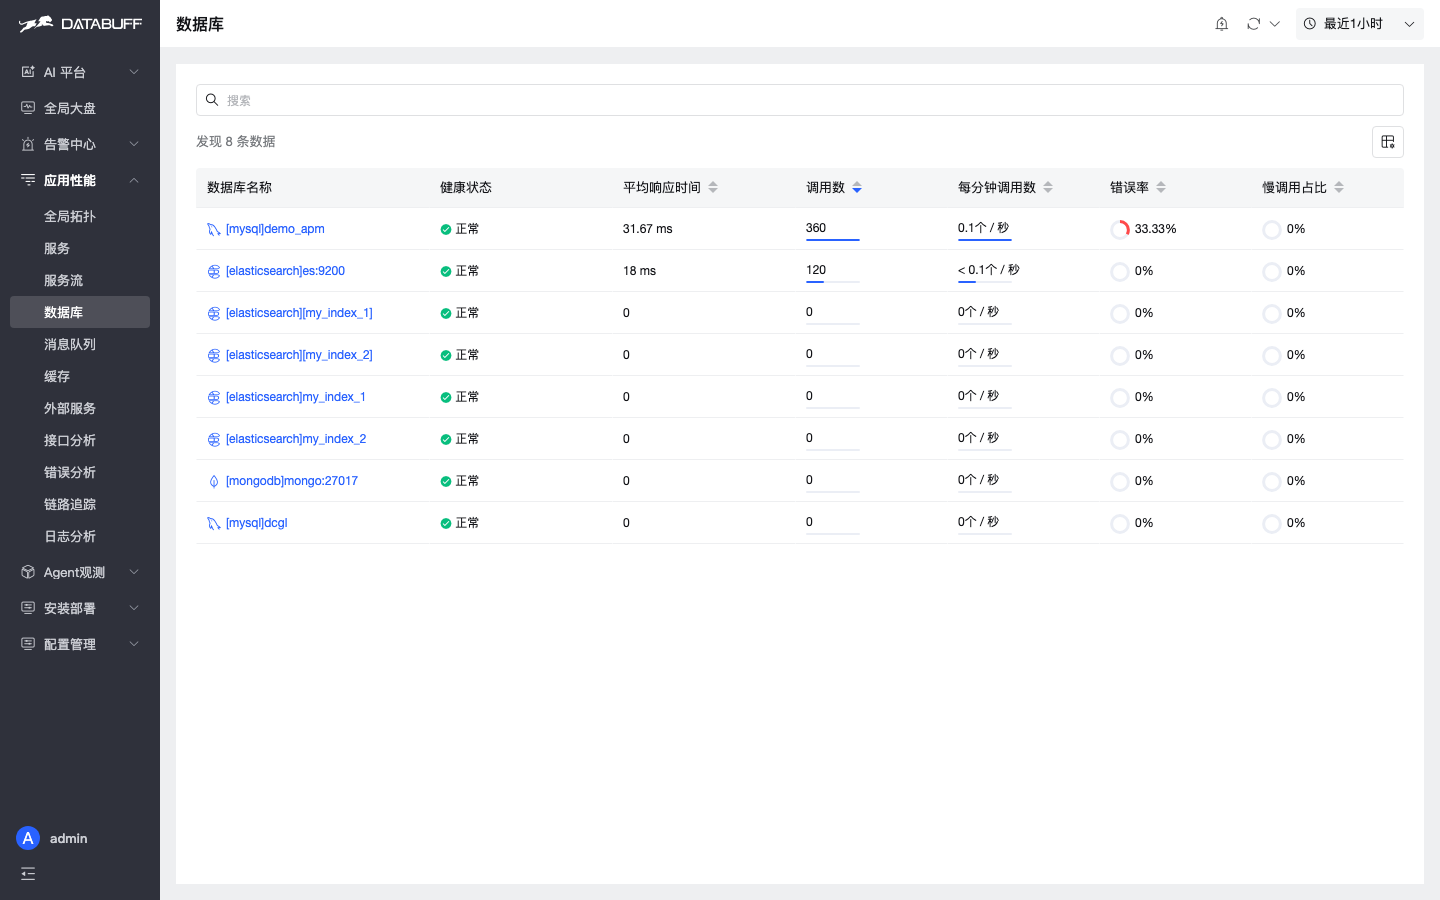
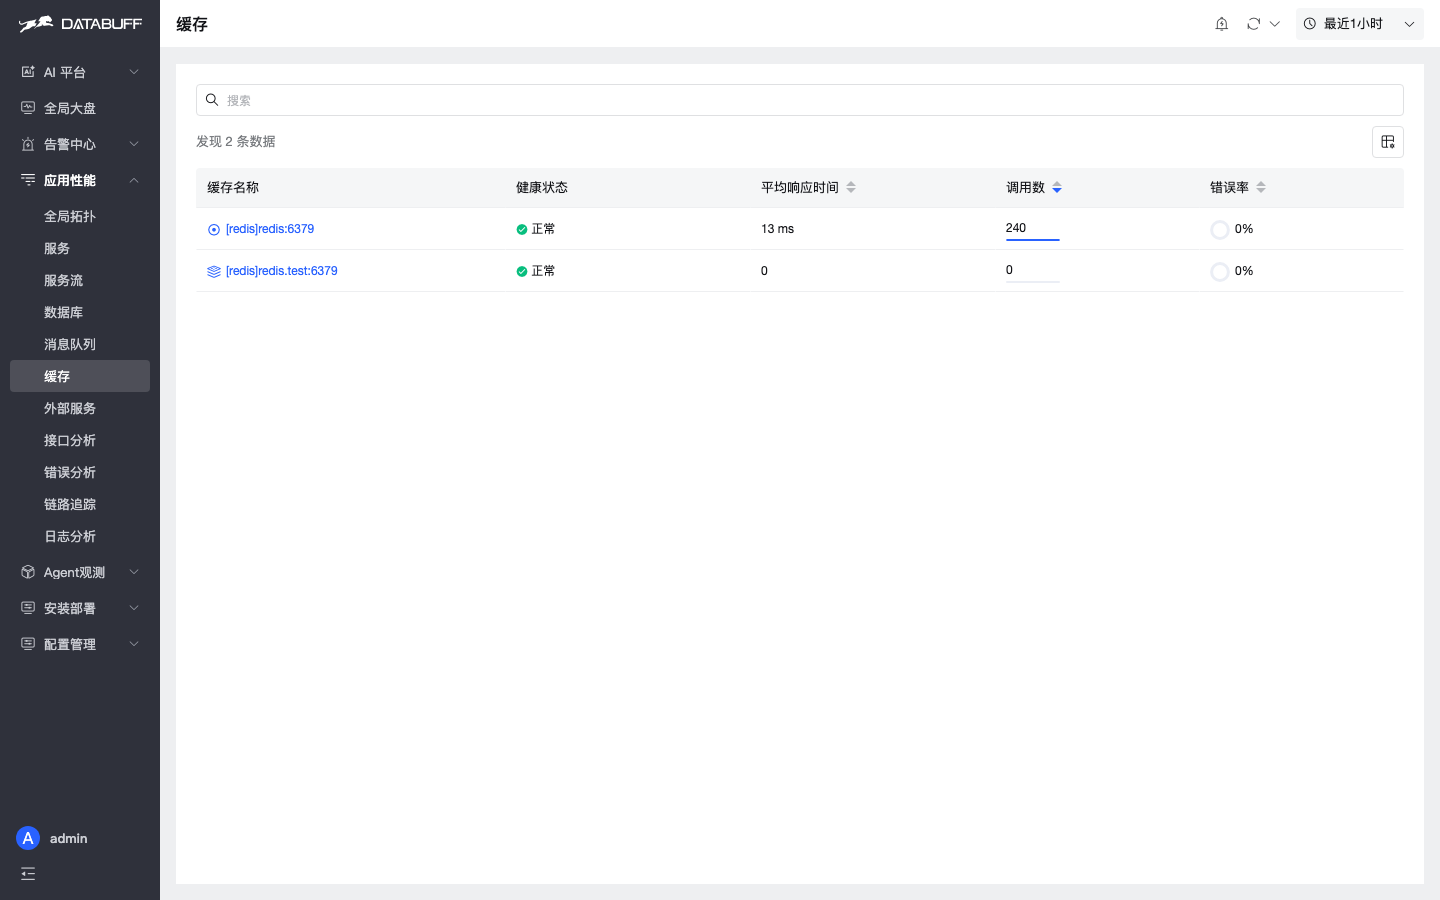
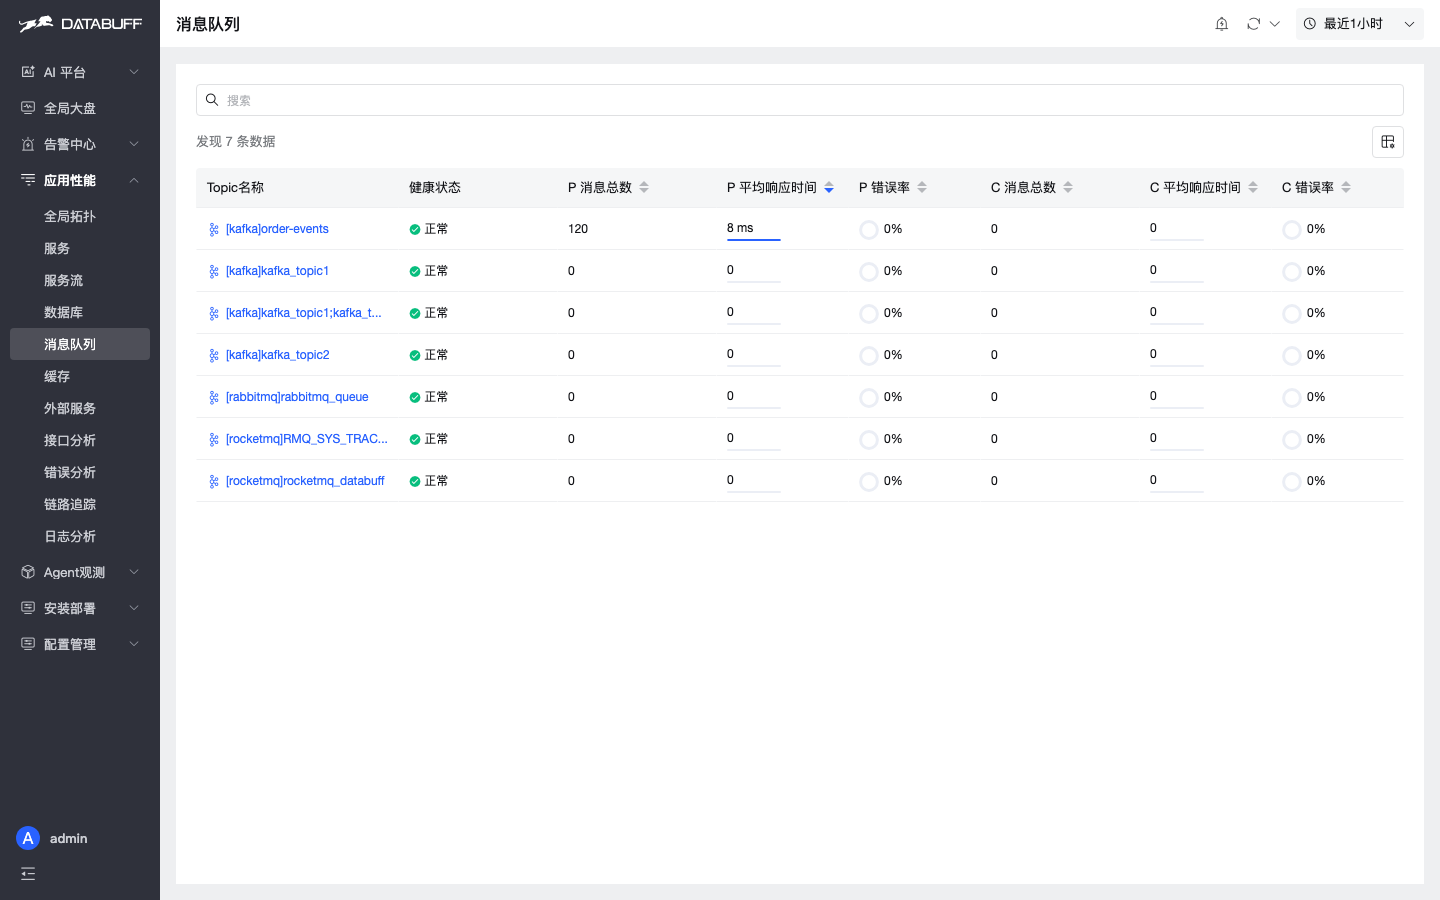
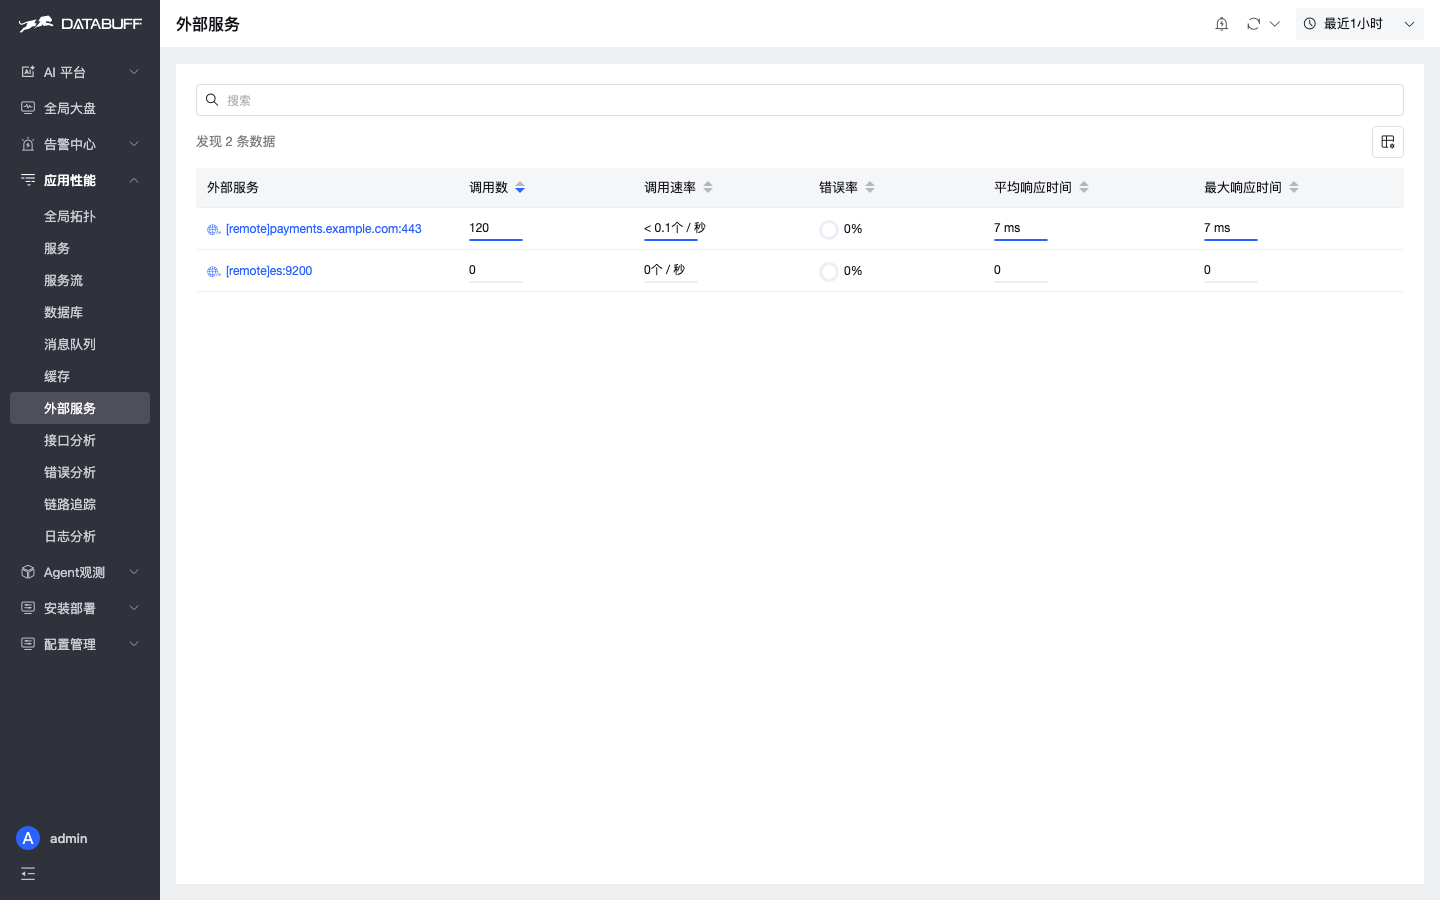
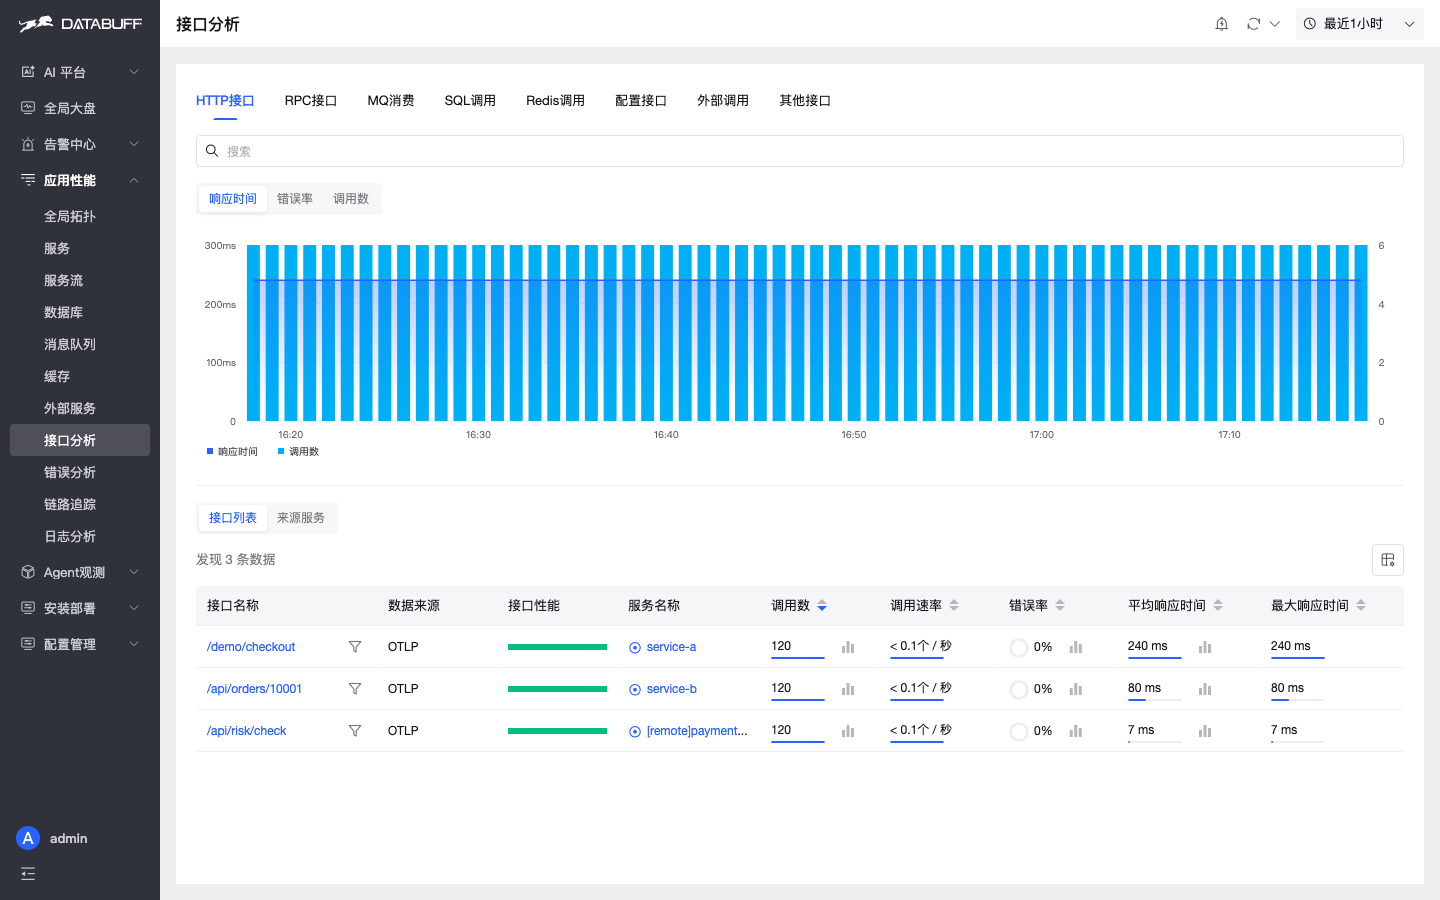
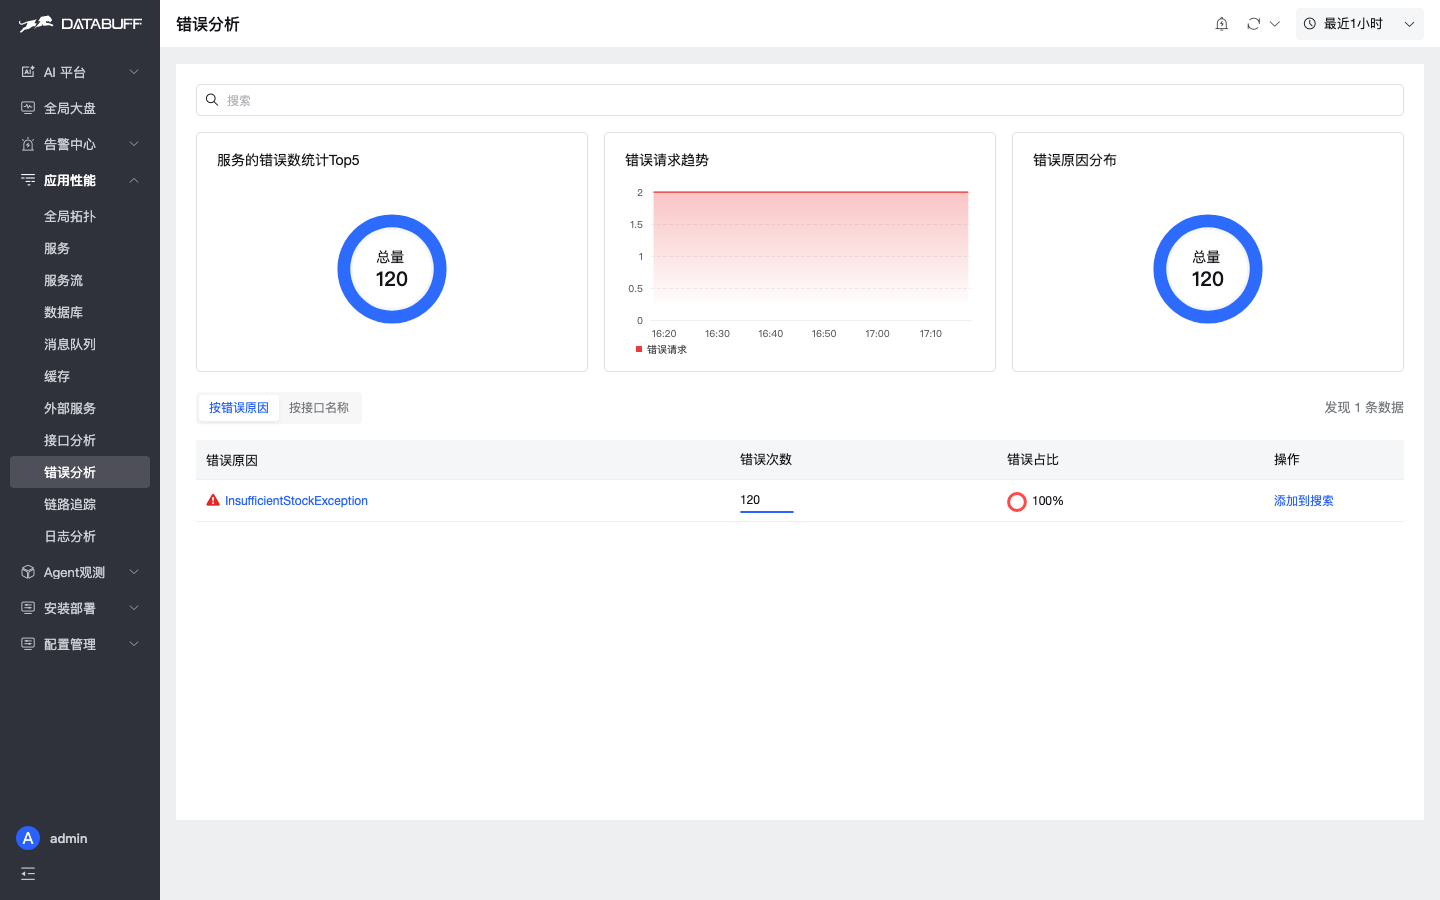
These pages show integrated APM depth — vs SW Dashboard middleware boards, DataBuff pages link more smoothly to call analysis, service flow, and Trace.
Alerting
3. Wrap-up · industry lens
Same host, same Demo: both sides cover the observability basics. DataBuff’s extras are mainly the AI platform, deeper call analysis, service flow, and productized alerting. Profiling and customizable dashboards are where SkyWalking still stands firmly.
One more industry note. In Gartner’s Observability Platforms research—evolved from the classic APM market—the point is plain: platforms must turn telemetry into insight and action through analytics, visualization, and automation, increasingly with AI. Selection is not only “can we collect Traces,” but whether on-call can ask questions, correlate evidence, and skip a few menu hops.
Against this same-host matrix: basics are solid on both sides; the real gap is often whether AI and APM depth can push “seeing” into “acting.” You do not have to pick a camp—running both for your scenario is often steadier than a rip-and-replace.
Ref: Gartner Magic Quadrant for Observability Platforms — https://www.gartner.com/en/documents/5663323
GitHub: https://github.com/databufflabs/databuff