How to Land Distributed Tracing in Production
SkyWalking · Bytecode Enhancement · OpenTelemetry · APM · Distributed Tracing
Summary: Distributed tracing adoption starts with understanding how a non-intrusive Agent weaves Spans at the bytecode layer and how TraceId propagates through gateways and MQ. This article explains bytecode enhancement in SkyWalking / OpenTelemetry Java Agents, gives a five-step landing checklist, and demos service RED, global topology, Trace list, and Span waterfall in the Databuff Application Performance module — connecting theory to an on-call-ready UI.
The frequent confusion around "how to land distributed tracing" is usually not missing tools, but missing an executable sequence: first understand what the Agent does in the JVM, then define propagation and sampling, then choose SkyWalking OAP or OTel + a lightweight APM backend. The sections below follow that order; the second half uses demo.databuff.ai Application Performance for side-by-side screenshots.
1Bytecode Enhancement: Where Distributed Traces Come From
SkyWalking Java Agent and OTel Java Agent both use attach at startup + bytecode weaving — zero business code changes.
1.1 Agent attach at JVM startup
Common production startup:
Before the main class loads, the JVM runs the Agent's premain and registers a ClassFileTransformer — from then on, every class load is a chance for the Agent to rewrite bytecode[1][2].
1.2 Weaving Spans: what happens on one HTTP call
TraceId identifies the whole call chain; SpanId identifies one hop. SkyWalking uses sw8 propagation headers; OTel defaults to W3C Trace Context ( traceparent)[3].
First lesson: No matter how polished the UI, if propagation headers are not unified, the Trace tree breaks in the middle — standardize this before picking a UI.
1.3 Plugins and auto-instrumentation
| Approach | Instrumentation | Typical export |
|---|---|---|
| SkyWalking | Plugin directory for Tomcat / Spring / MySQL / Redis / Kafka, etc.[2] | gRPC → OAP (11800/12800) |
| OpenTelemetry | Auto Instrumentation + semantic conventions | OTLP 4317/4318 |
The gap is not "whether Spans exist," but whether the data model and export protocol are standard OTel — that determines if you can swap backends without swapping Agents.
◆ ◆ ◆
2Five Steps to Land Distributed Tracing
| Step | What to do | Common pitfall |
|---|---|---|
| ① Pilot path | Pick login/checkout, wire 2–3 services only | Full rollout day one — broken chains with unclear ownership |
| ② Propagation | Gateway generates TraceId; unified HTTP/gRPC/MQ headers | Async threads lose Context |
| ③ Sampling & limits | Prod 1–10% head sampling + always sample errors | 100% sampling overwhelms storage |
| ④ Log correlation | JSON logs with trace_id | Trace UI only, no log context |
| ⑤ On-call drill | Given TraceId, find slow Span in 10 minutes | Agent installed but never used in postmortems |
SkyWalking path: Agent → OAP → ES / BanyanDB[4].
OTel path: Agent → OTLP → Collector (optional) → APM backend[3].
Parallel transition: Legacy SkyWalking keeps reporting to OAP; new services export OTLP; Collector handles sampling and redaction — many teams switch over 1–2 quarters, not overnight.
◆ ◆ ◆
3Databuff Application Performance: Demo Walkthrough
Screenshots below are from the Application Performance module on demo.databuff.ai (live session 2026-06-30). Open-source APM Databuff uses OTLP ingestion; UI path: Services → Topology → Tracing → Trace detail.
3.1 Service RED: the on-call landing screen
After rollout, on-call usually opens service list + RED metrics (request rate, error rate, response time). In the Demo, service-a averages ~240ms, service-b ~70ms, 0% errors — filter abnormal services first, then drill into Traces.
Databuff Demo · Application Performance → Services
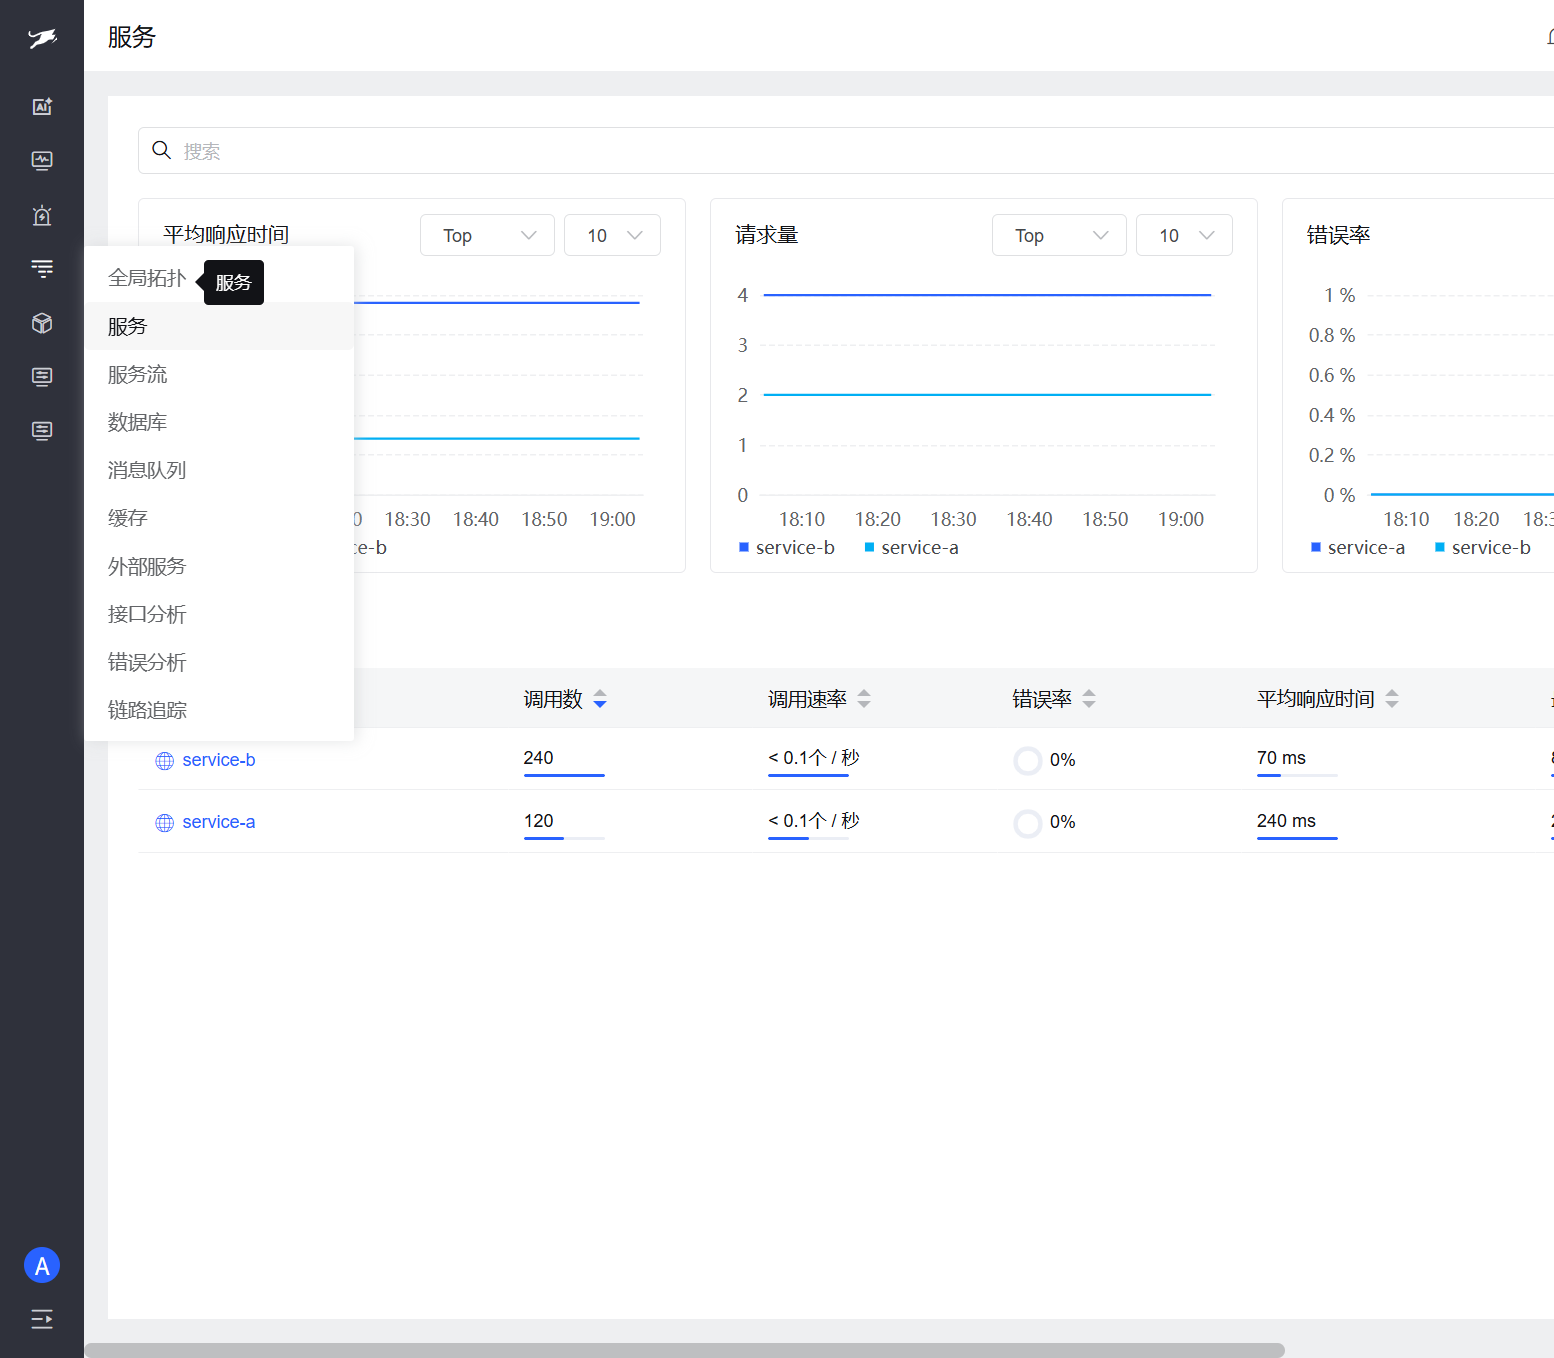
Figure 3-1 · Service page shows response time, request volume, error rate trends and table summary; minute-level RED from OTel, same ingest pipeline as Traces.
3.2 Global topology: are dependencies fully captured?
Aggregated Traces produce a service dependency topology. In the Demo, service-a links to MySQL, Redis, Kafka, Elasticsearch, and service-b — used to validate propagation rules and whether middleware Spans are missing.
Databuff Demo · Application Performance → Global topology
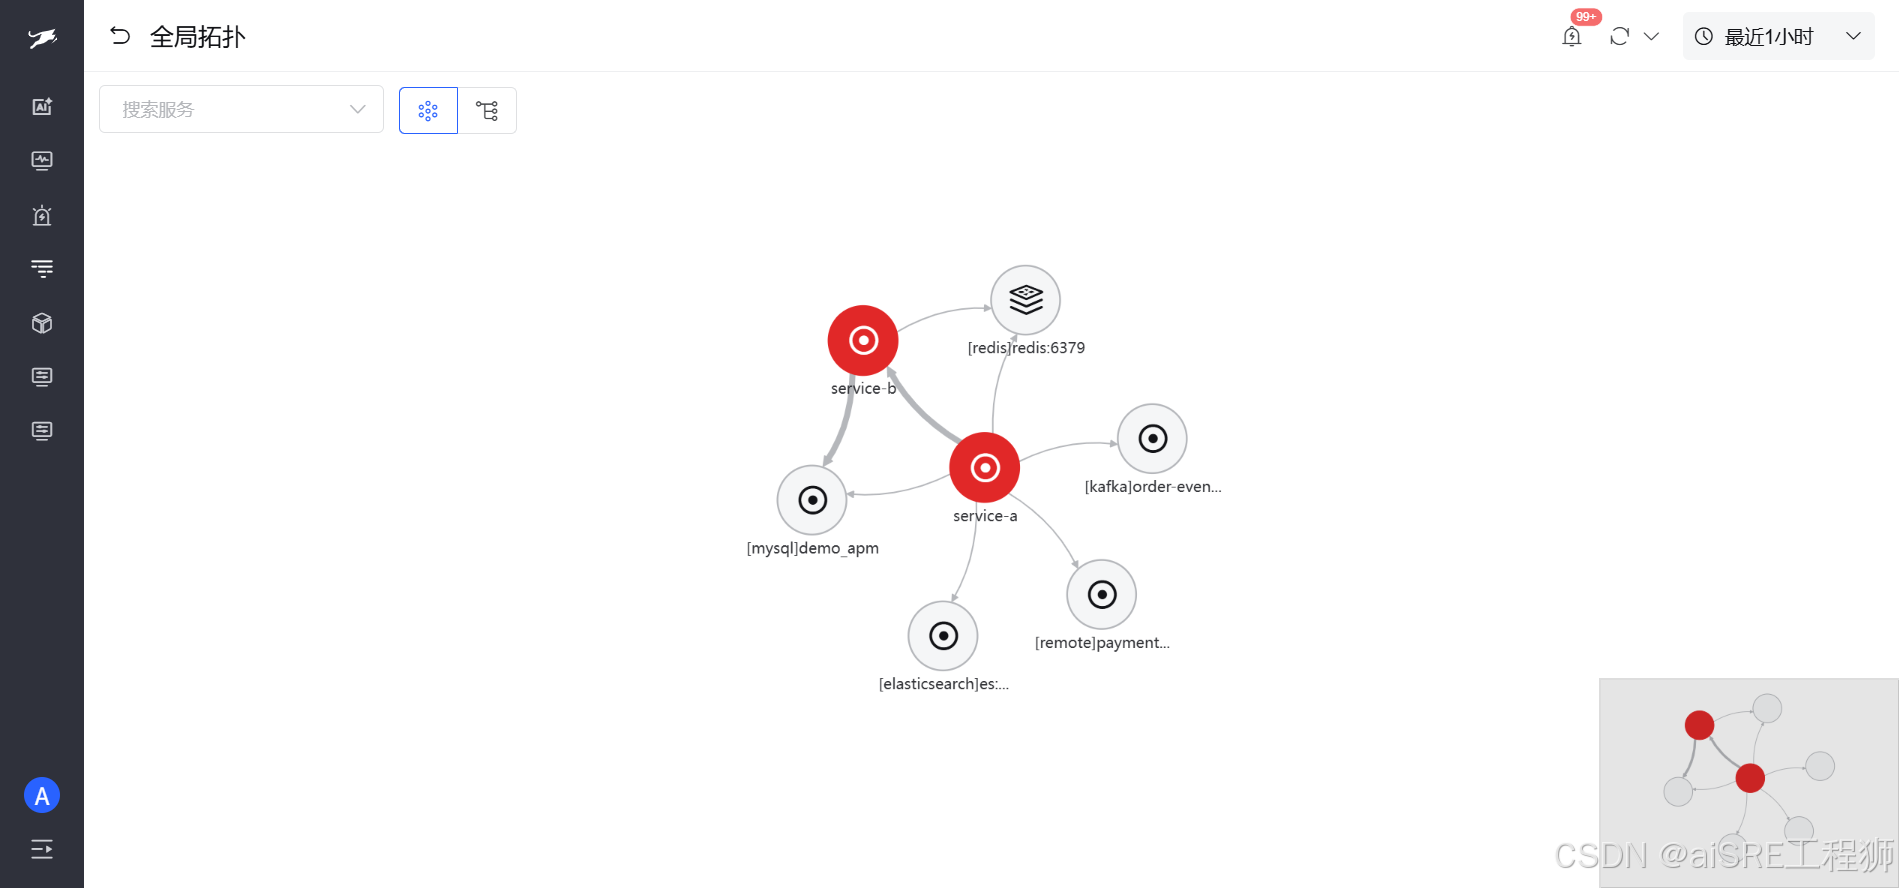
Figure 3-2 · Global topology shows cross-service and middleware edges; during acceptance, compare against your architecture diagram for "expected but missing" edges (often MQ headers without TraceId).
3.3 Tracing: from chart point to Trace list
The Tracing page shows Trace count and P50–P99 latency over time; click a point on the chart to open the Trace list (TraceId, API, duration) — the UI for §2 step ⑤.
Databuff Demo · Application Performance → Tracing
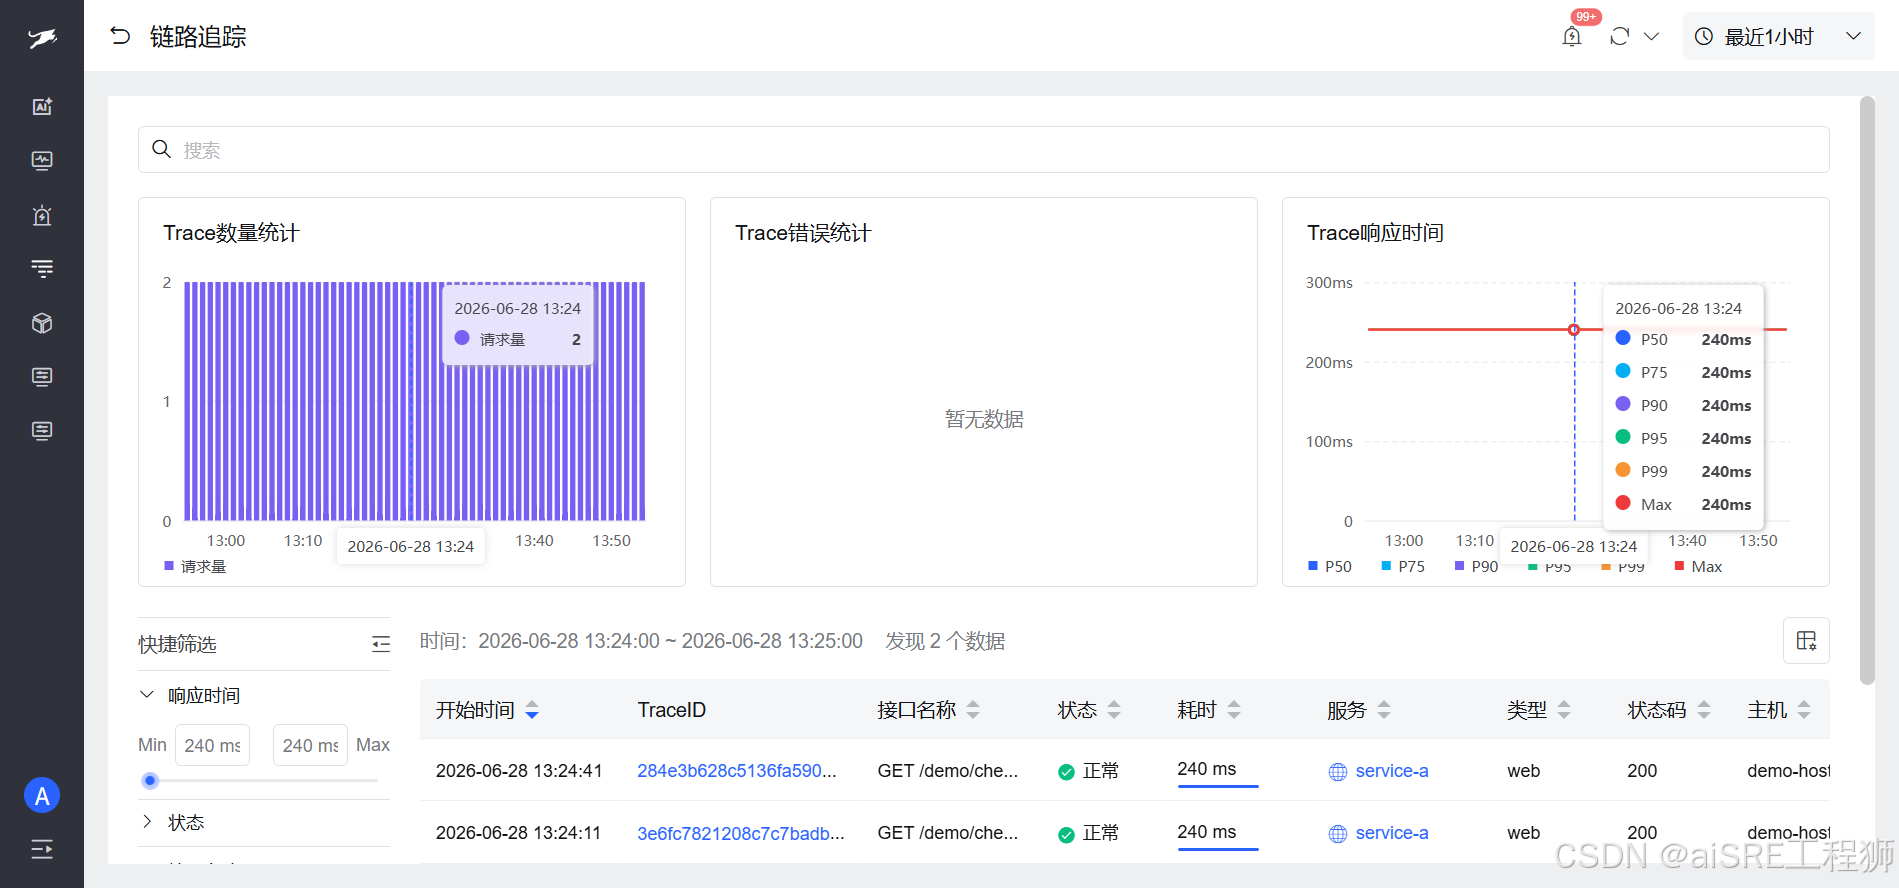
Figure 3-3 · Trace count and latency percentiles; hint at bottom "click any point for request details" — macro to micro drill-down.
3.4 Span waterfall: the end state of bytecode weaving
Opening a TraceId shows the call order waterfall: root Span GET /demo/checkout (~240ms), child Spans for Redis, HTTP outbound, downstream service-b, MySQL, etc. — exactly what §1 bytecode collection looks like in the UI.
Databuff Demo · Trace detail · Call order
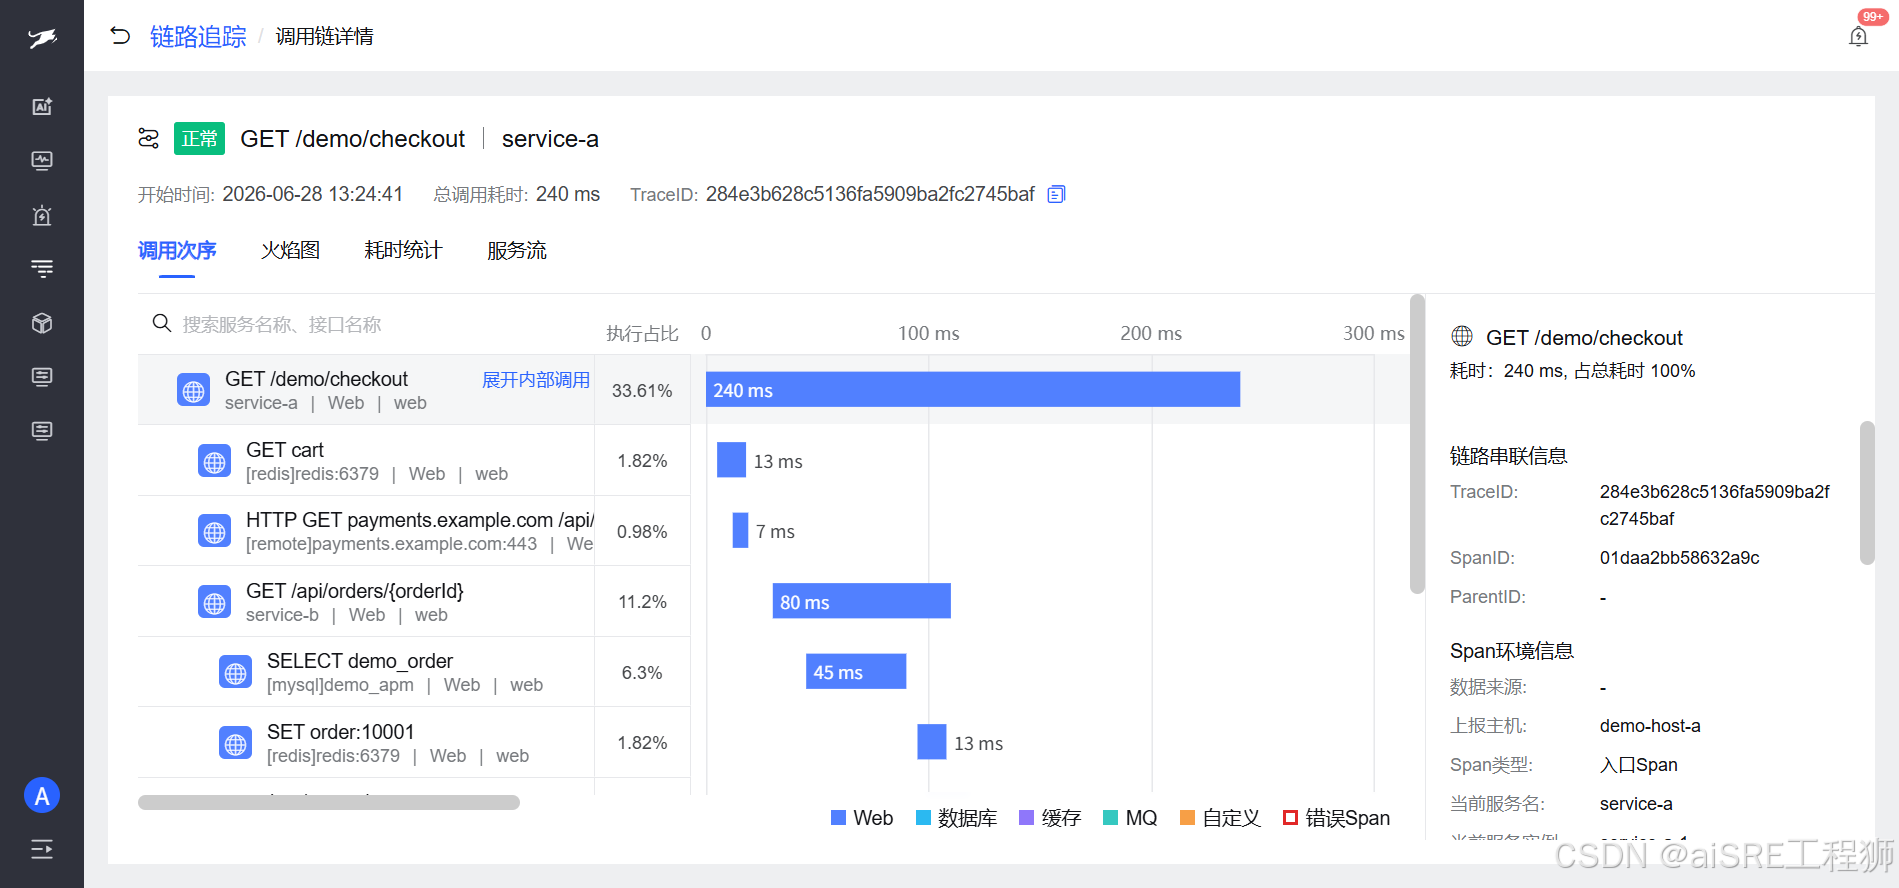
Figure 3-4 · Waterfall shows Span duration and type (Web/RPC/DB/Cache) on a timeline; right panel has TraceId, SpanId, entry Span — answers "which hop is slow."
3.5 Service flow: downstream contribution from entry service
Service flow expands downstream edges from an entry service (e.g. service-a) with response contribution — answers "is slowness local logic or a dependency," similar to SkyWalking topology latency share.
Databuff Demo · Application Performance → Service flow
Figure 3-5 · Service flow: entry service-a to MySQL, Elasticsearch, etc., with response contribution percentages; useful for SLO reviews and dependency governance. (Screenshot pending CDN upload.)
Comparison with SkyWalking UI: SkyWalking console also offers topology, Traces, and service metrics; Databuff Application Performance uses OTLP + unified storage, path "Services → Topology → Tracing → Trace detail." Compare query latency and ops component count for the same Trace based on your OTel progress.
◆ ◆ ◆
4Summary
Distributed tracing rollout = understand how bytecode Agents collect Spans + five-step engineering discipline + choose SkyWalking OAP or OTel APM backend.
Run one pilot checkout Trace in Demo or test env first, then expand to the cluster — better than comparing ten tools on day one. With existing SkyWalking, OTel-ize new services and ingest in parallel to Databuff, compare Traces for the same request, and evaluate dual-stack ops cost.
◆ ◆ ◆
5References
[1] https://skywalking.apache.org/docs/skywalking-java/latest/en/setup/service-agent/java-agent/readme/ (SkyWalking Java Agent)
[2] https://skywalking.apache.org/docs/skywalking-java/latest/en/setup/service-agent/java-agent/agent-optional-plugins/ (Agent plugins and bytecode enhancement)
[3] https://opentelemetry.io/docs/languages/java/automatic/ (OpenTelemetry Java auto-instrumentation)
[4] https://skywalking.apache.org/docs/main/latest/en/setup/quick-start/ (SkyWalking Quick Start)
[5] https://github.com/databufflabs/databuff (Databuff open source)
[6] https://demo.databuff.ai/ (Databuff online Demo)
◆ ◆ ◆