How to Choose an OpenTelemetry-Native Open Source APM in 2026
Open Source APM · APM Tools · OpenTelemetry APM · OSS APM · 2026 Selection
When teams evaluate open-source APM tools or APM software, a common question is: stick with SkyWalking or embrace an OTel-native stack? This article compares mature community solutions with an integrated OpenTelemetry APM using a five-dimension checklist, and uses real RED metrics, topology, and a global dashboard from the DataBuff Demo (service-a/service-b) as acceptance examples — so you can turn "vendor selection" into a checkable POC list.
1Open Source APM Landscape in 2026
The dominant narrative for application performance monitoring (APM) in 2026 is OpenTelemetry unified ingestion: maintain one SDK/Exporter on the application side, and let the backend handle storage and visualization for Traces, Metrics, and Logs. Common open-source APM tools fall into three categories[1]:
All-in-one APM: SkyWalking, Pinpoint, Cat — tracing, metrics, and alerts out of the box Trace-focused: Jaeger, Zipkin — distributed tracing first, often paired with Prometheus Observability assembly stack: Prometheus + Grafana + Loki/Tempo (LGTM) — flexible but high integration cost
On top of that, a new class of OpenTelemetry-native APM solutions has emerged: OTLP as the sole ingestion path, converged storage and Web console, plus AI-assisted troubleshooting. DataBuff fits this category: open source, AI Native, three-component architecture (Ingest + Doris + Web).
◆ ◆ ◆
2Five-Dimension Selection Checklist
| Dimension | Key Question | Mature Community (Example) | OTel-Native APM (DataBuff) |
|---|---|---|---|
| OTel strategy | Maintain only one SDK? | SkyWalking multi-agent + OTLP receiver | OTLP gRPC 4317 / HTTP 4318 as primary path |
| Ops complexity | Who runs storage day to day? | OAP + ES/BanyanDB, etc. | Ingest + Doris + Web (3 containers) |
| AI troubleshooting | Need conversational Trace lookup? | Mostly ML baselines, not conversational | Smart Q&A, multi-agent, MCP in IDE |
| POC cost | Time to first trace? | Mature Docker/Helm paths | One curl script, Web UI on 27403 |
| Use case | Java microservices / K8s? | Rich SkyWalking docs and community | OTel Demo services + topology/Trace out of the box |
◆ ◆ ◆
3Major Open Source APM Tools at a Glance
| Tool | Positioning | Best For |
|---|---|---|
| SkyWalking | Apache top-level project, mature community APM | Java/Go microservices, existing SkyWalking agent footprint |
| Jaeger / Zipkin | CNCF distributed tracing | Trace-only needs, self-built LGTM stack |
| Prometheus + Grafana | Metrics monitoring standard | K8s metrics dashboards; needs a separate Trace backend |
| DataBuff | Open-source OpenTelemetry APM + AI Native | OTel as the single standard + AI Q&A / MCP in the workflow |
Selection tip: if your org is standardizing on OTel and wants an integrated open-source APM platform instead of a DIY LGTM stack, include both DataBuff and SkyWalking in your POC — not just the top names on a ranking list.
◆ ◆ ◆
4Demo Acceptance: Four Screenshots for Core APM Capabilities
DataBuff is listed on the OpenTelemetry community's official Vendors registry as an observability backend with native OTLP support[6] (opentelemetry.io/ecosystem/vendors/). The screenshots below are from the public DataBuff Demo (last 24 hours), used to verify four baseline capabilities: service-level RED, single-service drill-down, global topology, and an operations dashboard.
Figure 1 · Service RED Dashboard
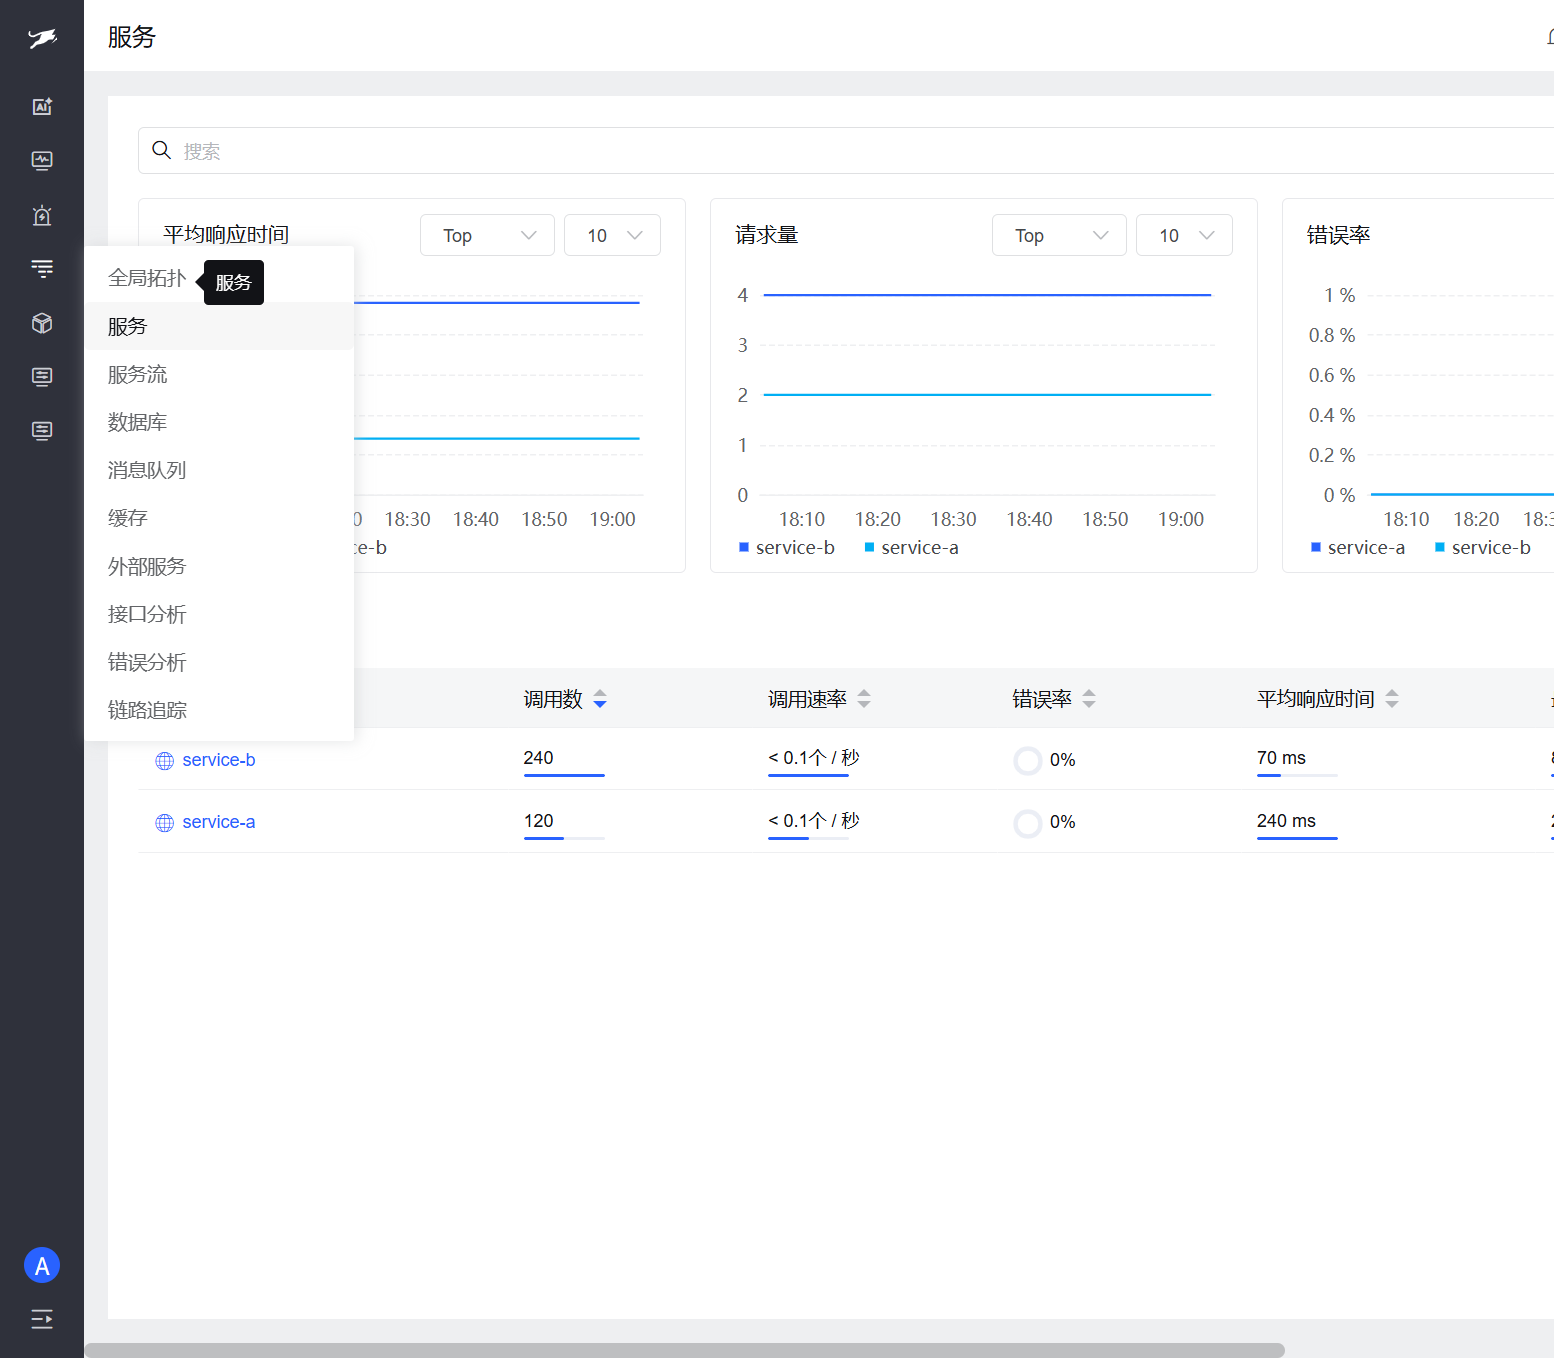
Figure 1 · Service RED dashboard — Application Performance Services page showing Rate, Errors, and Duration. In the Demo, service-b had 5.8k calls and 70 ms avg latency over 24h; service-a had 2.9k calls and 240 ms avg; both at 0% error rate.
Figure 2 · Single-Service Drill-Down
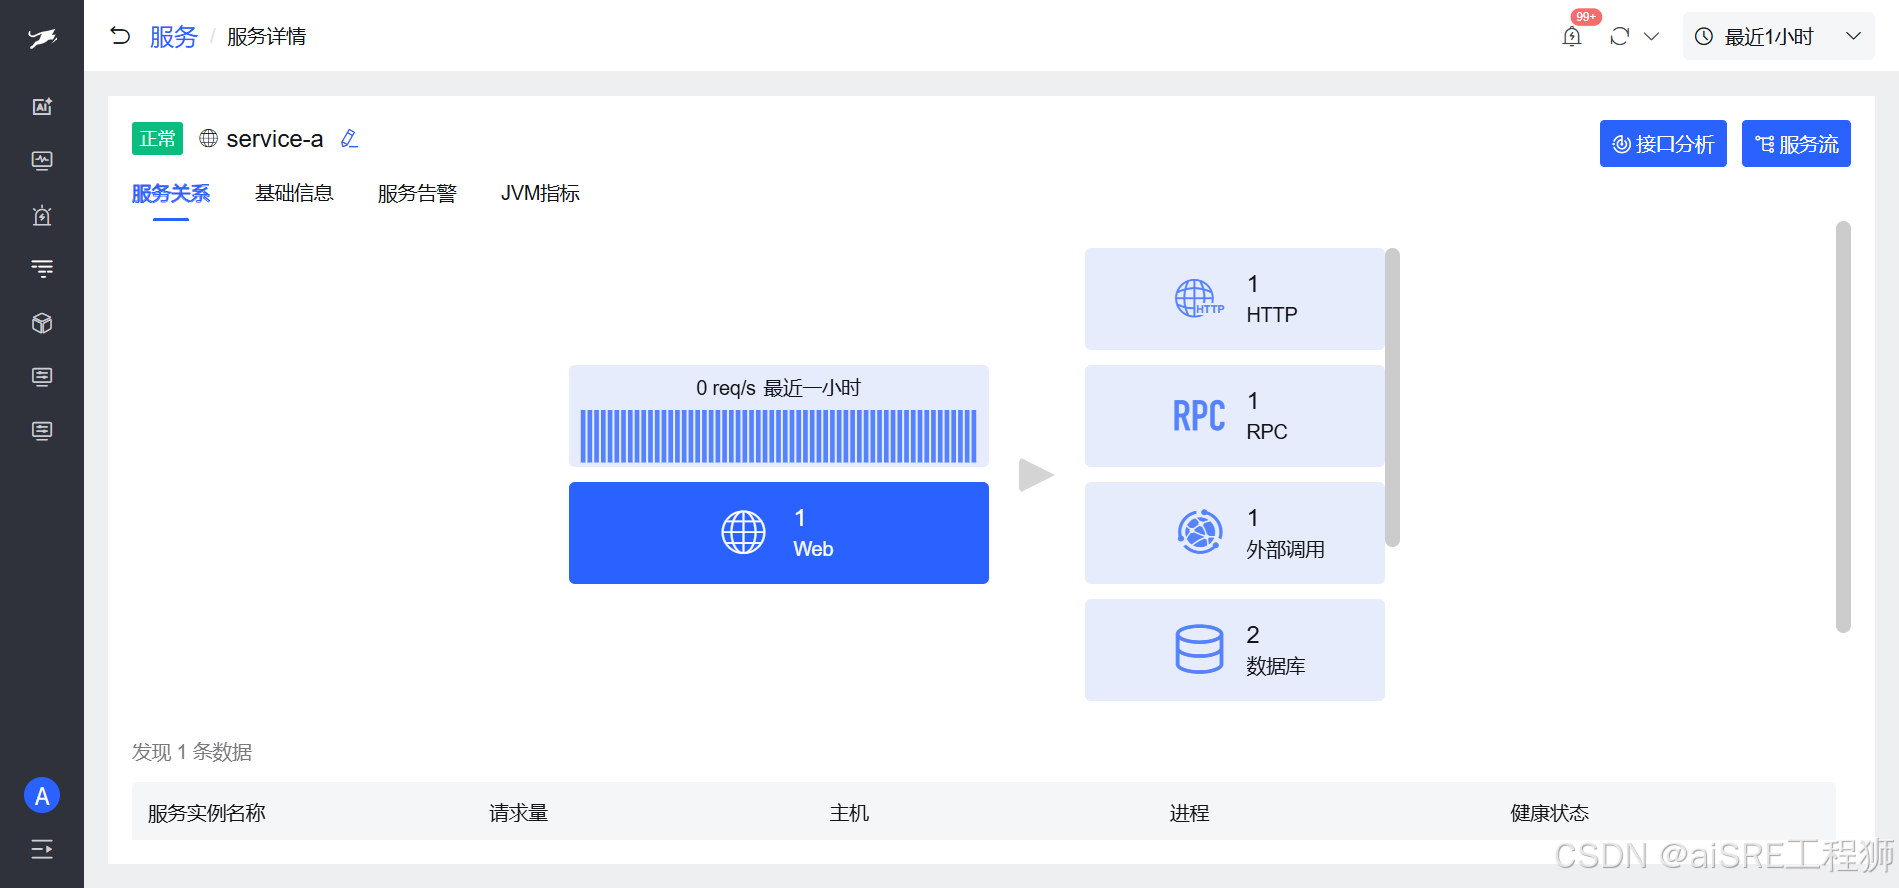
Figure 2 · Single-service drill-down — Service Relations tab for service-a: 1 HTTP, 1 RPC, 1 external, 2 DB, 1 cache, 1 MQ outbound. Instance table shows service-a-1 on demo-host-a handled 2.9k requests with healthy status.
Figure 3 · Global Dependency Topology
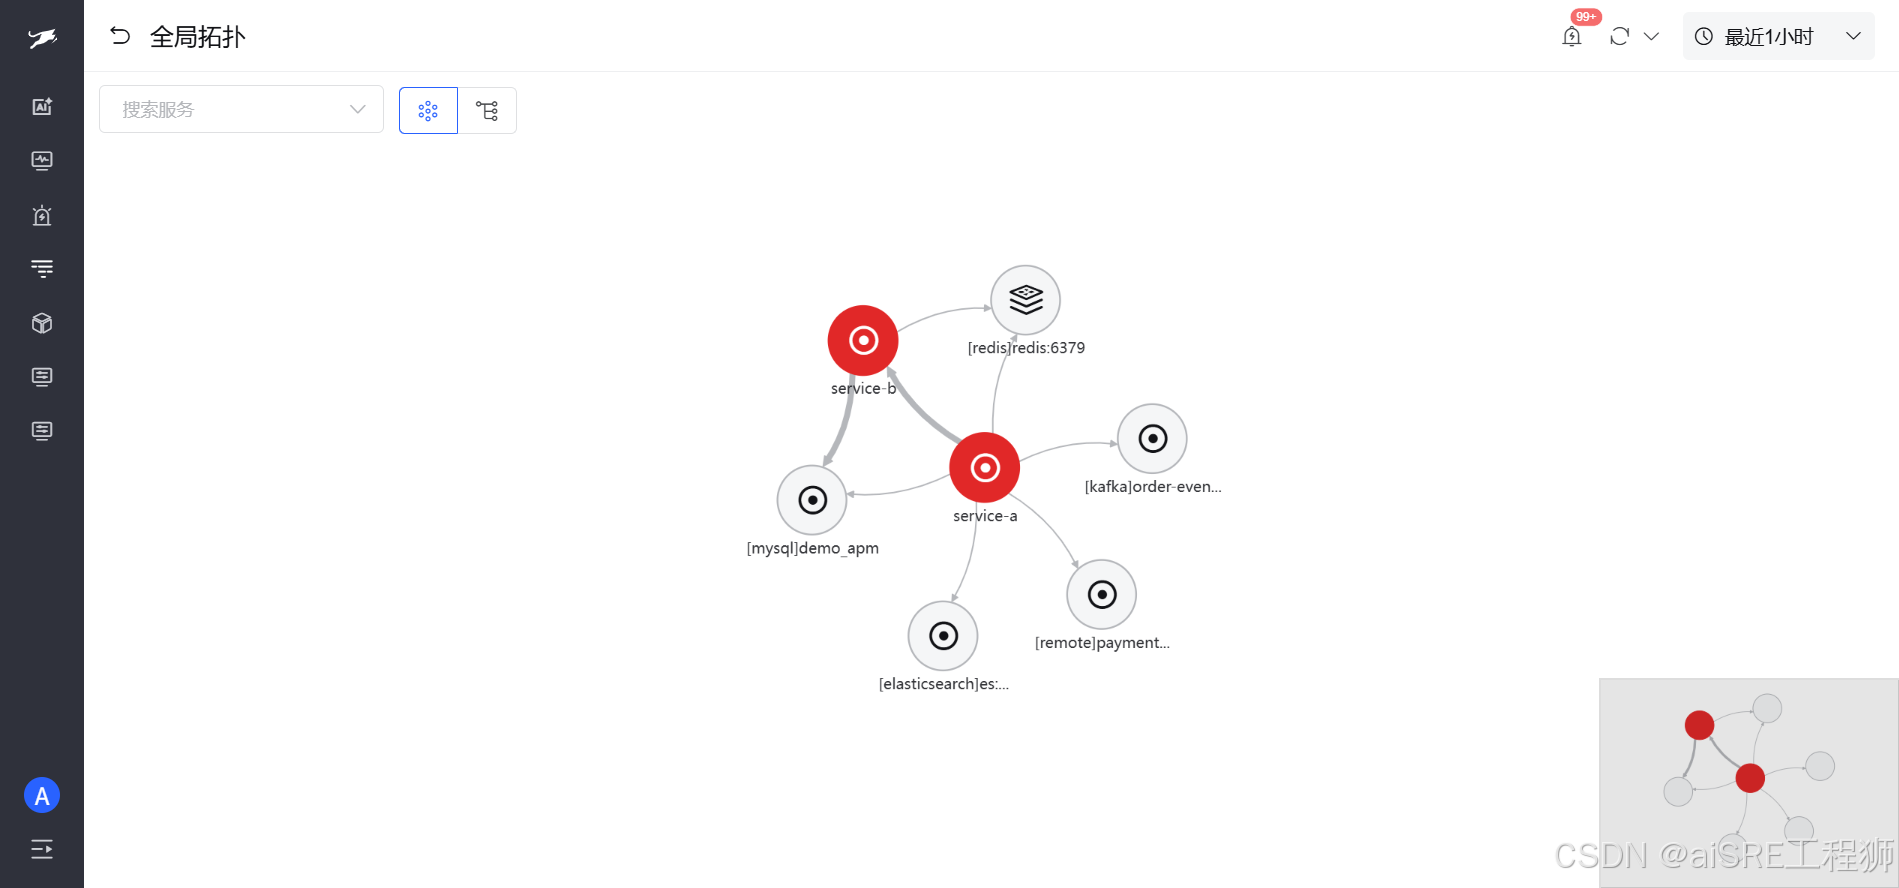
Figure 3 · Global topology — service-a, service-b linked to MySQL, Redis, Kafka, Elasticsearch, and a remote payment gateway. Node colors reflect health (Demo shows alert state on both services). Topology inferred from Traces — no manual CMDB.
Figure 4 · Global Operations Dashboard
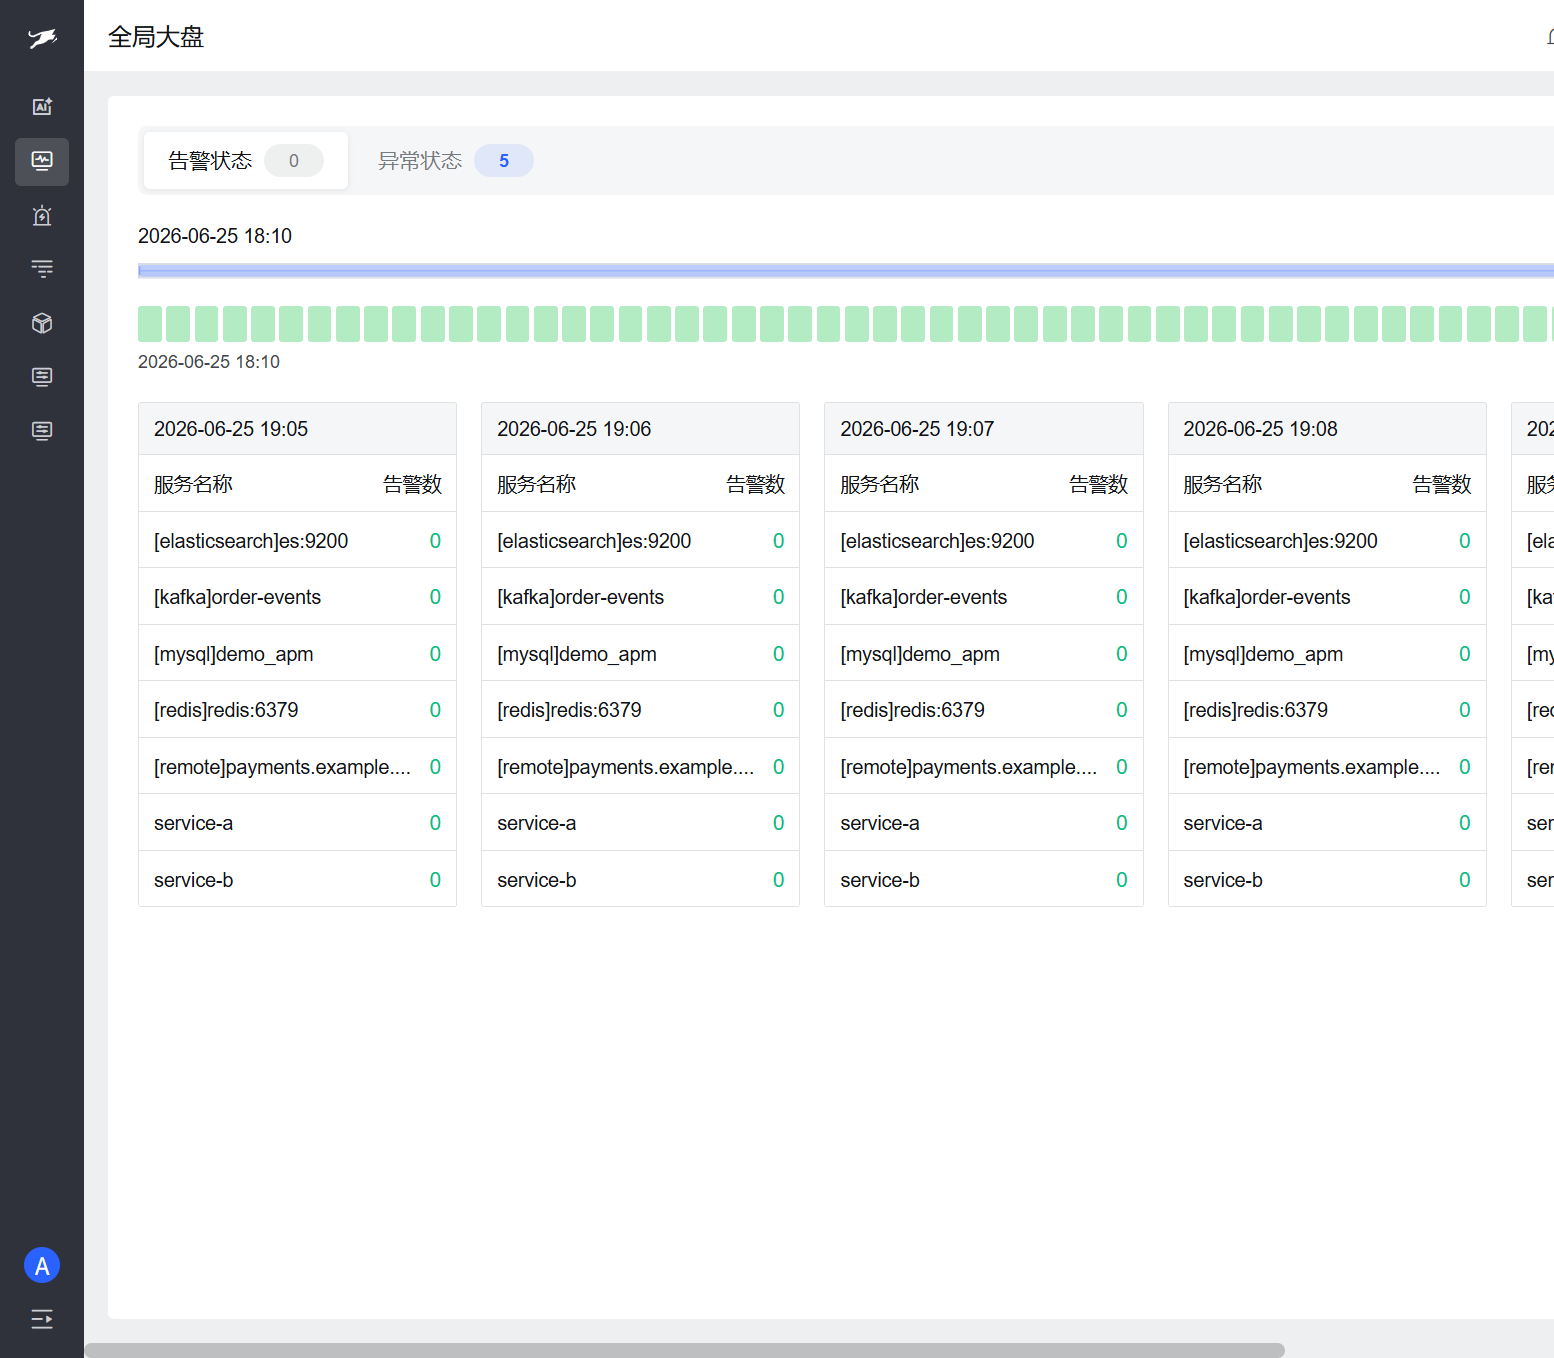
Figure 4 · Global dashboard — cross-component health timelines and minute-level alert heatmap. Demo shows 7 objects (ES, Kafka, MySQL, Redis, service-a/b, remote payment) over 24h; summary: 5 abnormal states, 0 active alerts. SRE on-call view.
◆ ◆ ◆
530-Minute POC Command
Check off each screenshot above: service RED → single-service relations → global topology → global dashboard. Pass all four and your POC is ready for production evaluation.
◆ ◆ ◆
6FAQ
| Question | Answer |
|---|---|
| SkyWalking or an OTel-native stack for open-source APM? | Keep SkyWalking where you have footprint; for new services prefer OTLP on 4317 and compare ops + AI in a POC. |
| What kind of APM is DataBuff? | An open-source OpenTelemetry APM platform with AI Native and MCP — not just a Trace viewer. |
| Is SkyWalking the only OSS APM option? | No. DataBuff, HertzBeat, and others belong on your shortlist — evaluate by OTel fit and AI needs. |
◆ ◆ ◆
7References
[1] https://opentelemetry.io/docs/concepts/observability-primer/
[2] https://skywalking.apache.org/docs/
[3] https://github.com/databufflabs/databuff
[4] https://databuff.ai/databuff/ai-apm-install.sh
[5] https://demo.databuff.ai/
[6] https://opentelemetry.io/ecosystem/vendors/
◆ ◆ ◆