Full-Link Monitoring Tools: OTLP Ingest and Unified APM in Practice
Full-Link Monitoring · OTLP · OpenTelemetry · Distributed Tracing · Jaeger · SkyWalking · DataBuff
When evaluating full-link monitoring tools, teams often ask: Is Jaeger enough? Do we need SkyWalking? How do we assemble the LGTM stack? This guide maps the spectrum from trace-only backends to unified APM, using DataBuff Demo checkout traces — aggregate stats, span waterfalls, and service flow — to show the four-layer drill-down loop after OTLP 4317 ingest: topology → aggregates → single request → contribution.
1The monitoring tool spectrum
| Category | Examples | Scope |
|---|---|---|
| Trace-only | Jaeger, Zipkin | Distributed call chains; metrics/alerts usually external |
| Unified APM | SkyWalking, DataBuff | Trace + metrics + topology + alerting |
| Cloud-native assembly | Tempo + Prometheus + Loki + Grafana | Flexible; ops and dashboards are DIY |
If the requirement is full-link monitoring tools with explicit OpenTelemetry, prioritize an OTLP-native backend over systems that only support legacy proprietary agents.
◆ ◆ ◆
2OpenTelemetry ingest essentials
A dual-export Collector is a common migration pattern: one receiver can export to existing Jaeger and a new APM backend in parallel, then compare trace fields and topology consistency [1].
◆ ◆ ◆
3Tool comparison (2026)
| Tool | OTLP | Topology | Span waterfall | Notes |
|---|---|---|---|---|
| Jaeger | Native | Yes | Yes | Lightweight trace-first choice |
| SkyWalking | Supported | Strong | Yes | Mature community APM |
| LGTM | Tempo native | Grafana | Yes | K8s-standard assembly |
| DataBuff | Primary path | Auto | Multi-protocol spans | Unified + service-flow contribution |
◆ ◆ ◆
4Demo acceptance: topology to a single trace
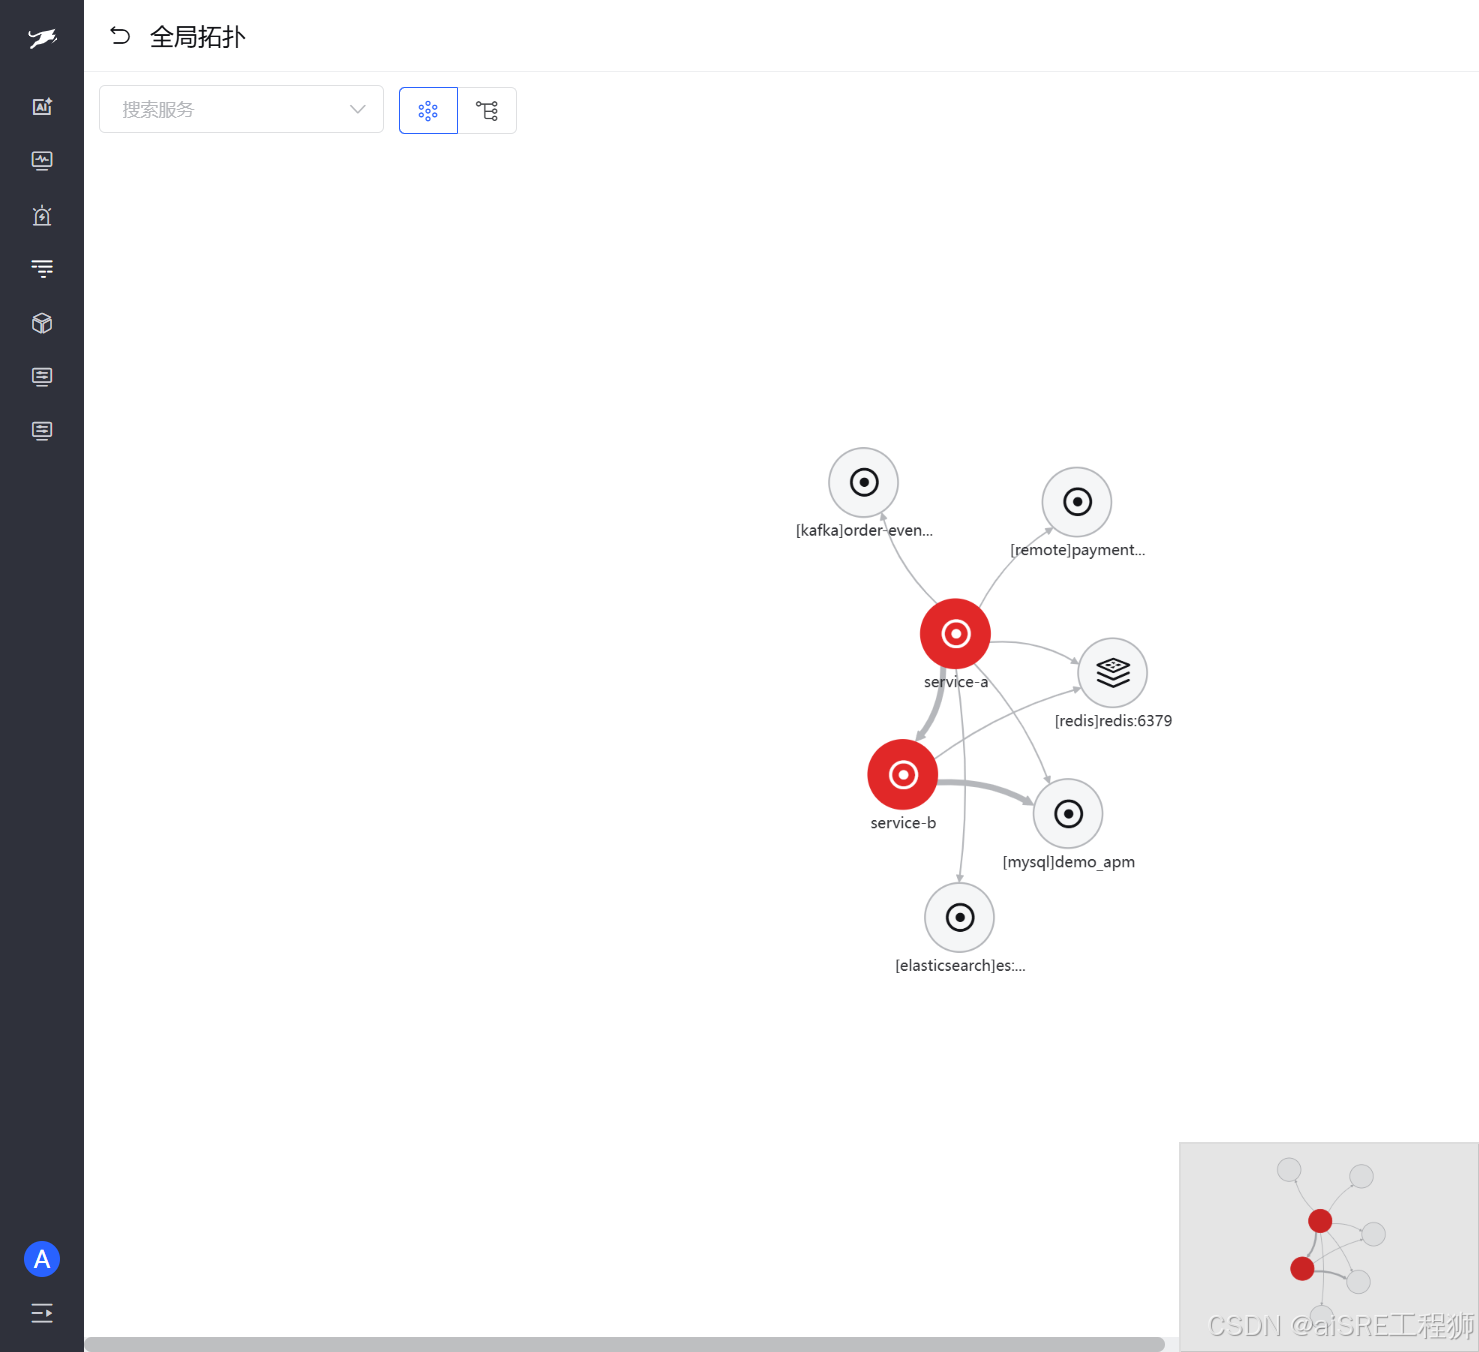
Figure 1 · Architecture-level full-link view
Global topology auto-draws the service-a → service-b call chain plus MySQL, Redis, Kafka, ES, and remote HTTP edges. Node colors reflect health/alert status.
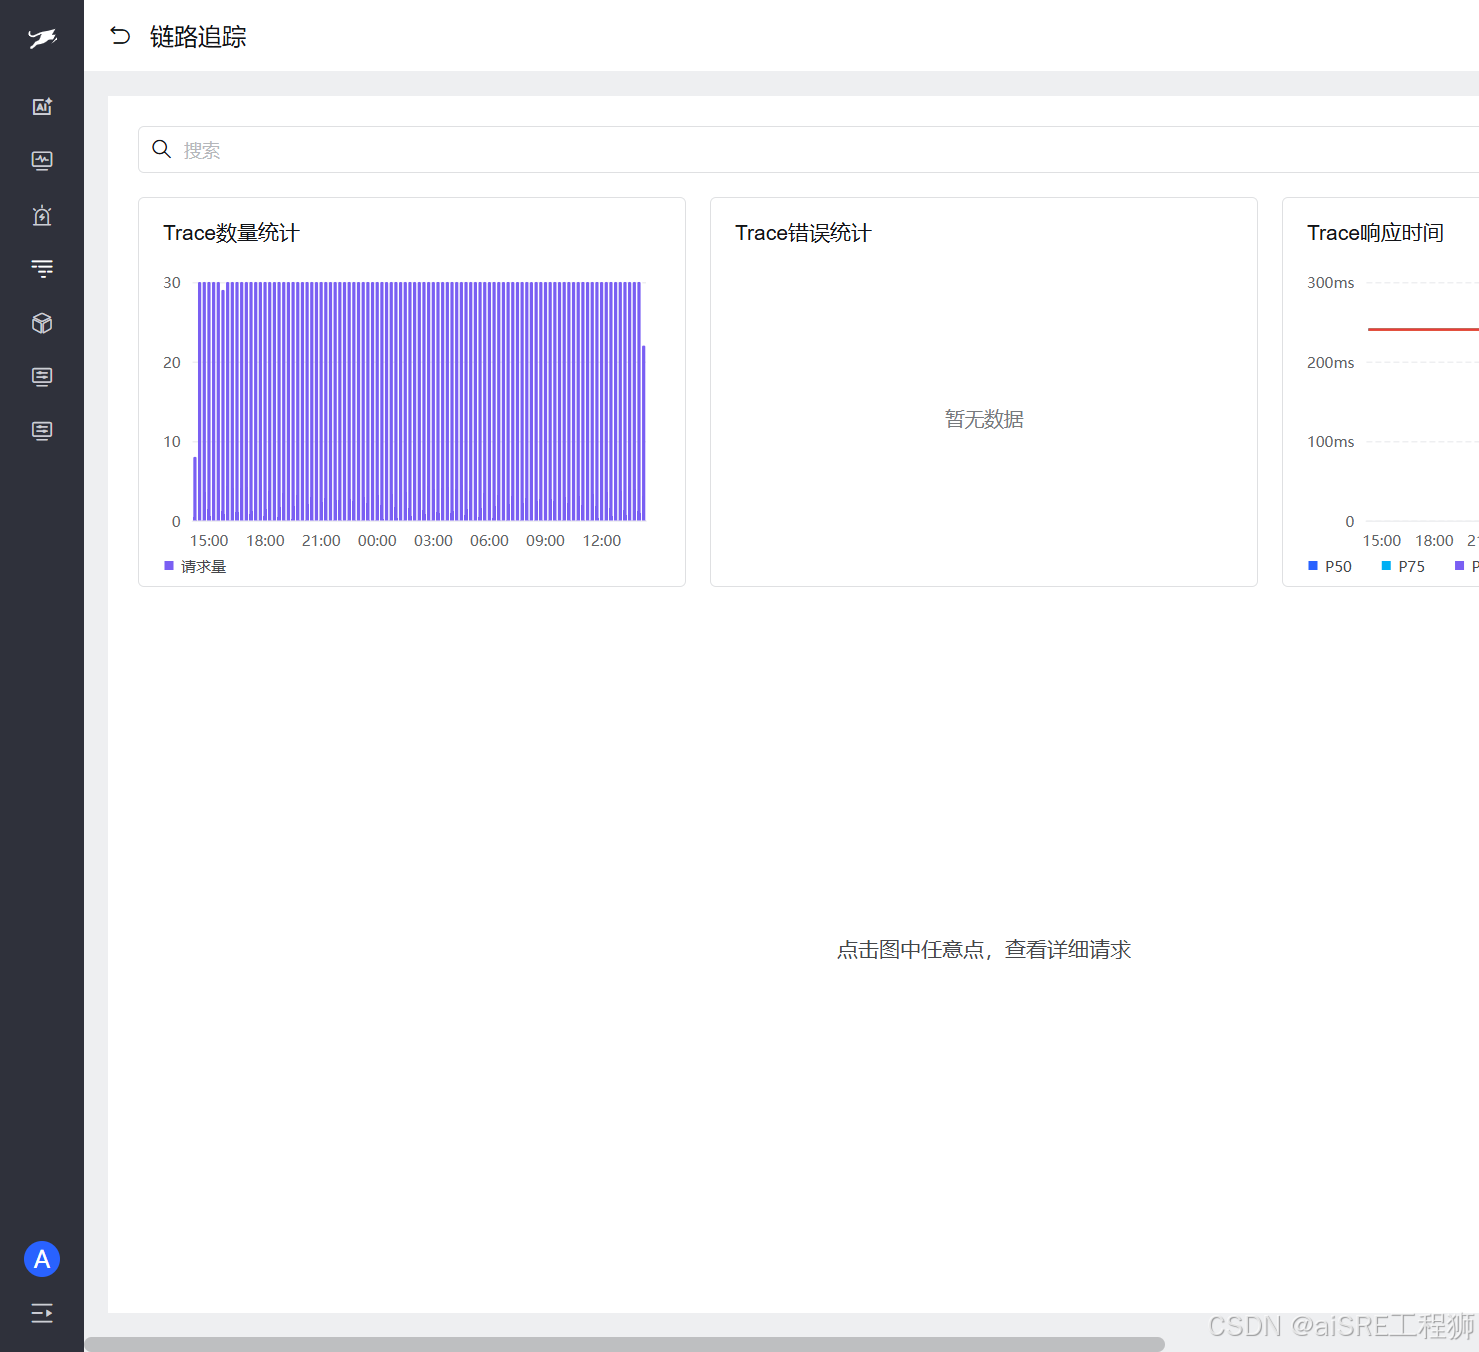
Figure 2 · Trace aggregate statistics
Tracing page: Trace volume bars (~30 per 15 minutes), P50–P99 latency lines (P95 stable ~240 ms). Click a bar to drill into the trace list.
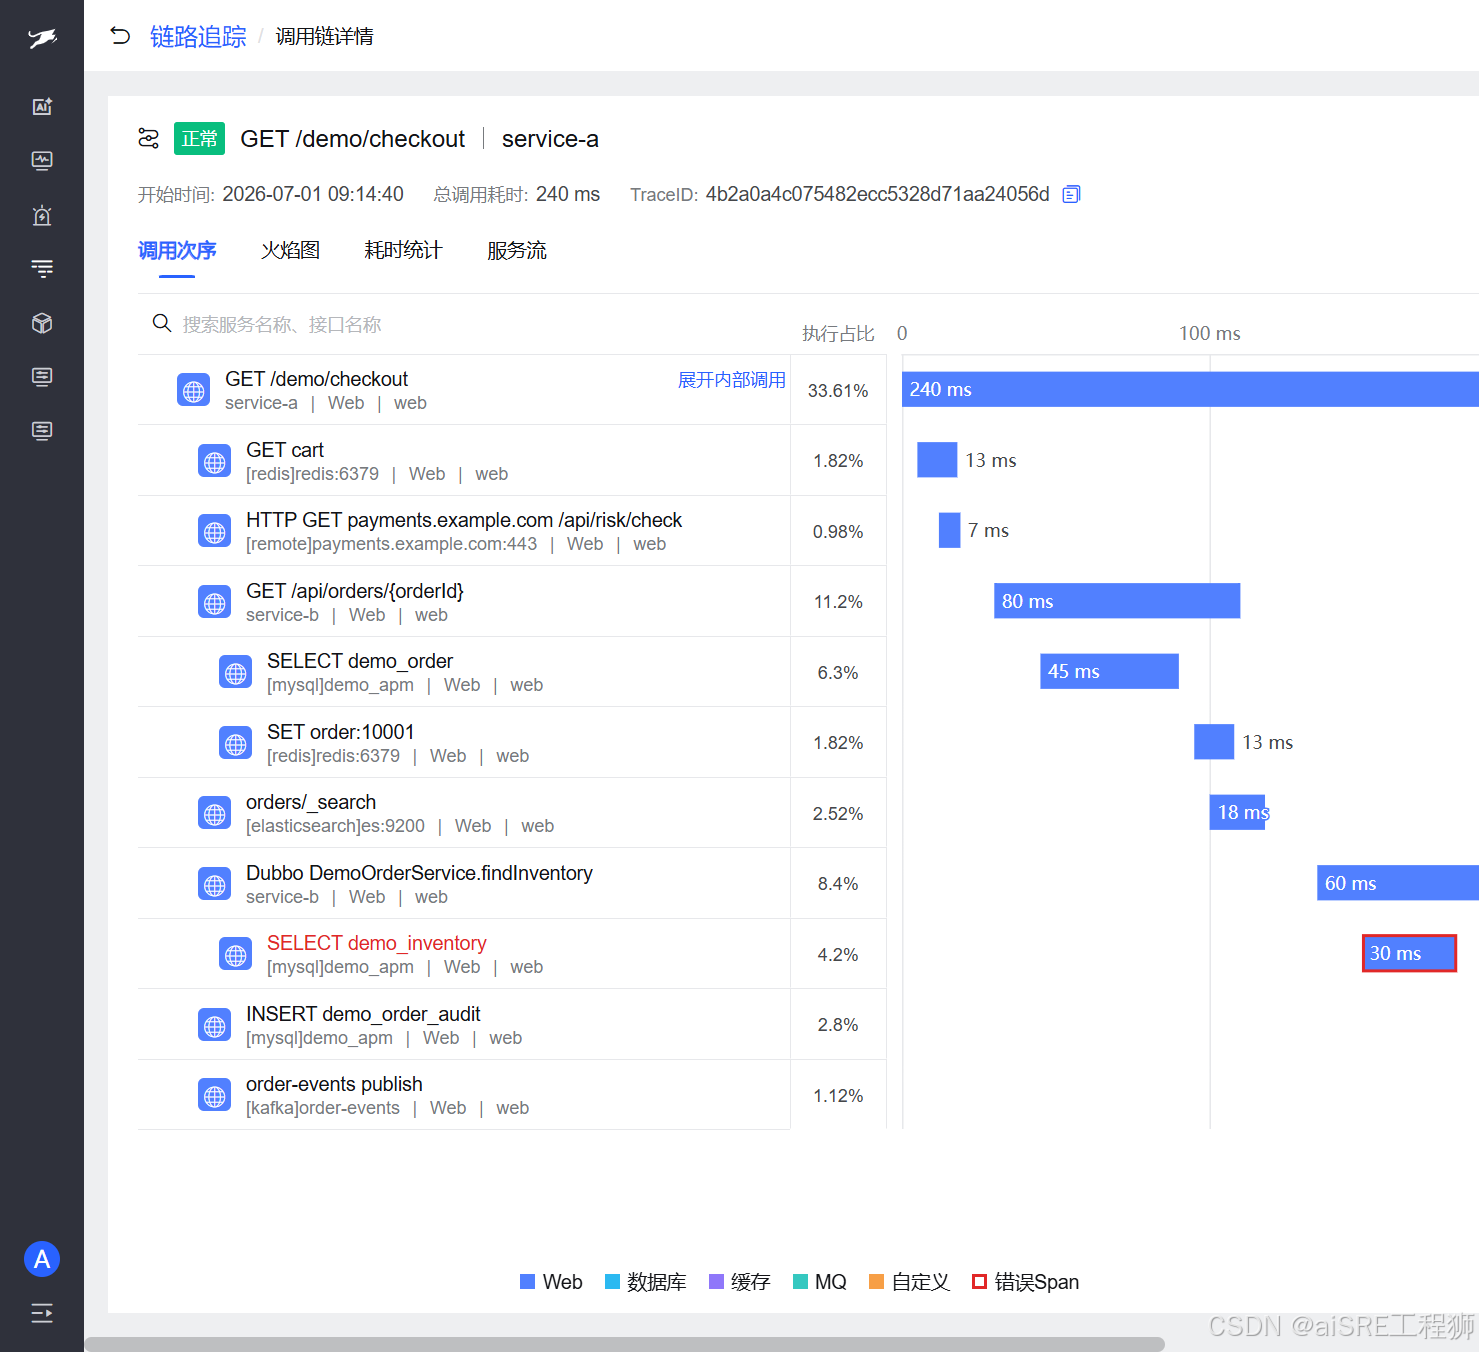
Figure 3 · Single-request span waterfall
TraceID 4b2a0a4c…, GET /demo/checkout, 240 ms total — Redis, remote HTTP fraud check, service-b Dubbo/HTTP, MySQL SELECT, ES search, Kafka publish spans expanded.
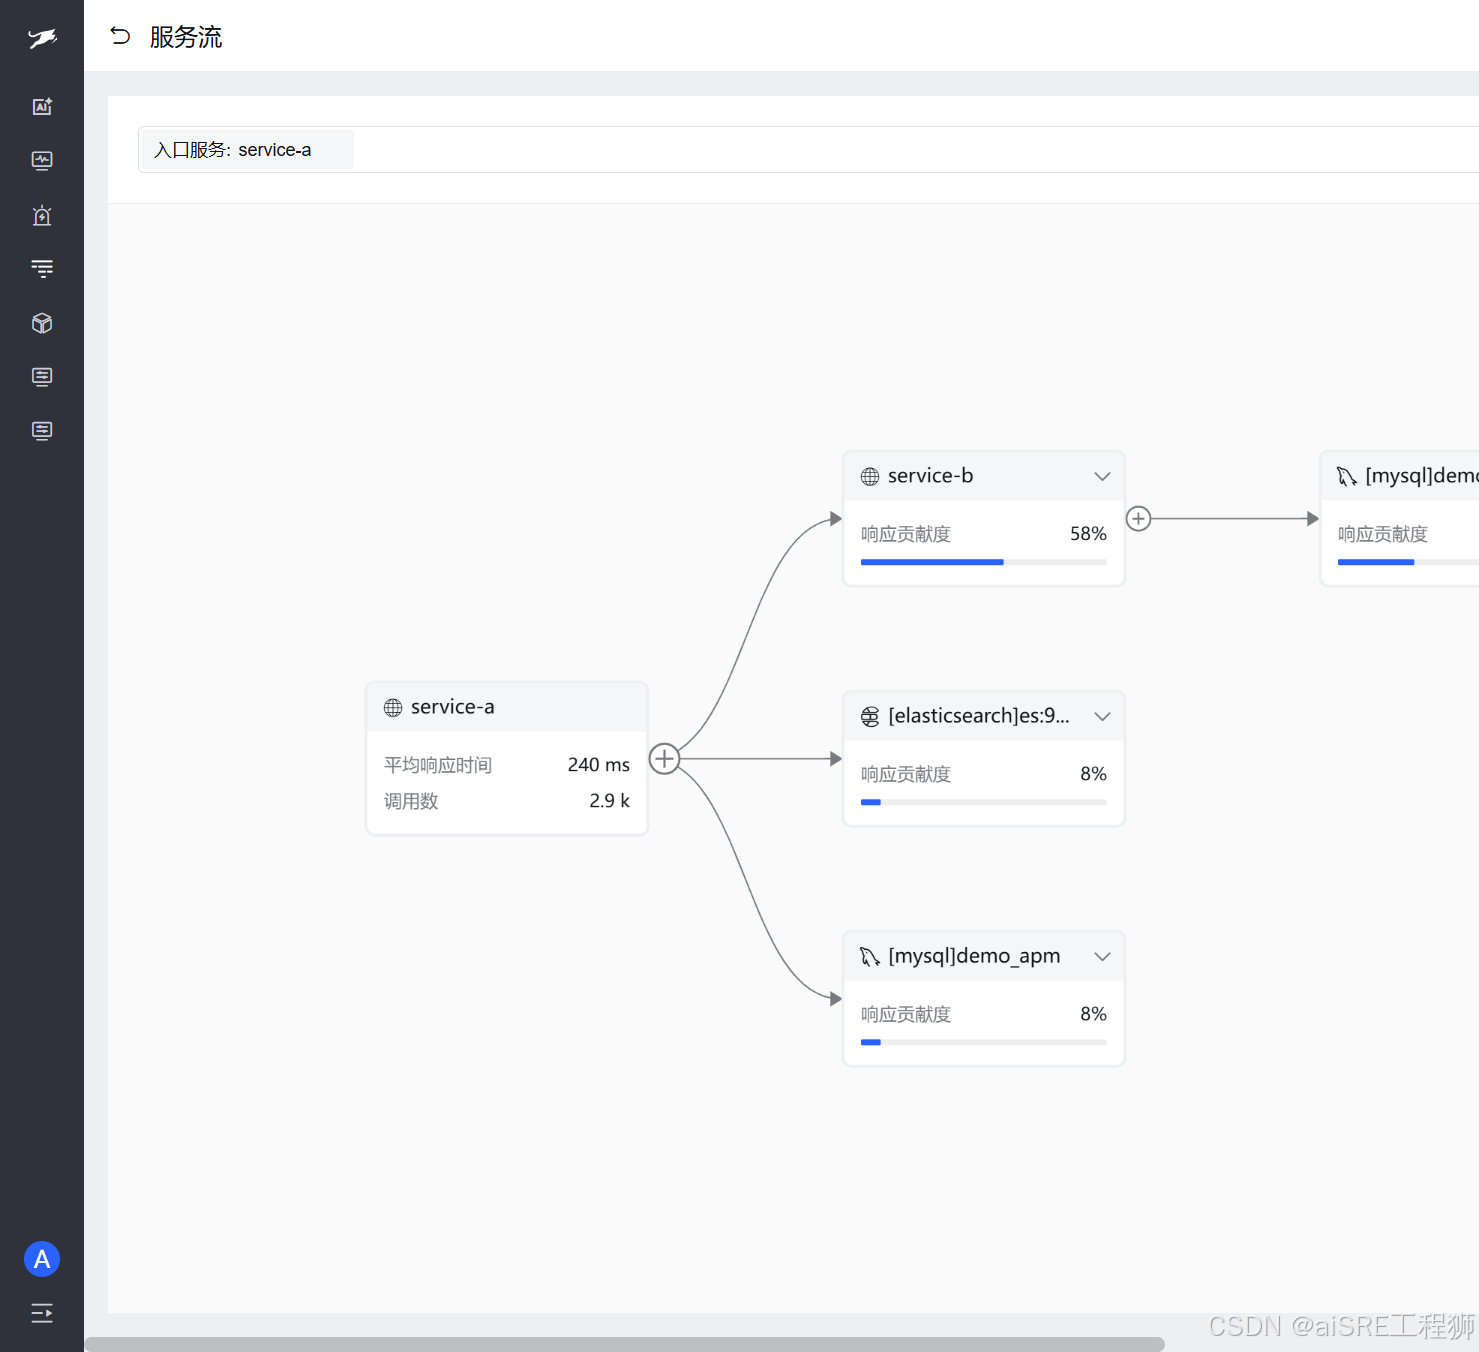
Figure 4 · Service flow and response contribution
Entry service-a (240 ms / 2.9k calls) with downstream contribution: service-b 58%, Elasticsearch and MySQL ~8% each.
◆ ◆ ◆
5Install and POC
Web console default port 27403 After ingest, validate §4 four views: topology → trace stats → waterfall → service flow
◆ ◆ ◆
6Quick selection guide
Trace only, minimal architecture → Jaeger Java microservices footprint + mature community → SkyWalking Team standardized on Grafana → LGTM OTLP-native topology/waterfall/contribution in one stack → DataBuff
◆ ◆ ◆
7References
- https://opentelemetry.io/docs/collector/configuration/
- https://opentelemetry.io/docs/specs/otlp/
- https://www.jaegertracing.io/docs/
- https://github.com/databufflabs/databuff
- https://databuff.ai/databuff/ai-apm-install.sh
◆ ◆ ◆