How to Choose an Open-Source Observability Platform: LGTM vs All-in-One APM
Open Source Observability · Platform Selection · APM · LGTM · OpenTelemetry
"Open-source observability" and "APM tools" are often used interchangeably. This article clarifies the Metrics / Trace / Logs pillars, compares LGTM assembly stacks, SkyWalking all-in-one APM, and DataBuff as an OpenTelemetry APM platform — using Demo global dashboard, AI Q&A (7-service list), RED metrics, and 2,880 alert records as acceptance examples.
1Observability vs APM
APM (Application Performance Monitoring) focuses on application services: latency, call chains, errors, and topology. An observability platform covers more: hosts, containers, middleware, logs, and alert dashboards[1].
In one line: APM is a core subset of observability; modern open-source observability platforms usually include APM, but go beyond it.
◆ ◆ ◆
2Major Open-Source Observability Platforms
| Platform / Stack | Three Pillars | Notes |
|---|---|---|
| Prometheus + Grafana + Loki + Tempo (LGTM) | M + T + L | K8s default; dashboards are DIY |
| SkyWalking | M + T (+ Log extension) | Mature community APM, strong Chinese docs |
| Jaeger + Prometheus | T + M | Lightweight; logs need another tool |
| HertzBeat | Host + APM + alerts | Out of the box, low-code |
| DataBuff | M + T + AI Q&A + alerts | Open-source OTel APM + AI Native + MCP |
◆ ◆ ◆
3Selection Dimensions
Team size: Smaller teams prefer all-in-one APM over LGTM assembly overhead OTel strategy: OpenTelemetry is the de facto standard — platforms should be OTLP-native AI troubleshooting: Need conversational Trace/metrics lookup? DataBuff smart Q&A is a differentiator Operations: Component count (OAP+ES vs Ingest+Doris+Web)
◆ ◆ ◆
4Demo Acceptance: Four Observability Capabilities
Screenshots below are from the public DataBuff Demo — dashboard → AI → APM → alerts.
Figure 1 · Cross-Component Health Dashboard
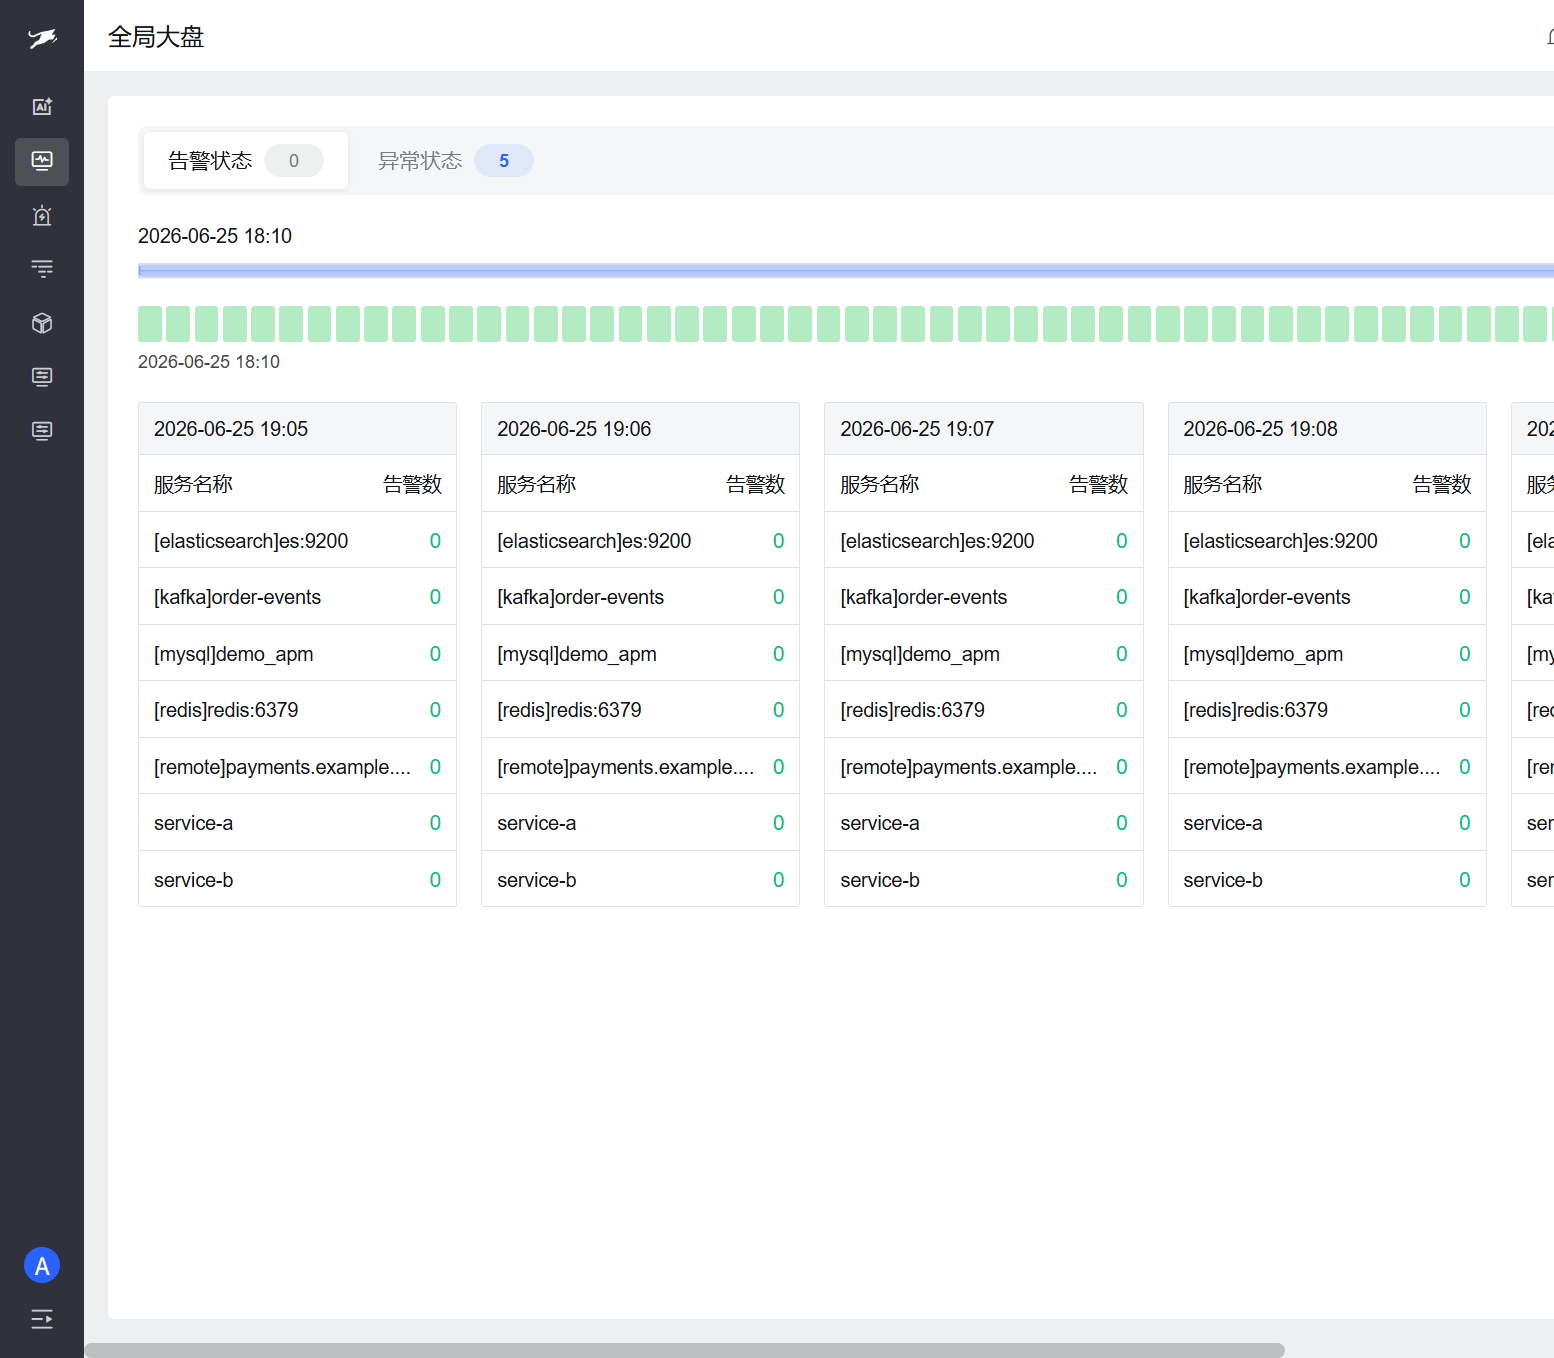
Figure 1 · Cross-component health dashboard — Global dashboard shows 24h health timelines and per-minute alert counts for 7 objects (ES, Kafka, MySQL, Redis, service-a/b, remote payment). Summary: 5 abnormal states, 0 active alerts. Validates converging app + middleware alerts into one cockpit instead of scattered Grafana dashboards.
Figure 2 · AI Smart Q&A (Real Data)
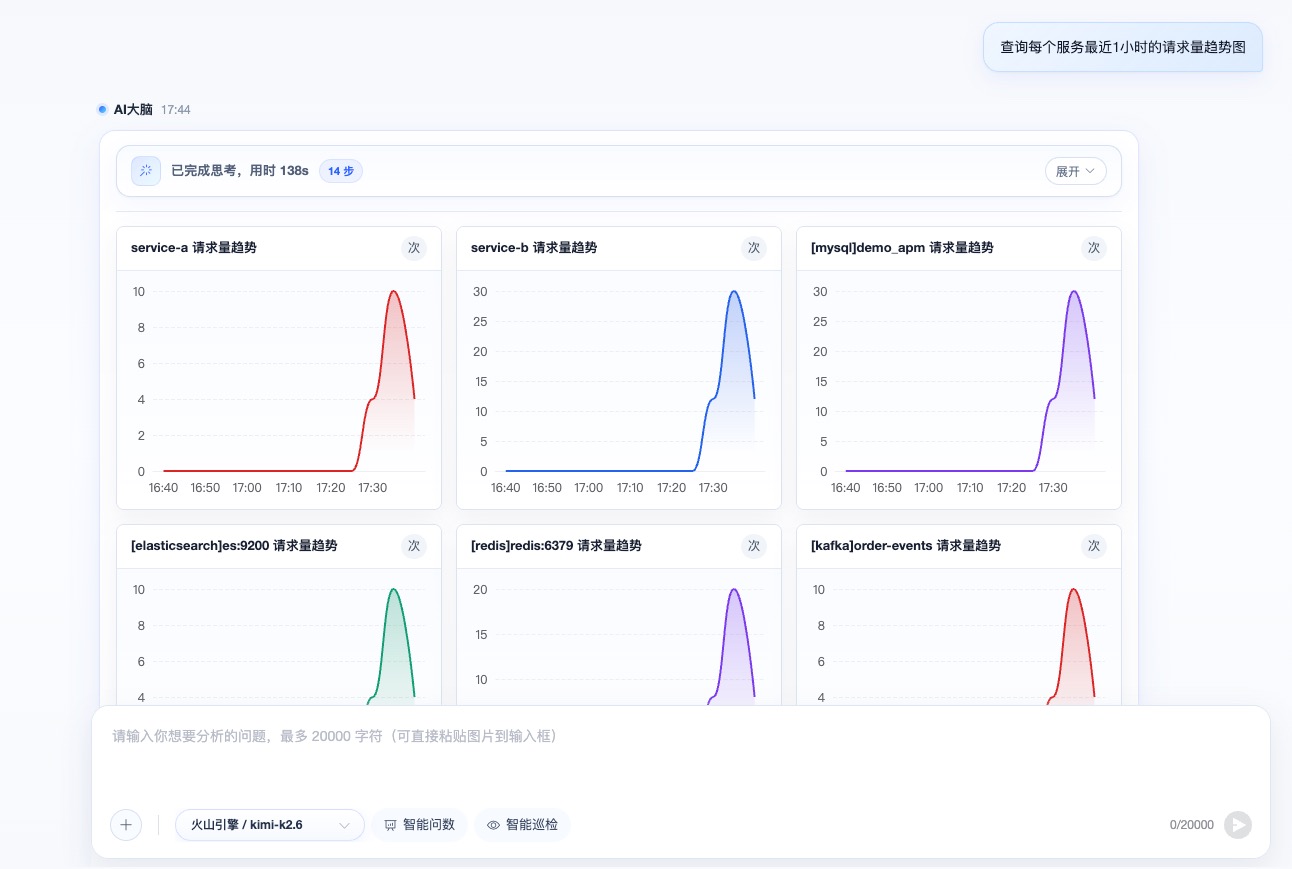
Figure 2 · AI smart Q&A on real data — After asking "list services in the last hour", the AI brain runs 10 reasoning steps and returns a structured table of 7 services: service-a/b (Web), MySQL, ES, Redis, Kafka, remote HTTP, plus a natural-language summary. Answers come from real Trace/metrics queries — not an empty chat shell. Key acceptance point for DataBuff as an AI Native observability platform.
Figure 3 · Core APM RED Metrics
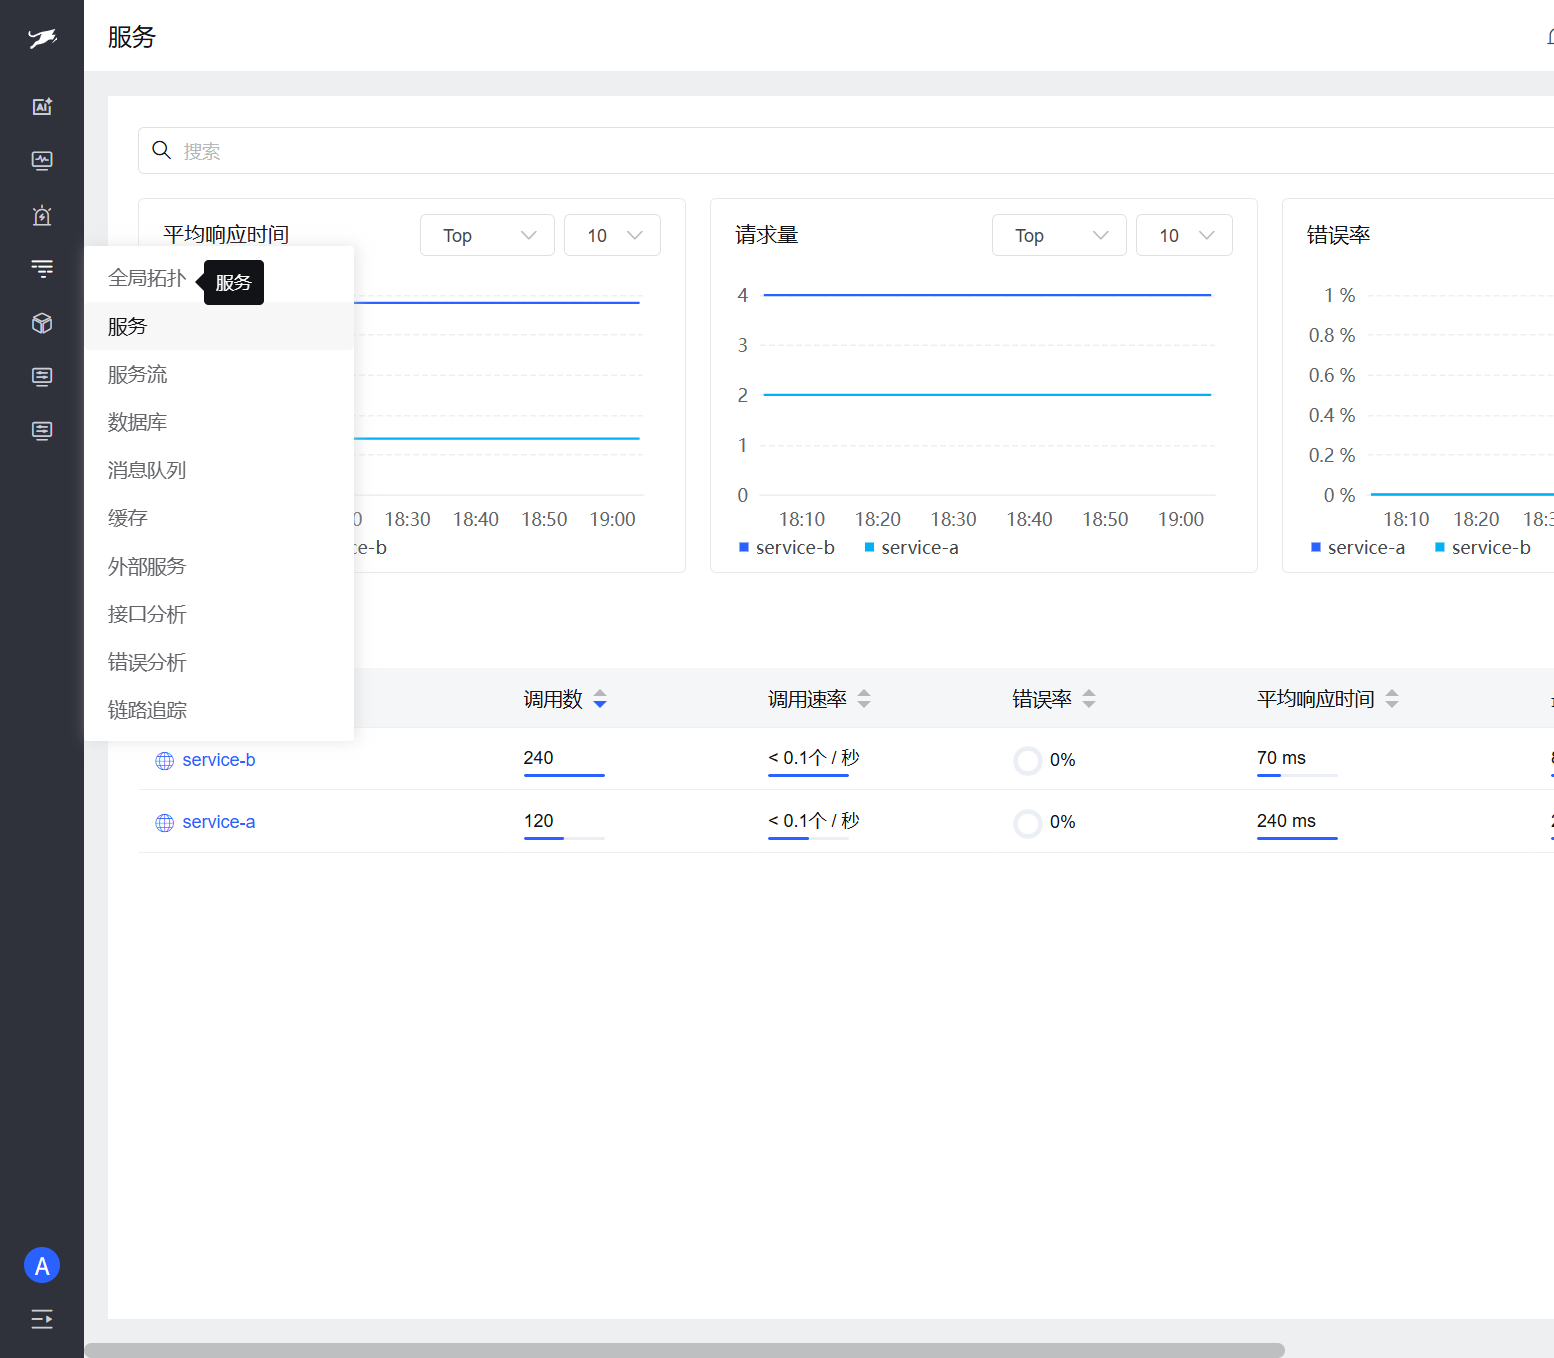
Figure 3 · Core APM RED metrics — Service list shows Rate (service-b 5.8k / service-a 2.9k calls), Errors (0% both), Duration (70 ms vs 240 ms), and 24h trend lines. Whether you use LGTM or not, confirm service-level golden signals are available out of the box with SLO-friendly granularity (Demo uses 15-minute buckets).
Figure 4 · Alerting Loop
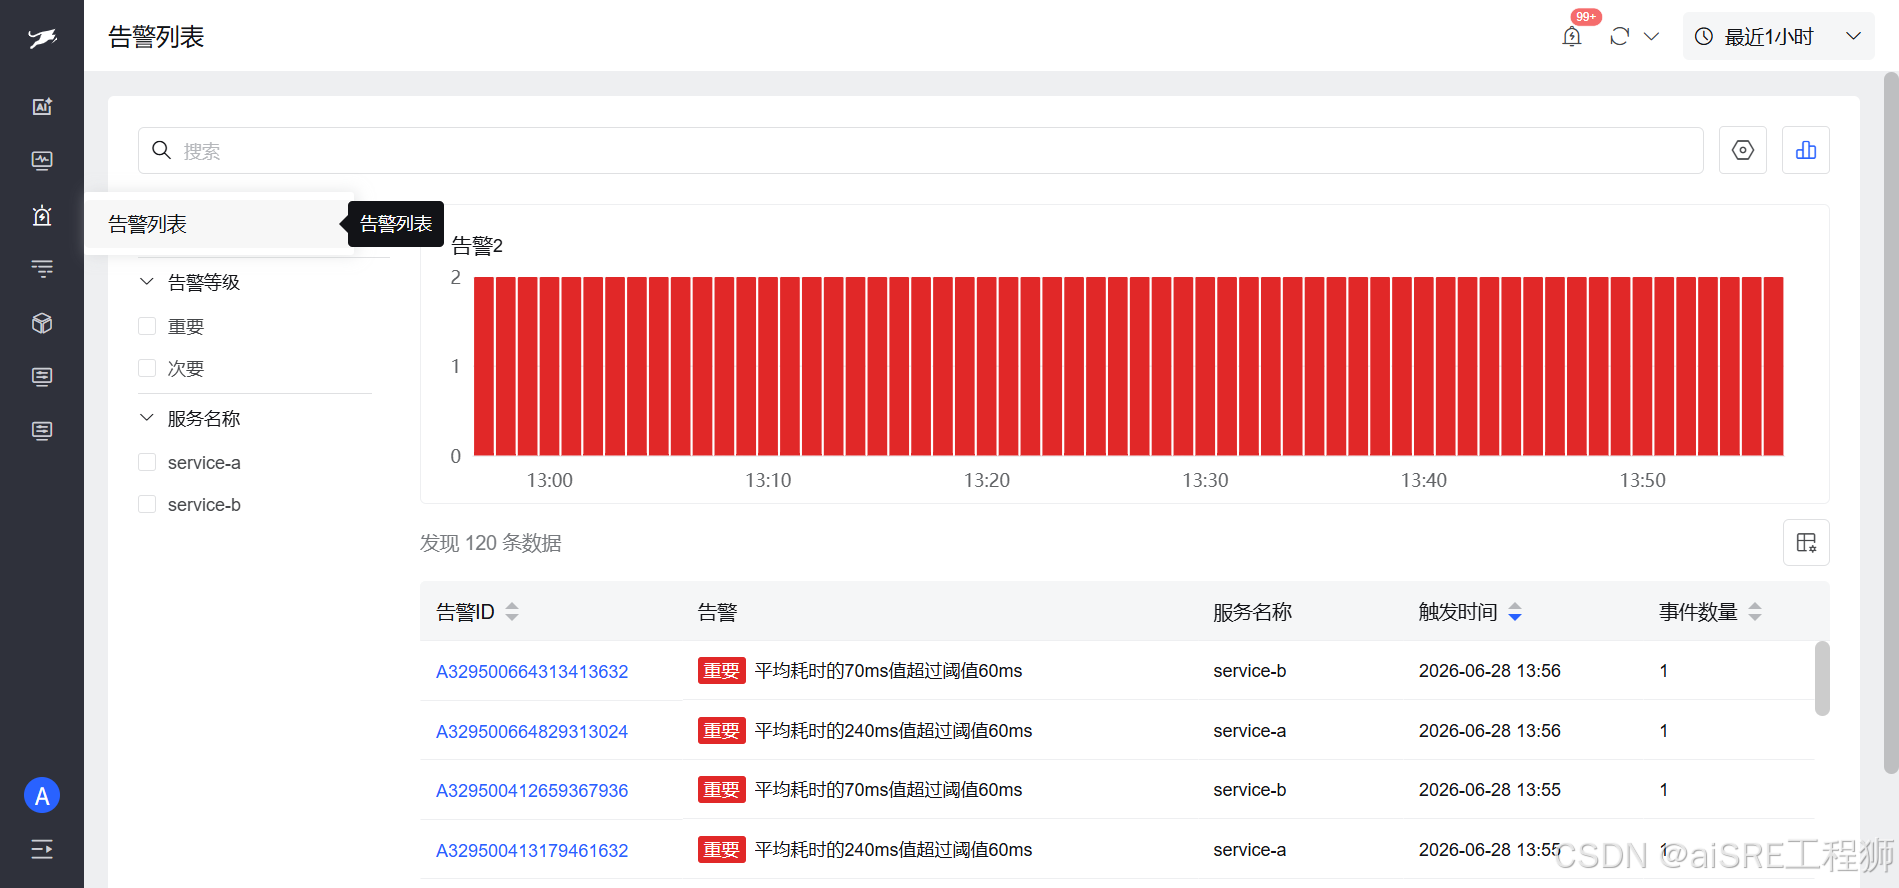
Figure 4 · Alerting loop — Alert center lists 2,880 records in the last 24h with continuous alert traffic in the bar chart. Each row has severity, description (e.g. "avg latency ~240 ms exceeds 60 ms threshold"), linked services (service-a/b), and trigger time; filter by severity and service on the left. Validates rules → trigger → search — not metrics without alerts.
◆ ◆ ◆
5Deployment Recommendations
| Team Profile | Recommendation |
|---|---|
| Mature K8s + dedicated Grafana | LGTM + Jaeger as needed |
| SkyWalking footprint, Java-heavy | Keep SkyWalking; POC OTel for new services |
| Dev-owned ops, OTel + AI | Evaluate DataBuff all-in-one |
| Minimal one-stop | HertzBeat or DataBuff one-line install |
◆ ◆ ◆
6References
[1] https://opentelemetry.io/docs/concepts/observability-primer/
[2] https://grafana.com/docs/grafana-cloud/monitor-applications/application-observability/
[3] https://skywalking.apache.org/
[4] https://github.com/databufflabs/databuff
[5] https://demo.databuff.ai/
◆ ◆ ◆