DataBuff is an AI-native APM. It ingests OpenTelemetry and SkyWalking, and ships seven AI capabilities.
GitHub: https://github.com/databufflabs/databuff
Same slow checkout: Grafana needs three systems. DataBuff finishes the path in one.
| What you check | Grafana: 3 systems / 3 separate pages | DataBuff: 1 system / 3 linked pages |
|---|---|---|
| Metric: who is slow | Grafana: Service Map | Service list |
| Trace: which hop | Tempo: trace list, waterfall | Tracing: drill down from the service page |
| Log: what happened then | Loki: query by traceId | Logs: open Trace and jump back |
On-call, whether those three sit on one path matters more than whether you have all three pillars.
The scene is service-a GET /demo/checkout getting slow. Find who is slow in Metric, then the request and span in Trace, then context in Log. In this stack the three entries are different datasources, with different filters.
Metric · ① Who is slow: metrics-generator → metrics store → Service Map
Tempo stores spans. To draw a service map, metrics-generator aggregates spans into time series, writes them to a separate metrics store, then Grafana can paint the Service Map.
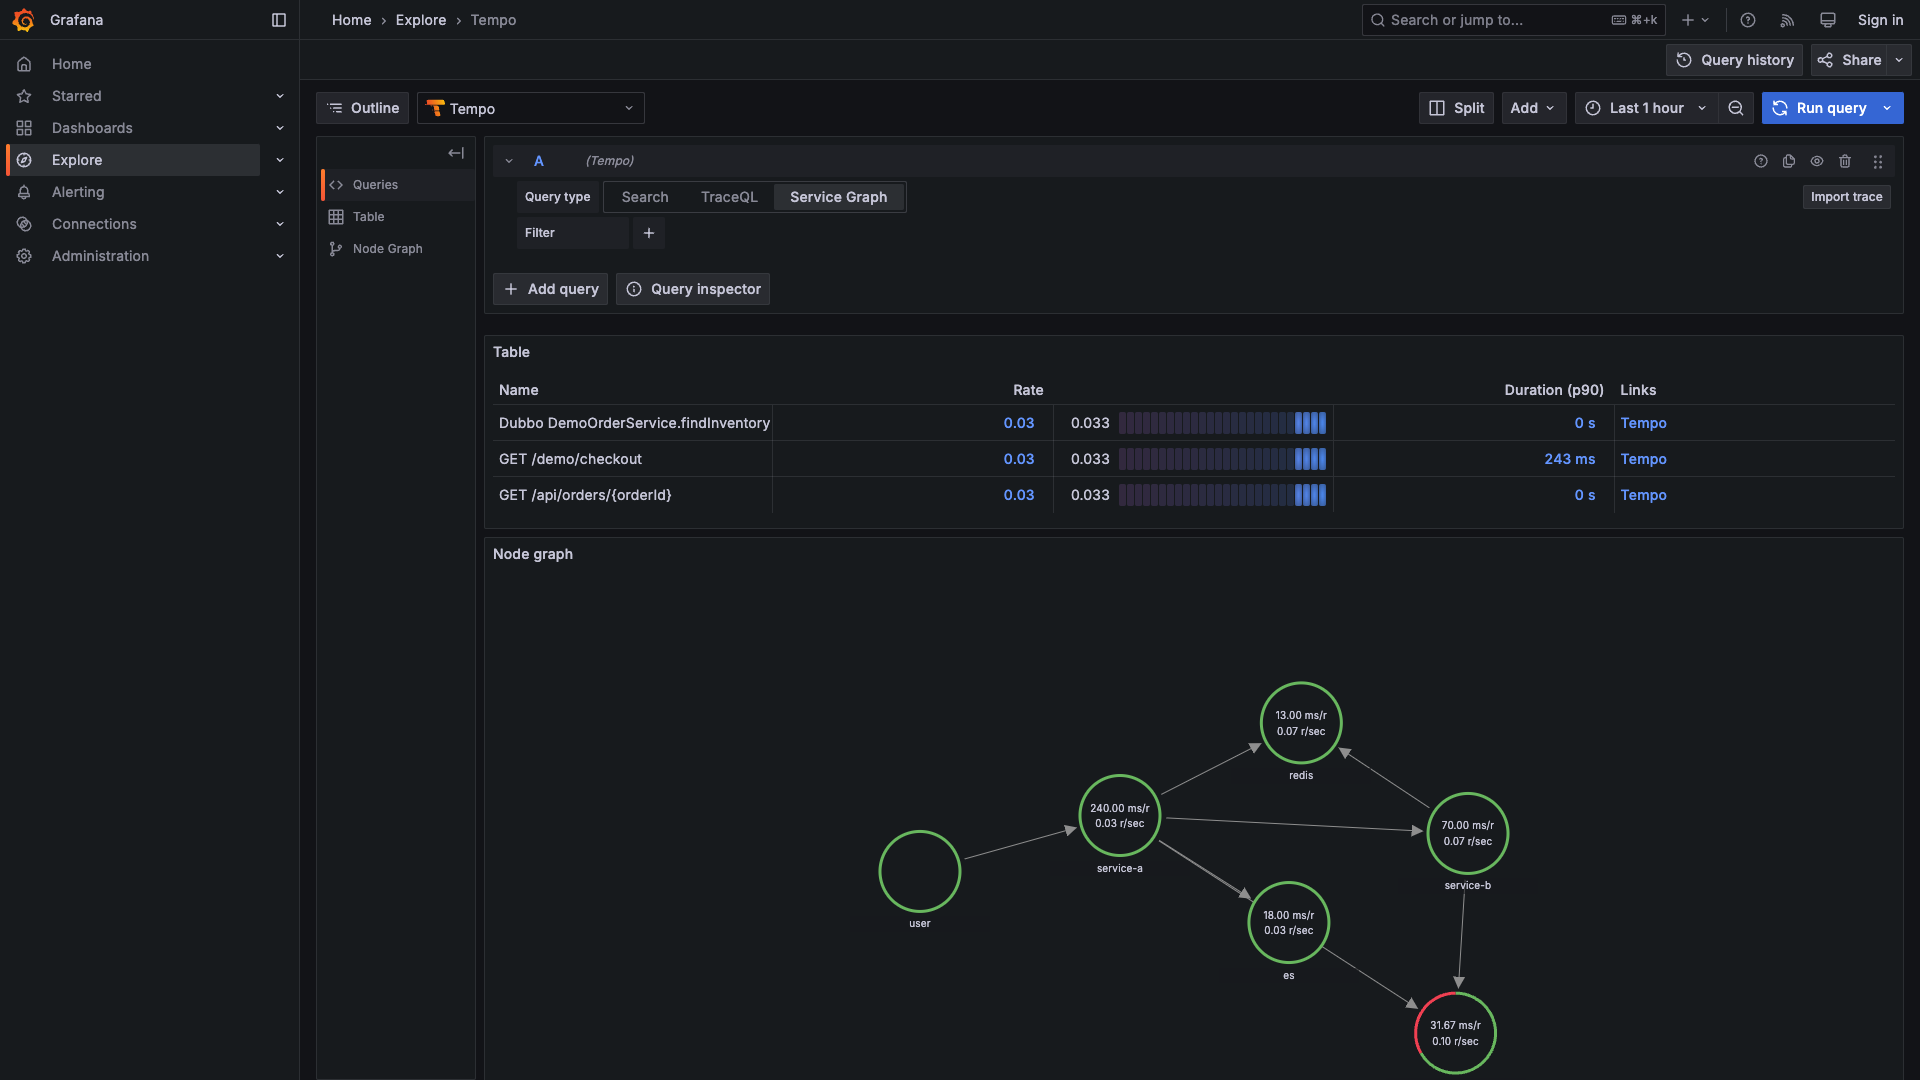
Trace · ② Find the request: Explore → Tempo, search the list
Leave Service Map, switch Explore to the Tempo datasource, filter by service / operation for the slow checkout, and copy the traceId.
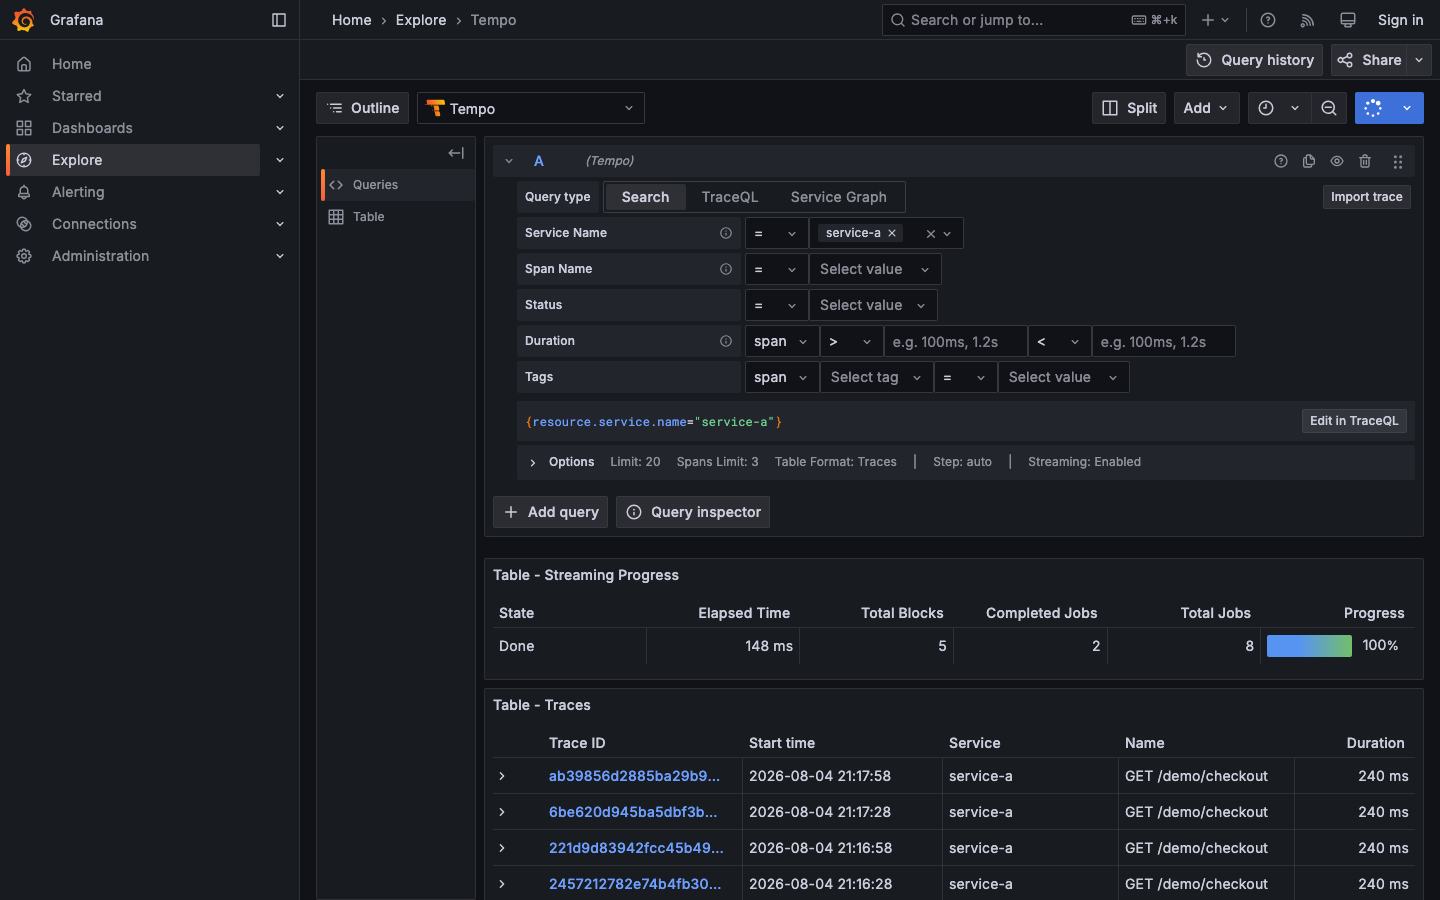
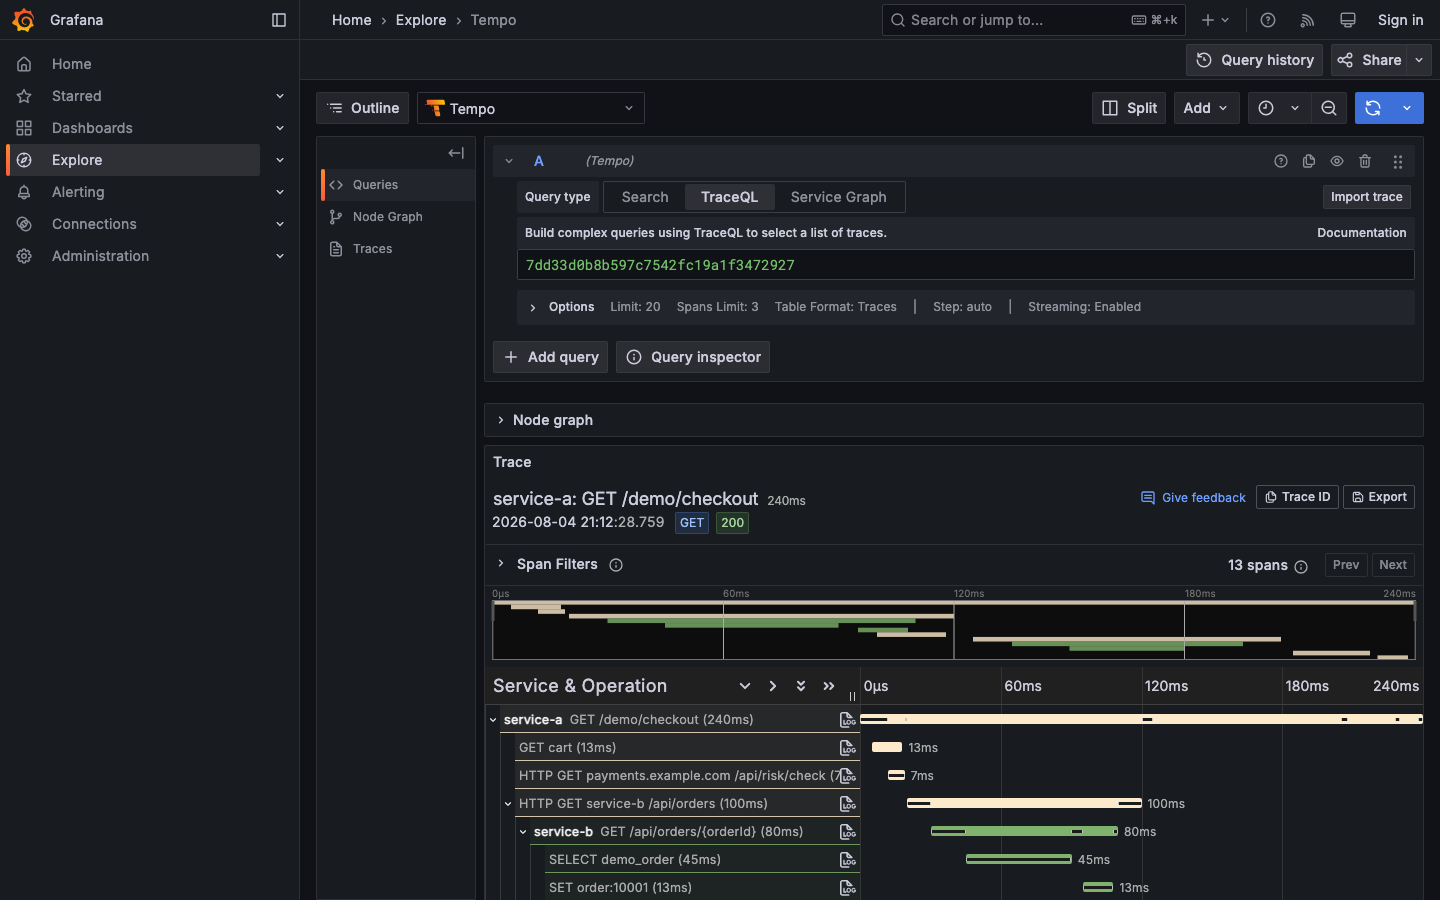
Trace · ③ Waterfall: where the time went
Open the trace. See which hop of service-a → service-b → service-c is slow. Still in Tempo. Logs not touched yet.
Log · ④ Logs: Explore → Loki, paste the traceId
Log is another line: Explore → Loki, put the traceId into LogQL. If tracesToLogs is not wired, this hop is manual.
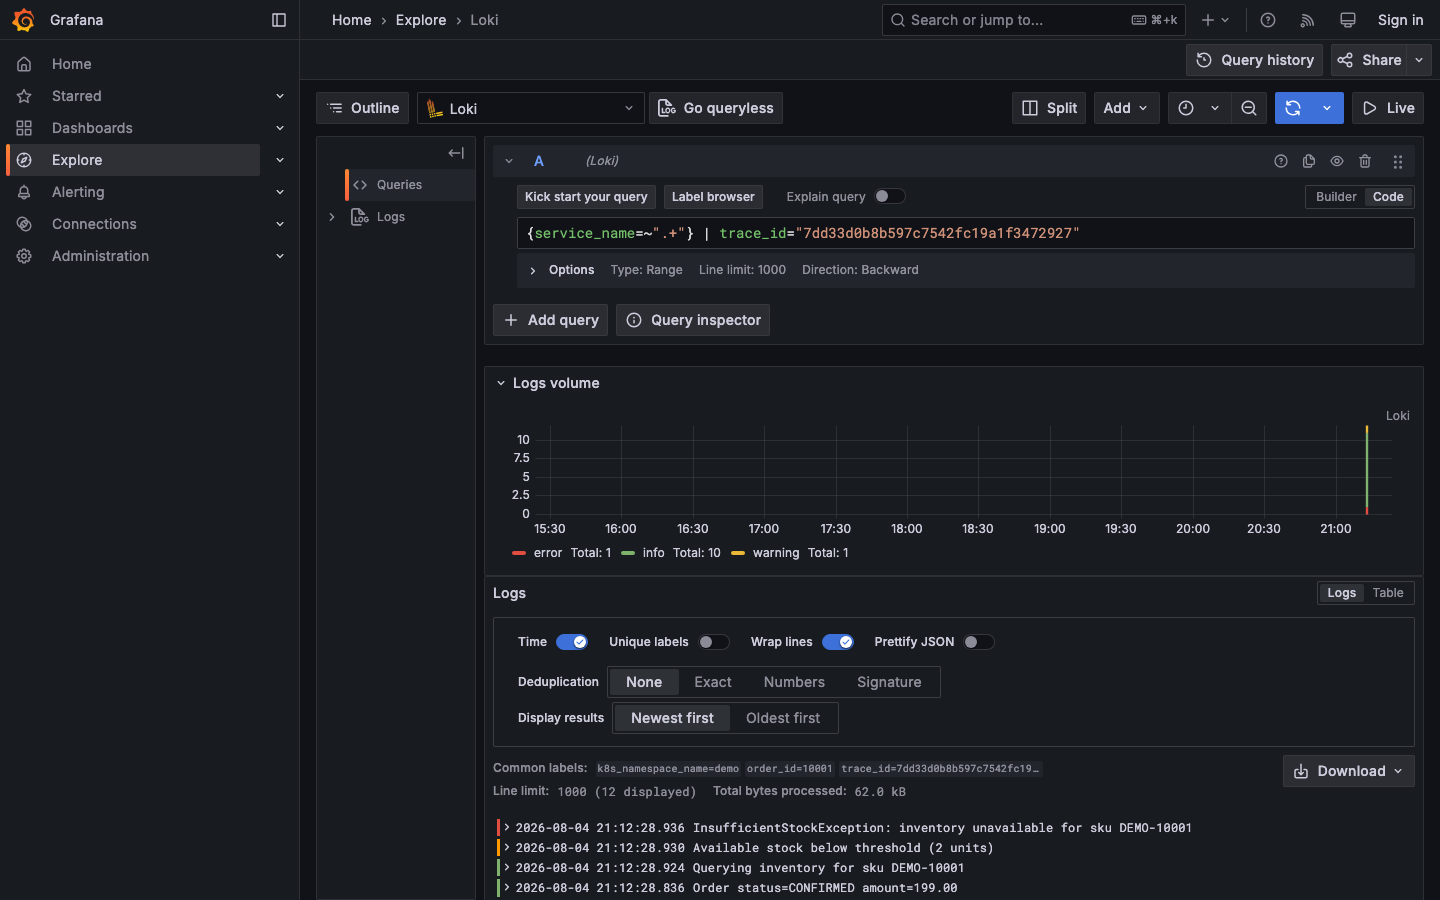
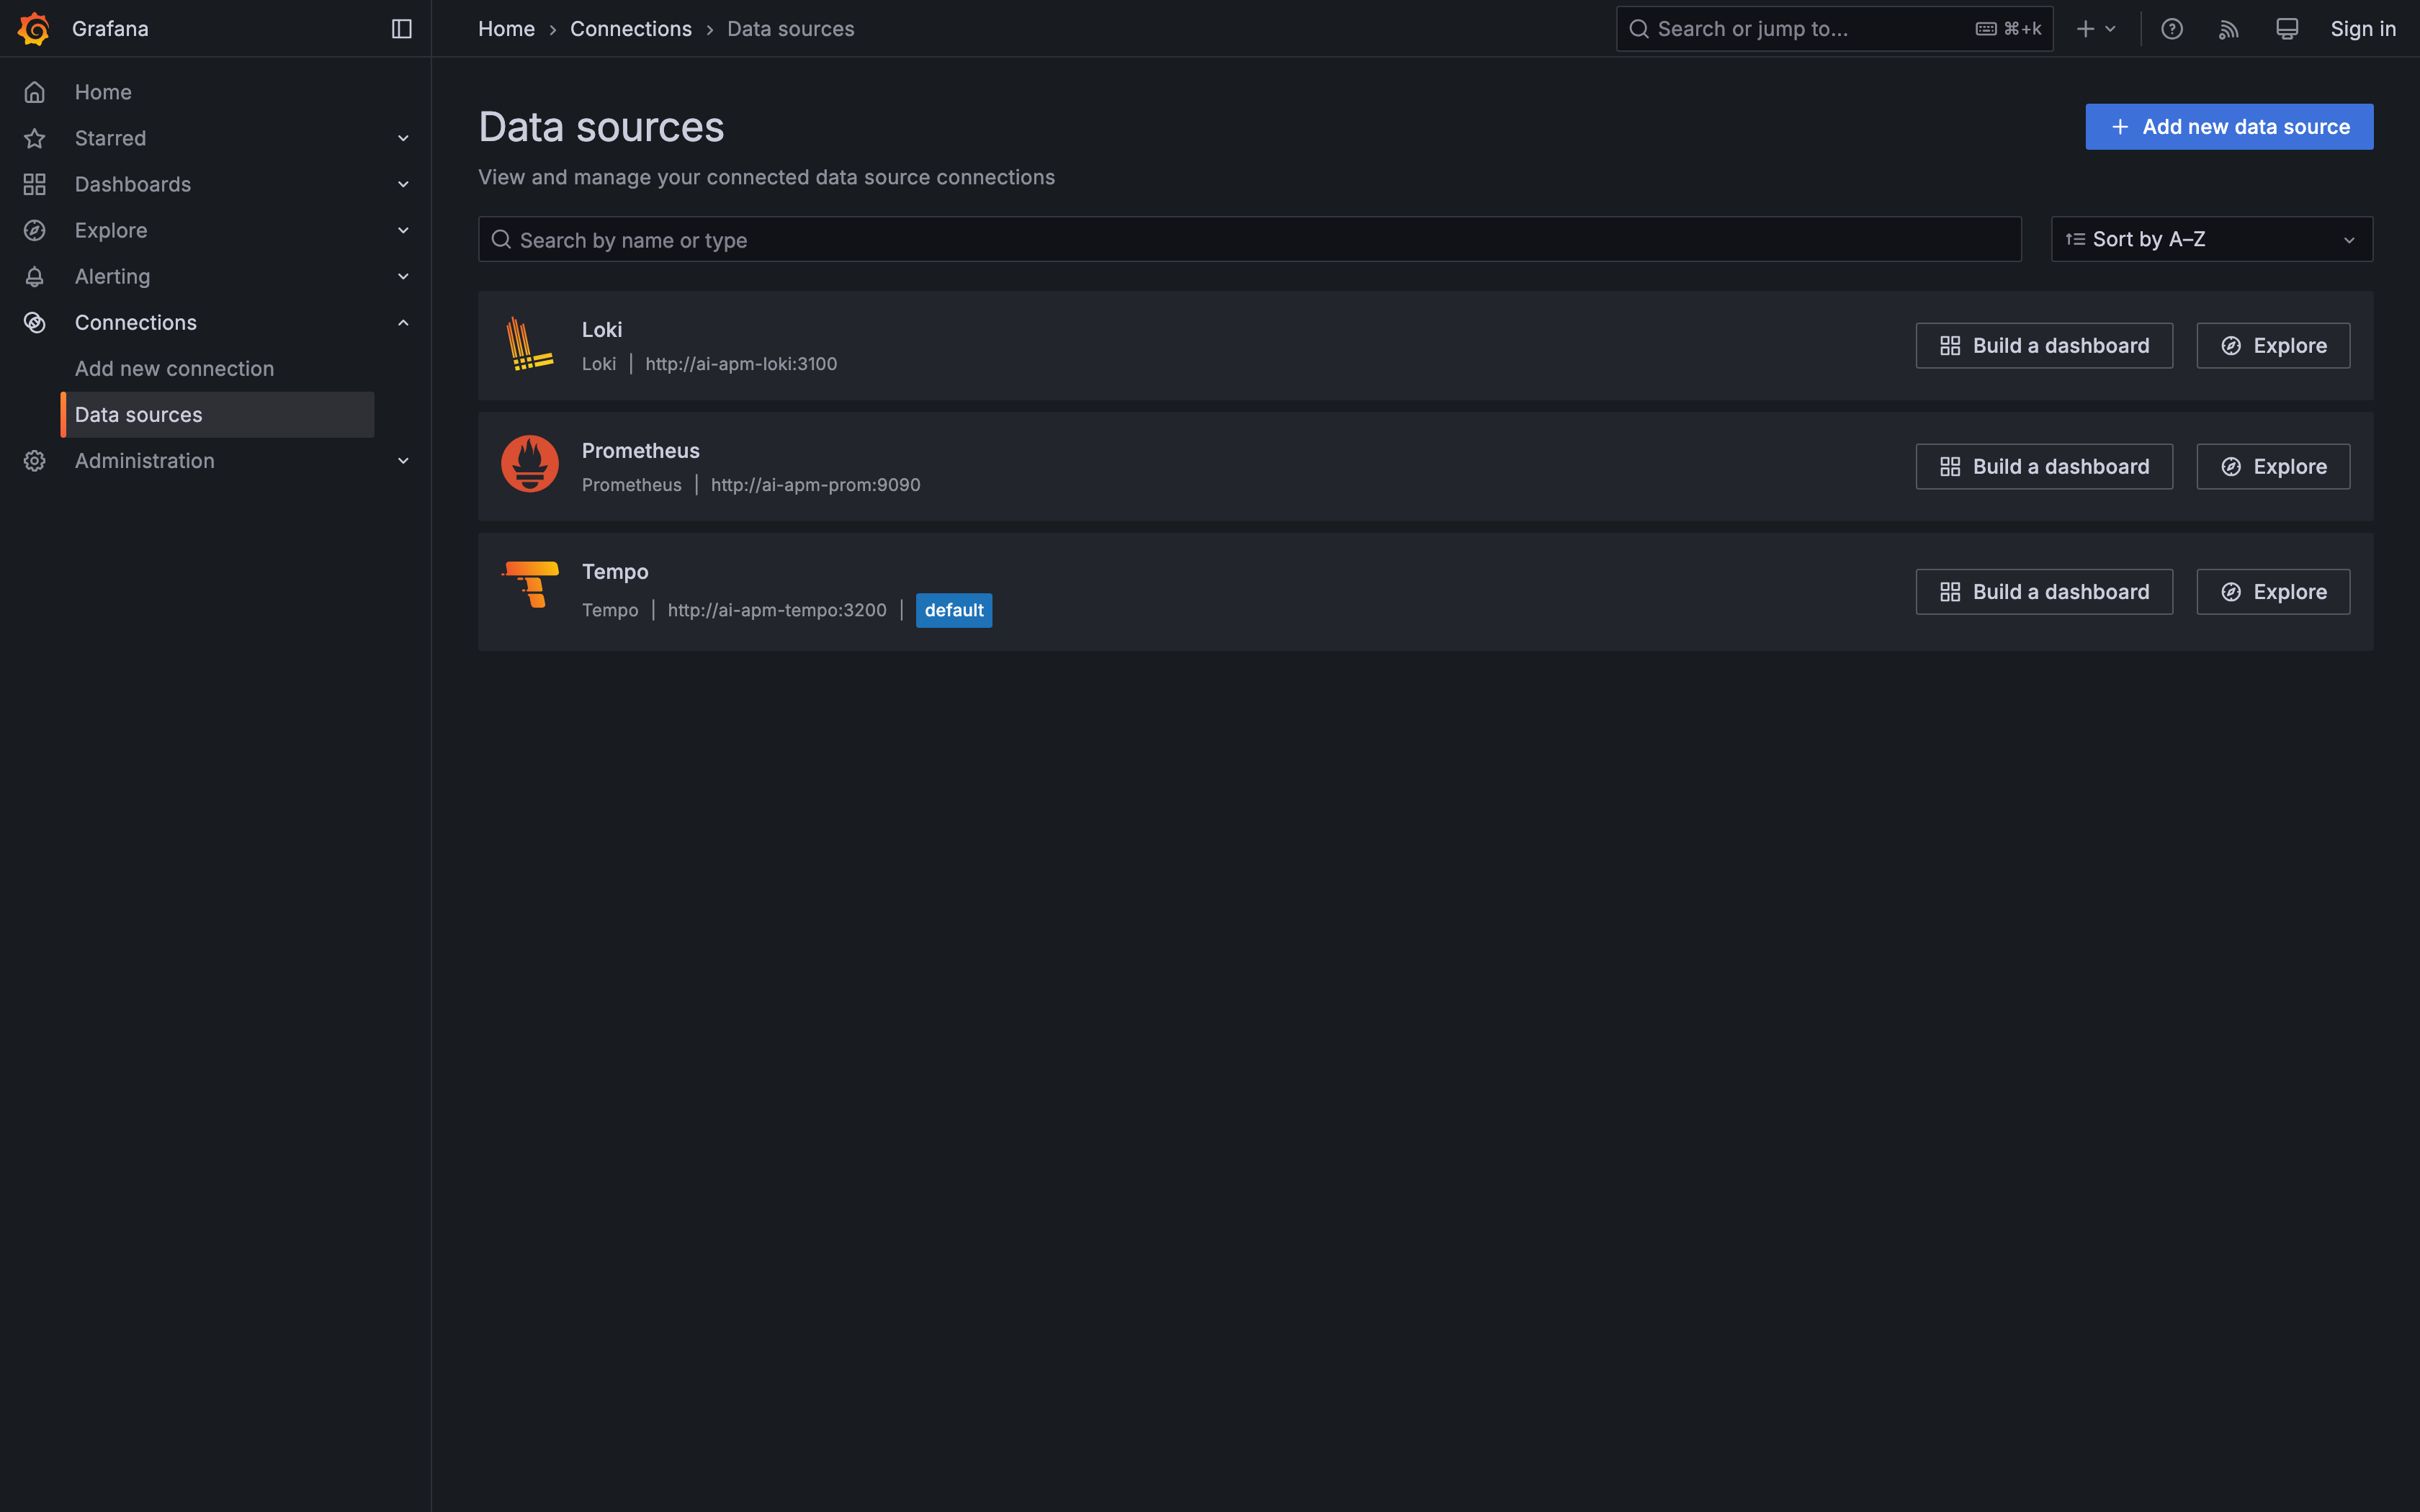
This run: four hops, and logs still needed a hand-copied traceId.
Same slow checkout. After OTLP lands in DataBuff, Metric / Trace / Log are already joined. Stay in one product. You do not paste a traceId into a new query language to open logs.
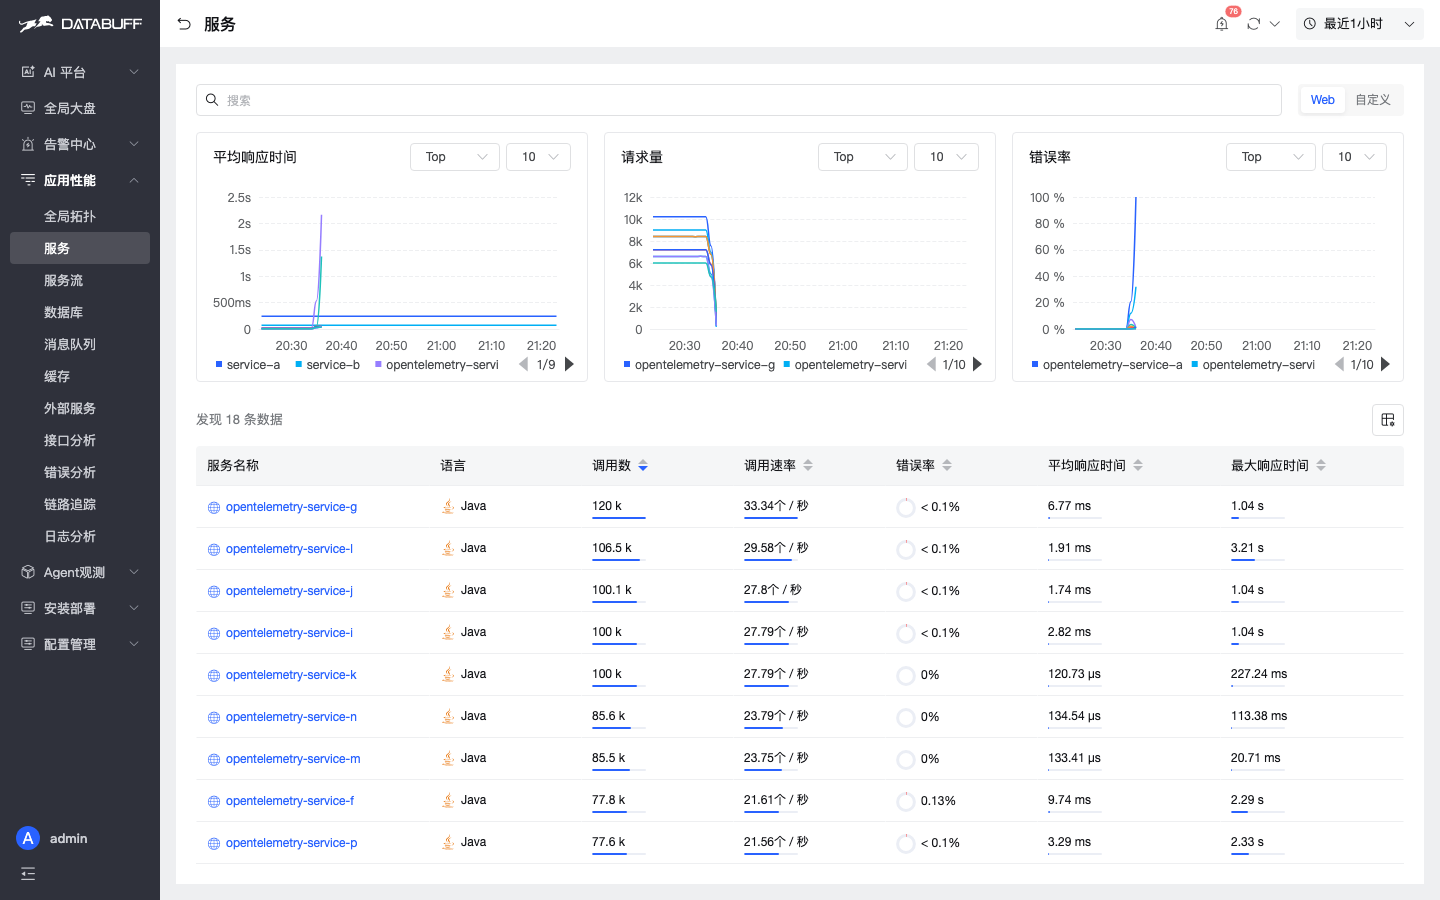
Metric · ① App performance → service list
The service list shows service-a latency, errors, and traffic. Click the name. Metrics and traces share one store — no extra extract from spans.
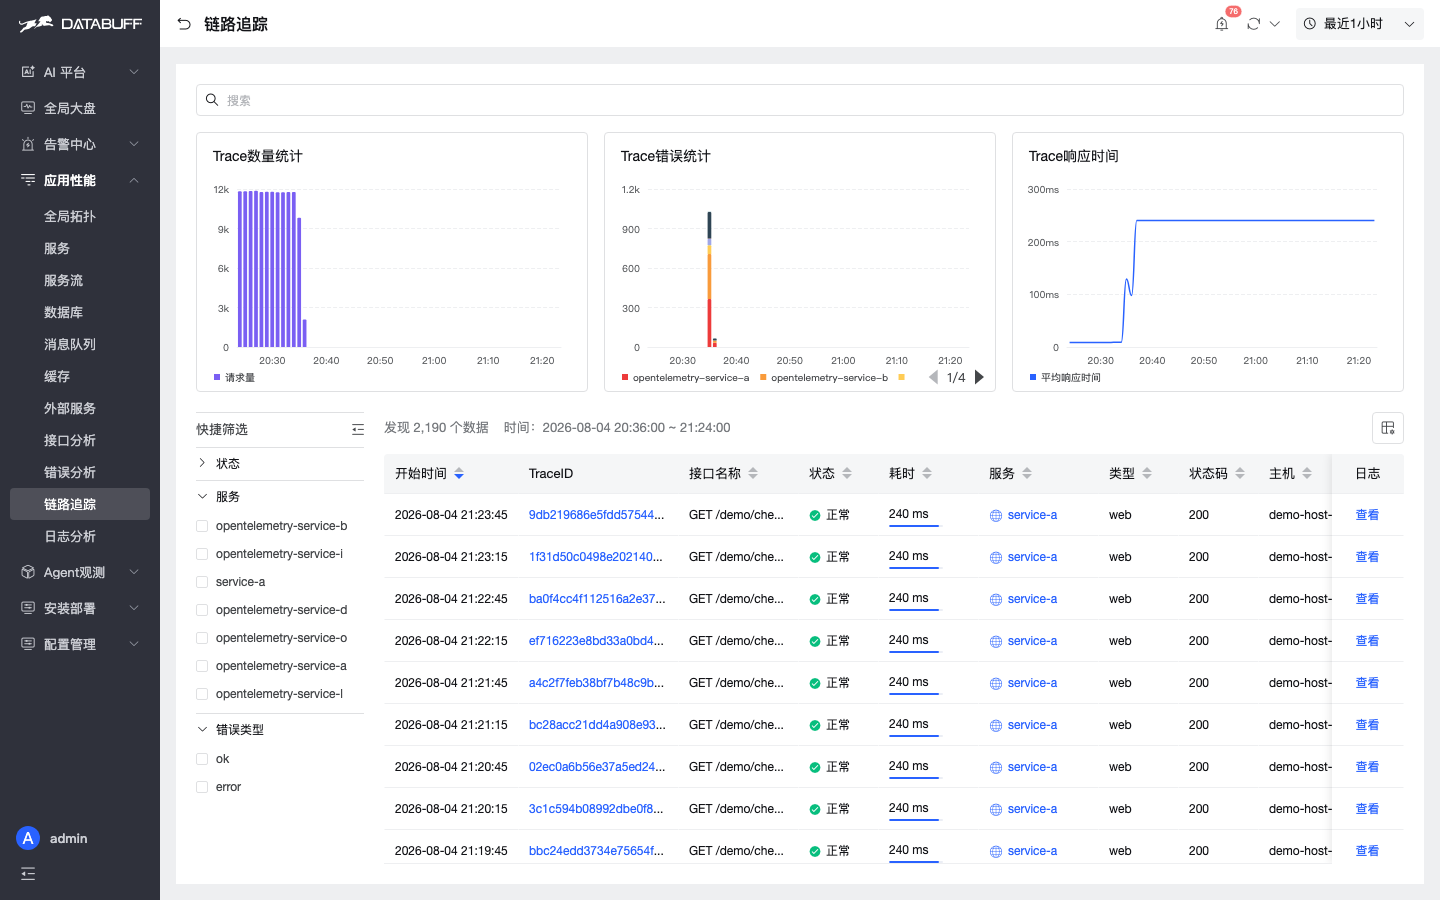
Trace · ② Tracing: open the slow waterfall
From the service page, open the 240ms checkout. Middleware spans sit on the same picture. No system switch.
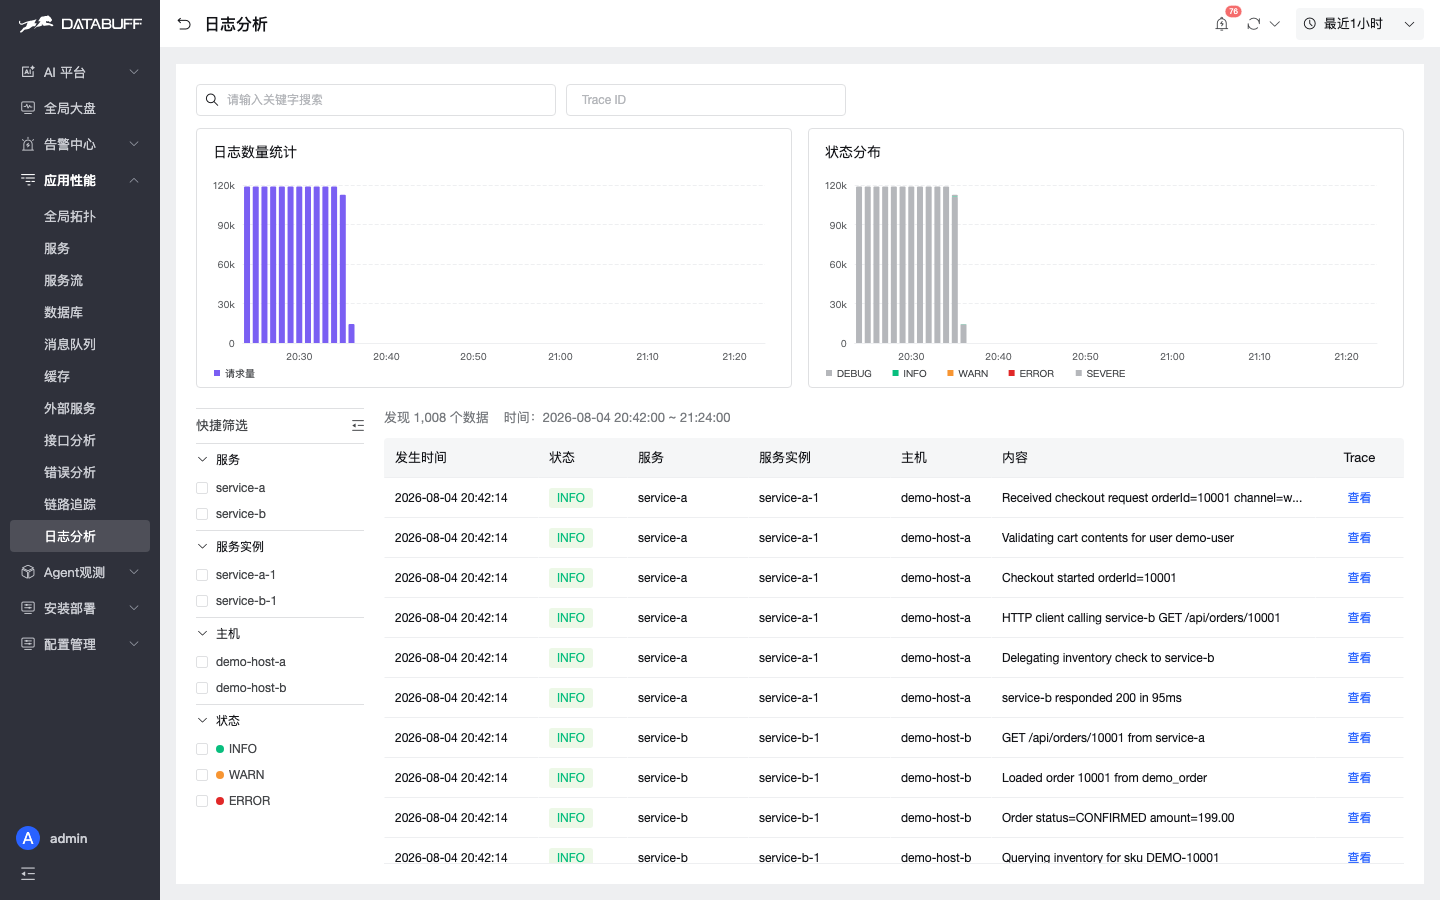
Log · ③ Logs: Trace on the row, one click back
Each log row has a Trace button. That is the on-call step you skip: copy the id, change the query.
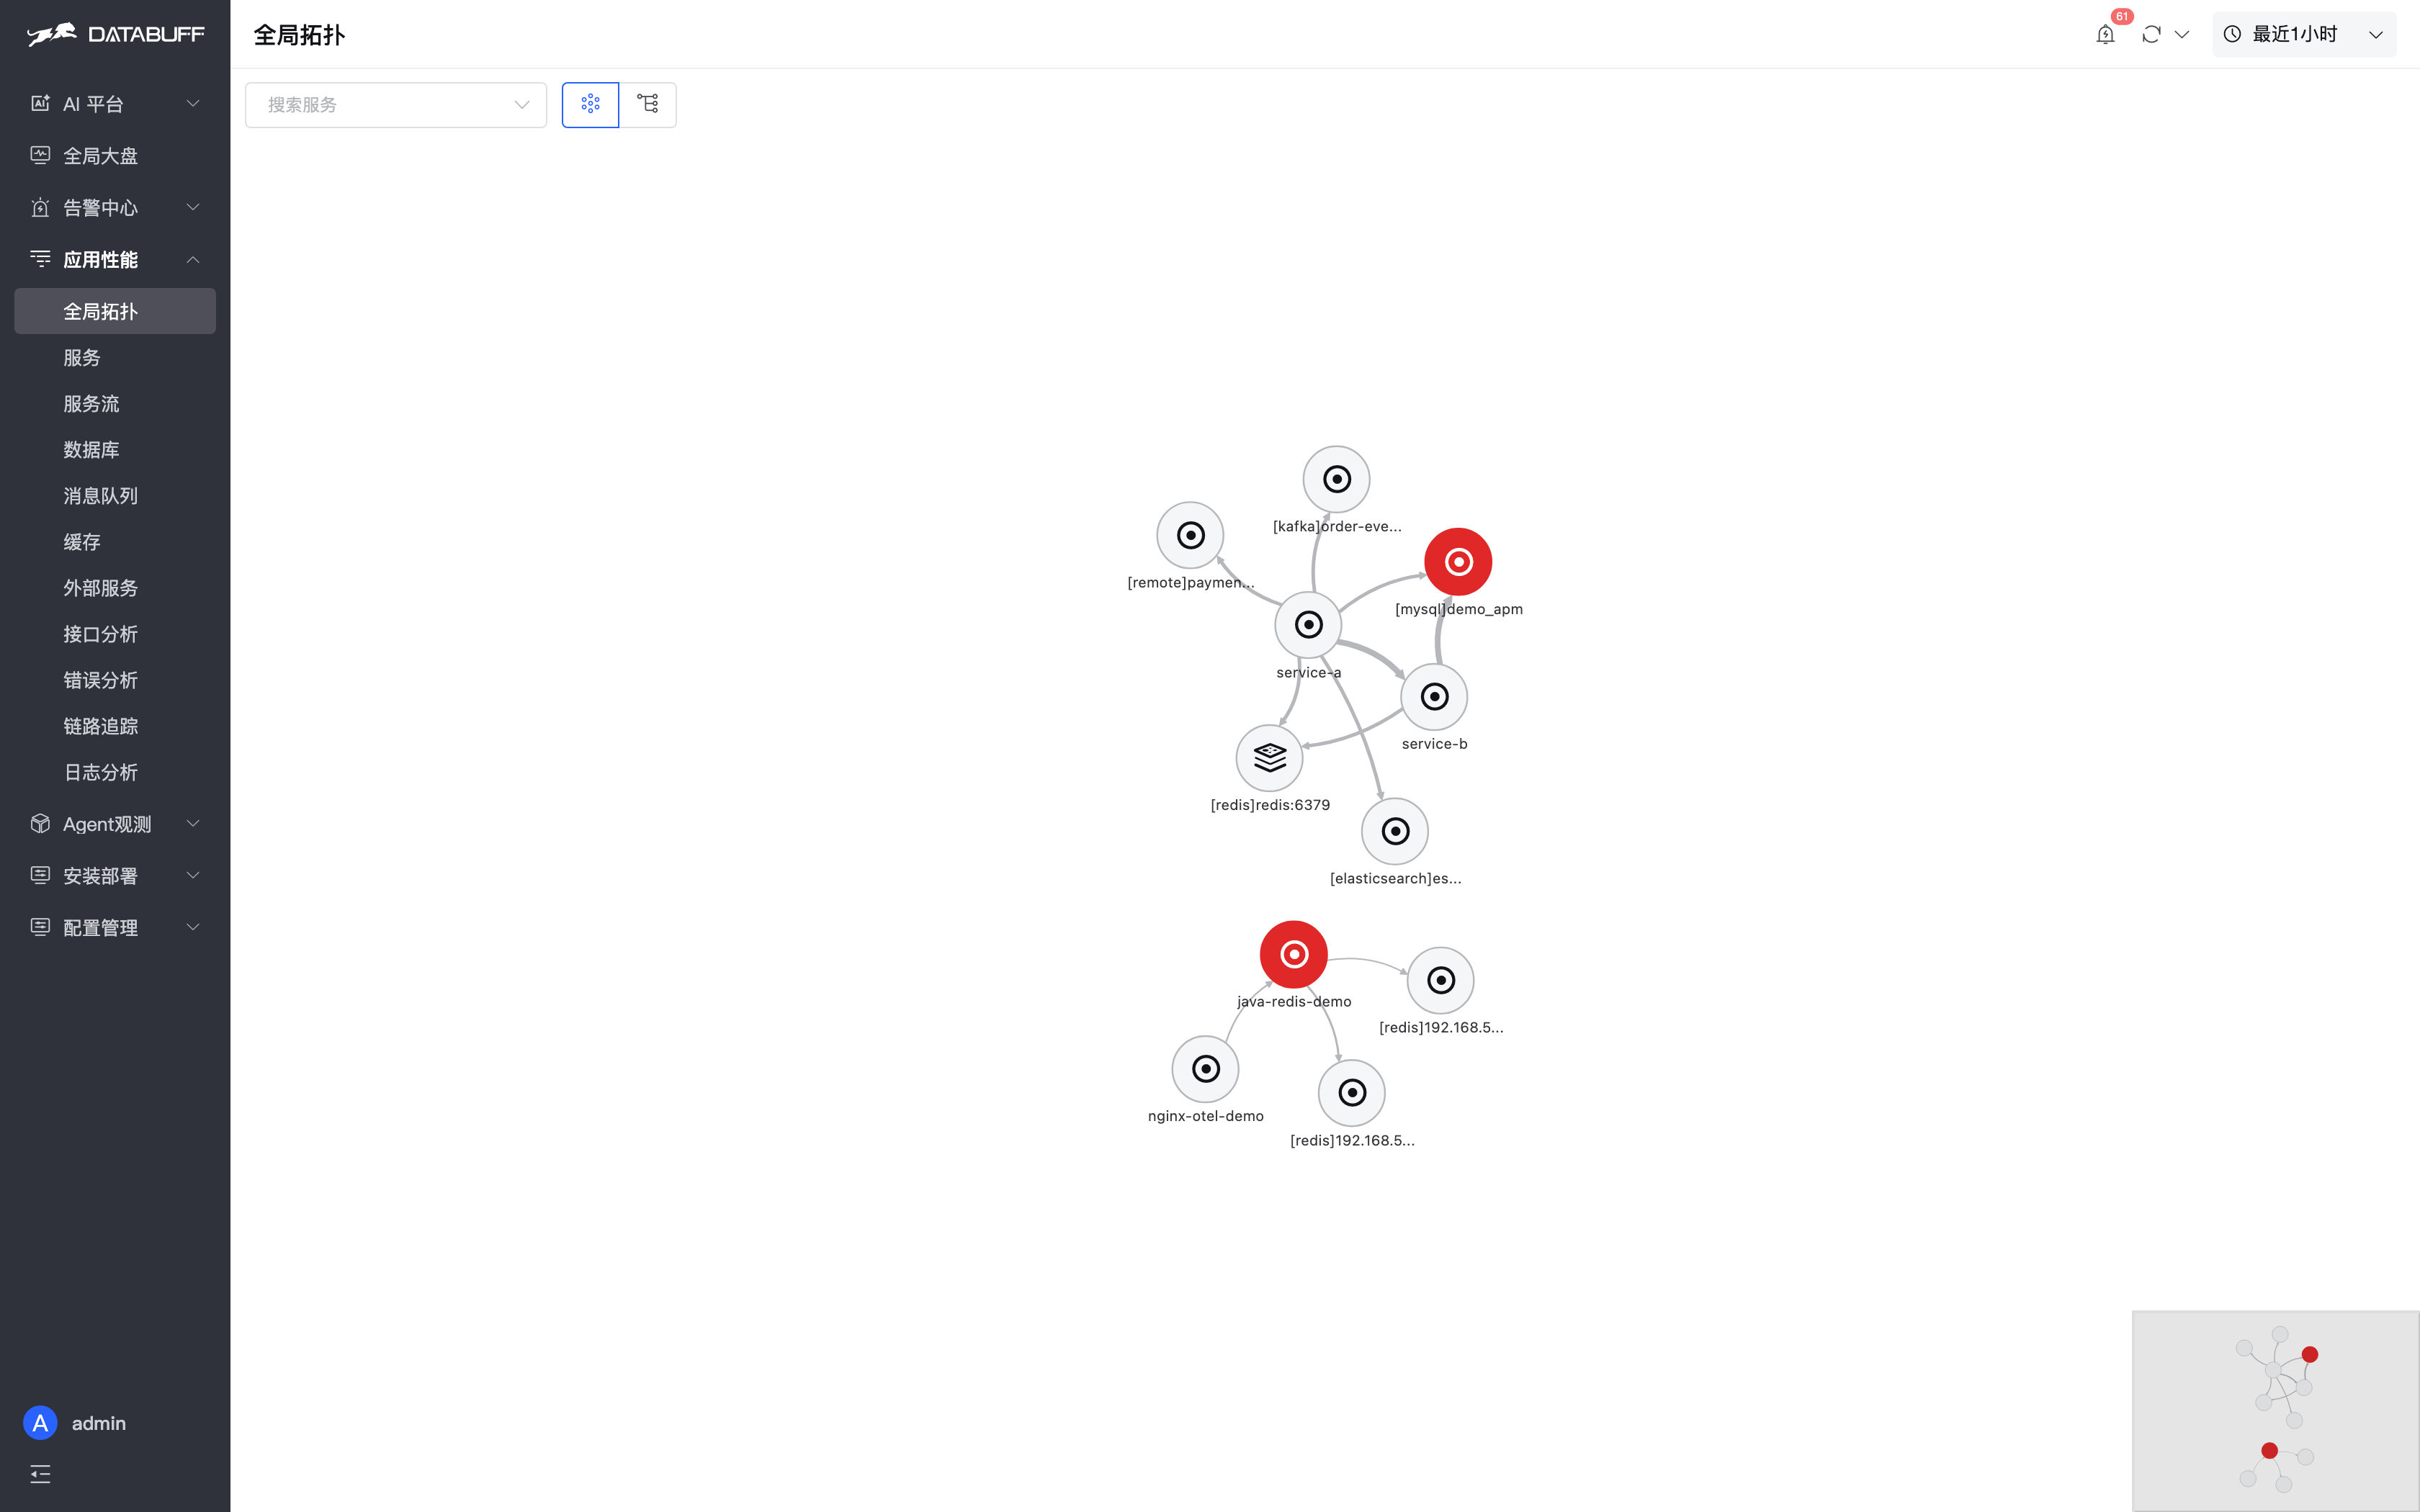
By here the gap is no longer “can you see the data.” DataBuff still has ask-the-AI and platform health. This LGTM stack did not expose those two entries.
After services, traces, and logs, two more things sit on the same menu: ask the data in natural language, and see the platform's own health. Those were the biggest feel differences on this run.
AI · Q&A / inspect / docs — same data you just drilled
Open the AI platform. You do not pick Tempo or Loki first, and you do not write TraceQL / LogQL. The page already has ask-data, inspect, product Q&A, and an ops expert. Sample prompts are concrete: last-hour service list, service-b upstream/downstream, request and error trends.
You still bring your own model. This lab used DeepSeek. The difference is the experts and tools are already in the product, so you do not assemble three datasource contexts first.
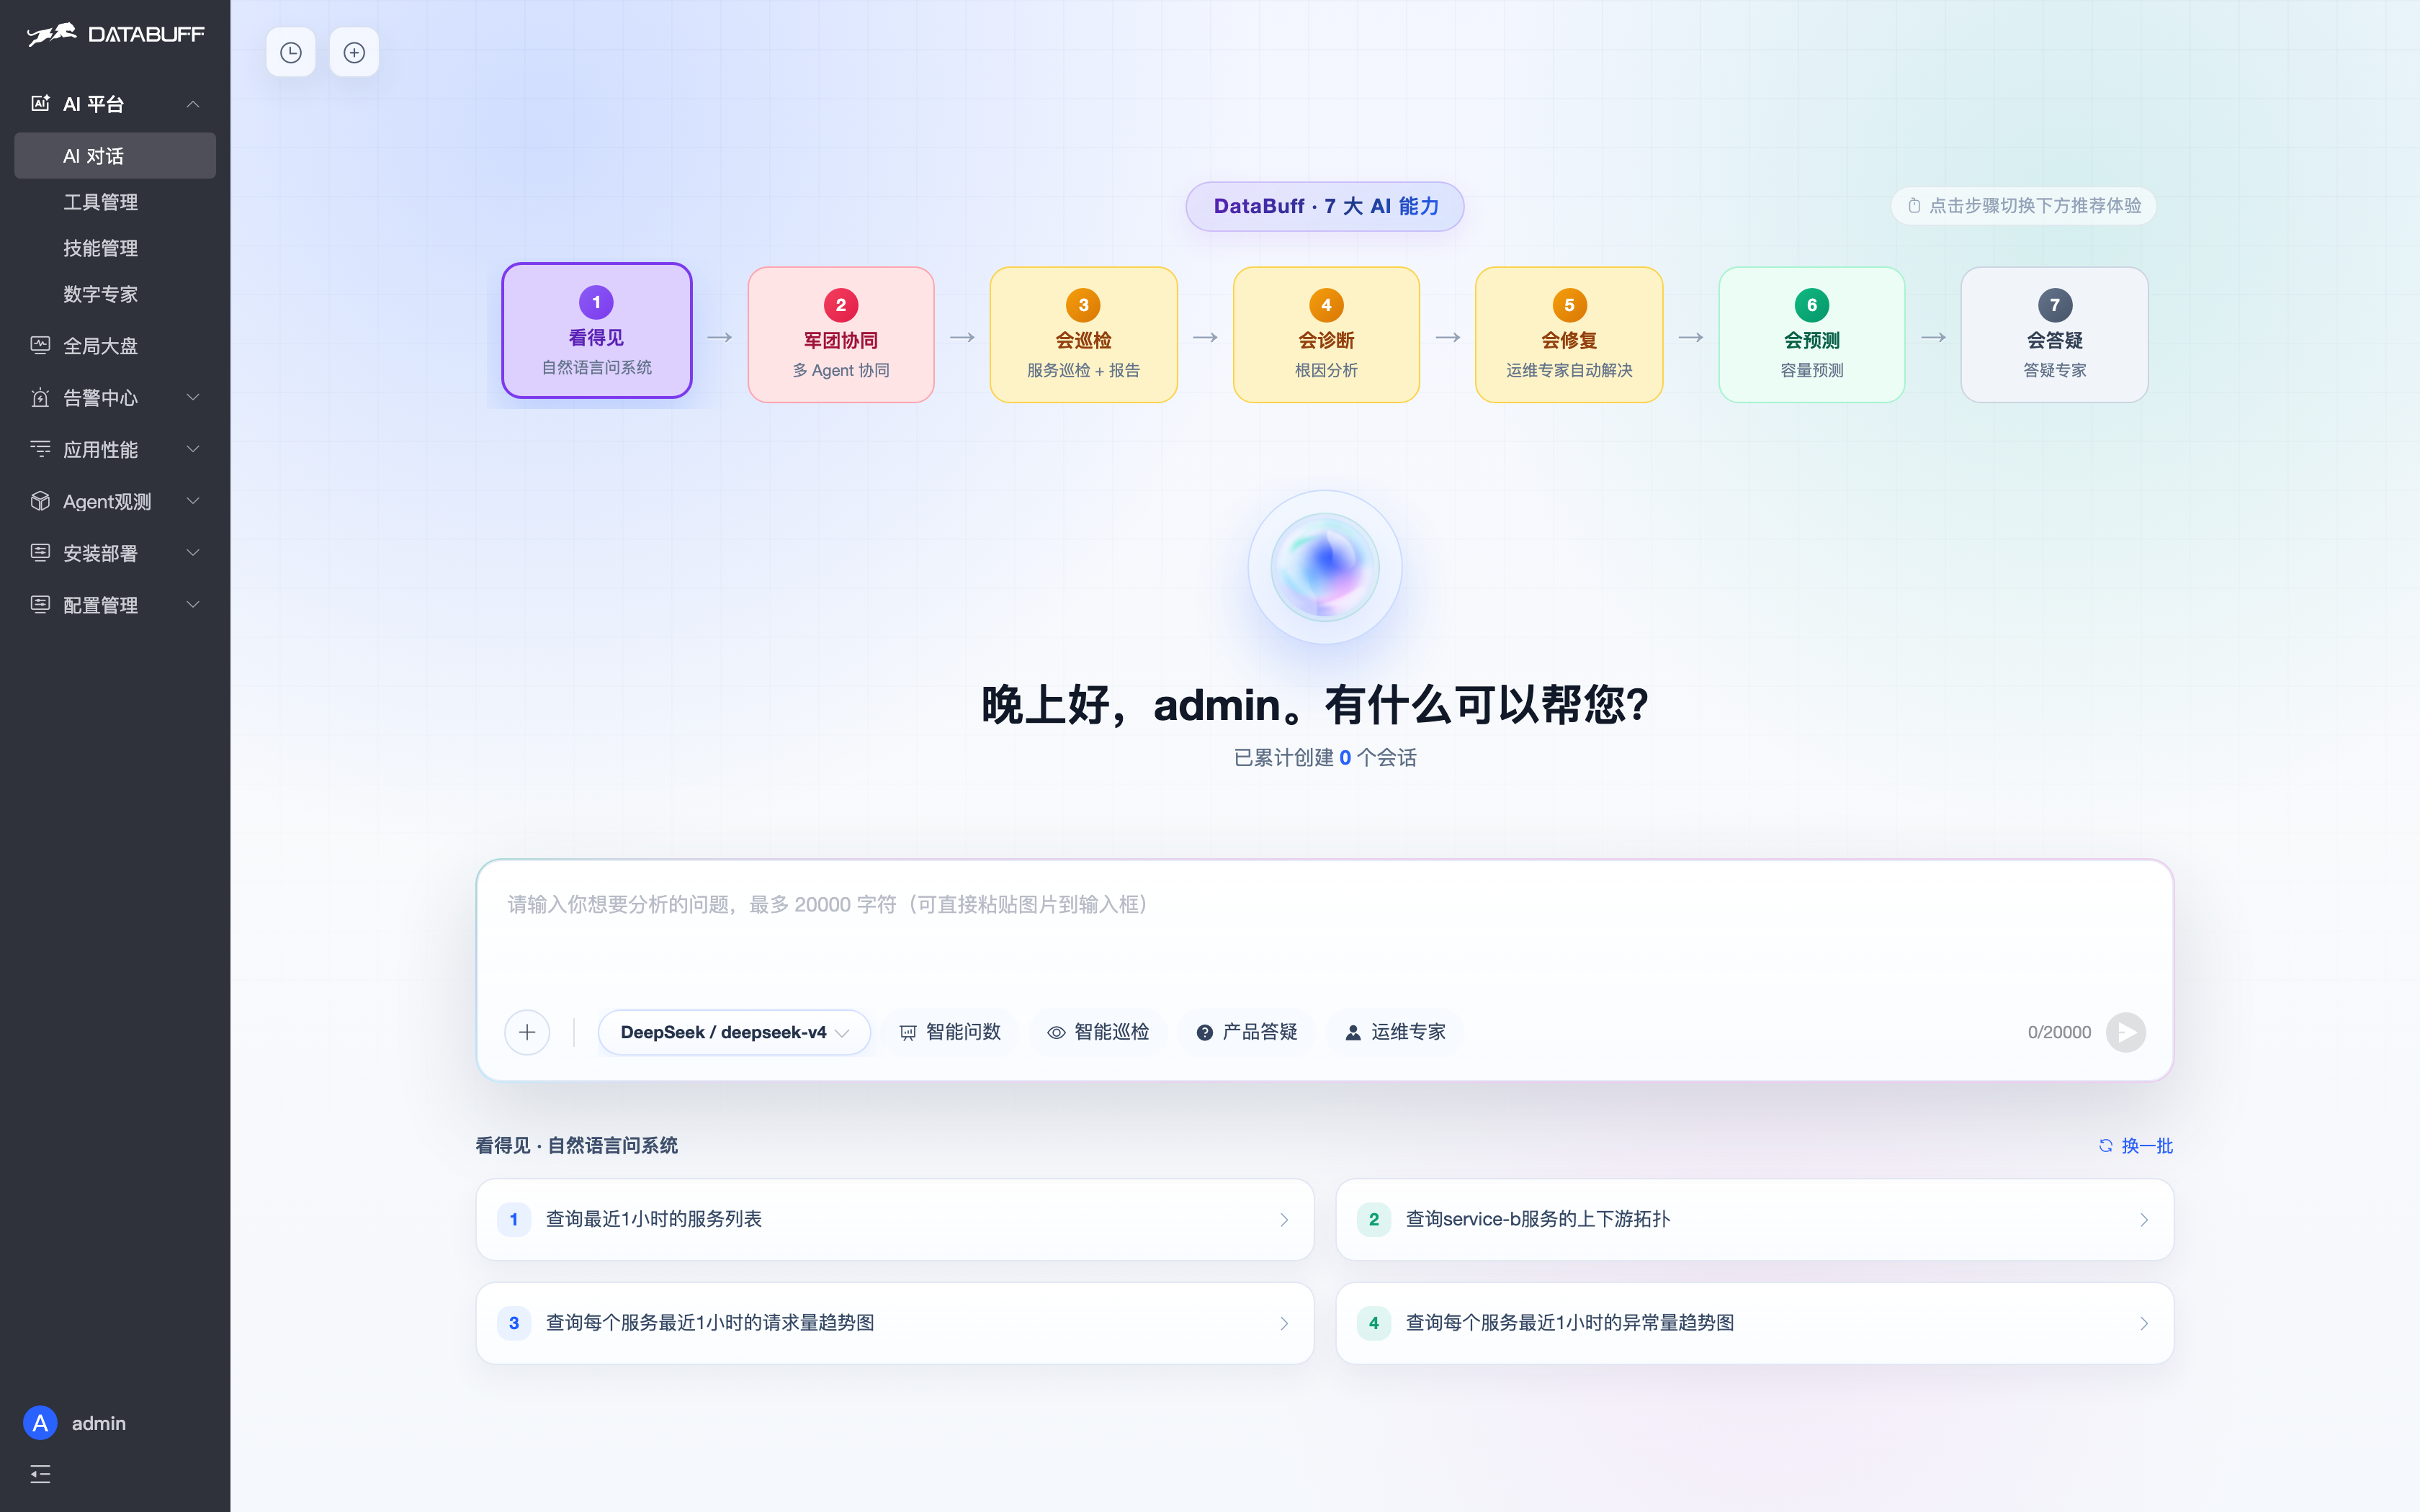
This Grafana 11.5 does not ship that as a chat entry. To ask the same way you add an LLM plugin, then wire Tempo, Loki, and the metrics store into the model context.
Self-monitoring · deploy status: treat the platform as a business system
Install → Deploy status. One page: ingest TPS, write failures, Doris disk, query failures; legend split by trace / metric / log. Inbound requests, bytes, latency, and outbound drops share one timeline.
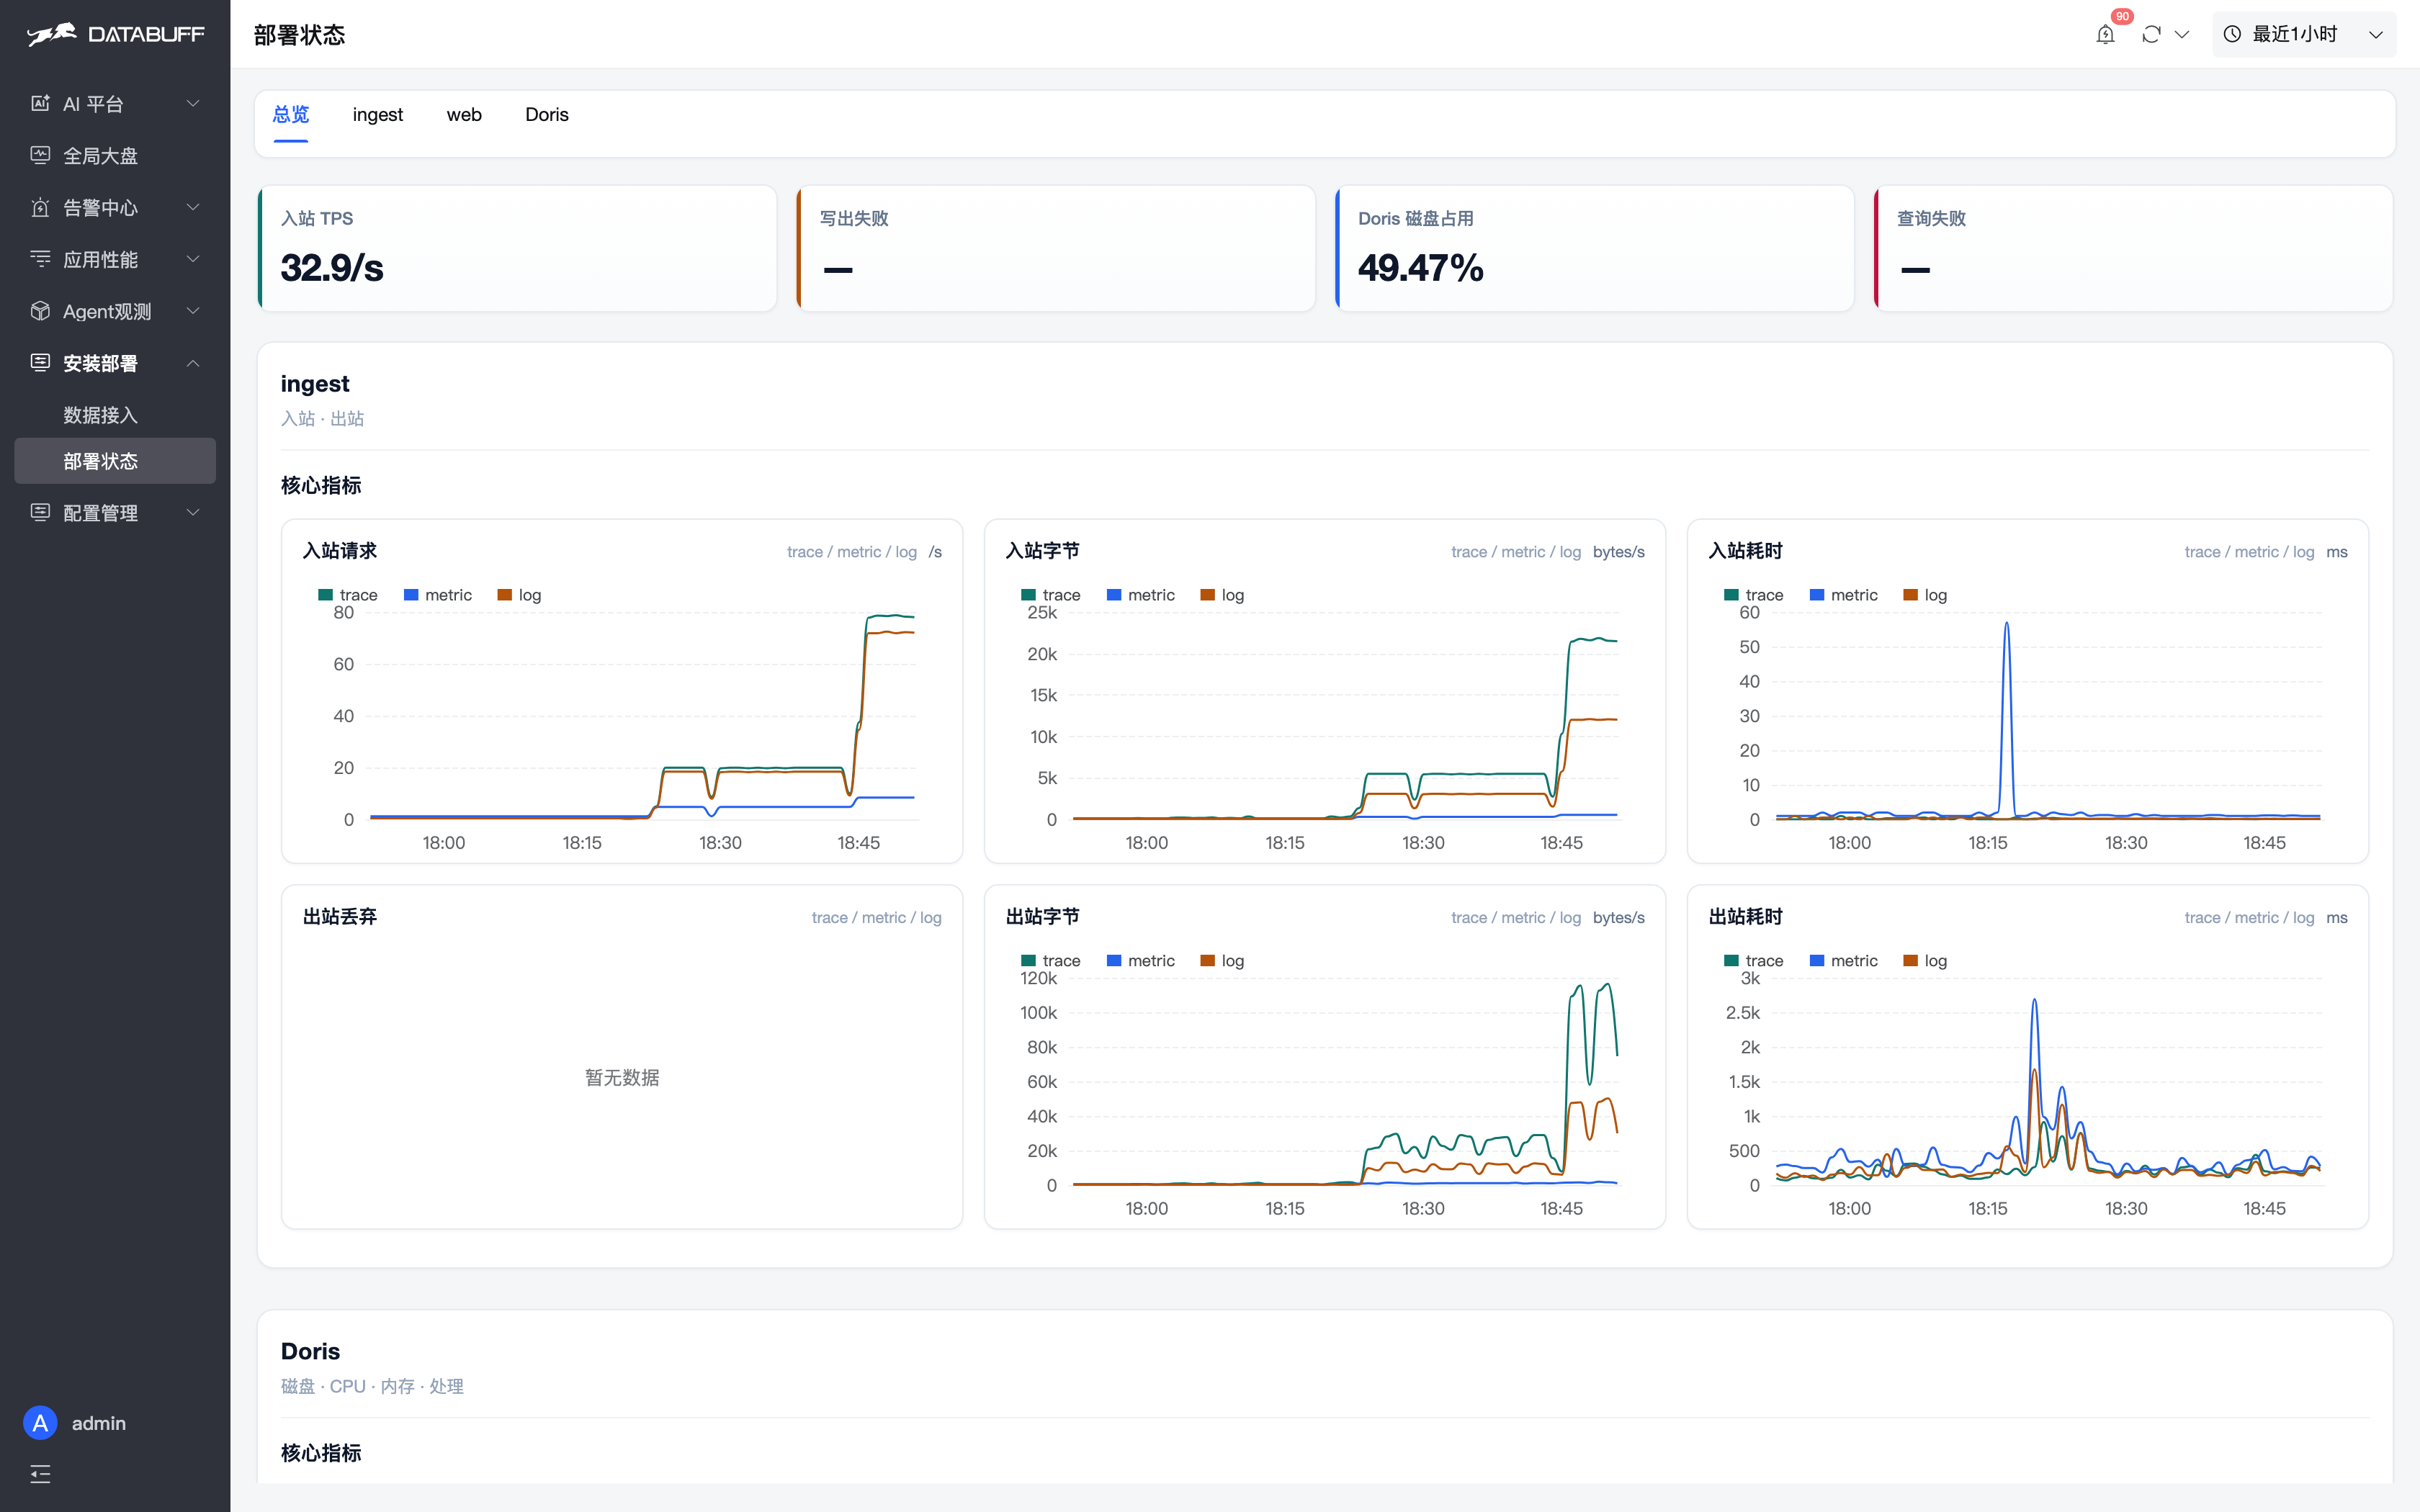
At 2 a.m., “is the app slow, or is the platform stuck?”, this page knocks out a batch: are the three lines still rising, did writes fail, is Doris disk full. In this LGTM stack those checks still mean Tempo, Loki, the metrics store, and Grafana, each on its own page.
LGTM: stop when you can see the data. DataBuff: after that you can still ask, and still see the platform.
| What you want | Grafana LGTM | DataBuff |
|---|---|---|
| Ask “who is slow, what does the topology look like” | Write the query yourself; or add an LLM plugin plus data context | AI chat: sample prompts are service list / topology / traffic |
| An inspect report you can forward | Stitch dashboards and alert rules | Inspect: the expert reads the same metrics and writes the report |
| Is the platform itself stuck | Open each component health page | One deploy-status page: ingest + Doris |
| Component bill | Tempo + metrics-generator + metrics store + Loki + Grafana | ingest + one engine + Web (AI and deploy status included) |
The collector already speaks OTLP. Add a DataBuff exporter in Alloy / Collector, write to Tempo in parallel for a few days, confirm the same spans line up, then drop the Tempo path if you want. The whole thing rolls back.
Walk it once: service health → trace → logs → ask the AI for a service list or topology → deploy status, three ingest lines. LGTM can stay. Just see if this on-call path feels shorter.