It's 2 a.m. The alert channel blows up.
Someone needs error rates. Someone else wants traces. Another person suspects a full disk on a container. You open one AI chat — it either hand-waves, or mixes metrics, logs, and SSH into one muddy answer. The more you ask, the messier it gets.
Open more windows? Worse. Each bot talks past the others. You still don't have one incident-ready summary you can paste into the war room.
The instinct is: one stronger model, one longer prompt, done. On a real incident, that breaks — same reason a hospital does not send one doctor to run the ECG, draw blood, read the CT, and operate at once.
Chest pain in the ER: you do not expect a single generalist with every machine and permission. Wrong tools, shallow on everything. Lab values and surgical plans get mixed up.
On-call is the same. Ask “anything wrong with the cluster?” and you may need:
- Data Query — latency, error rates, slow traces in Doris (labs)
- Inspection — JVM/GC sweeps across dozens of services (screening)
- Ops Expert — SSH, logs, disk, processes (surgery)
- Product Q&A — OTLP ports, alert menus (admin desk)
Four toolchains, permissions, and report formats. One mega-prompt balloons context — metrics bleed into shell commands. Models cross-contaminate, overreach, hallucinate.
One window for metrics, inspection, SSH, and docs — all in one prompt.
Complex incidents queue serially; blurry tool boundaries; long context drifts.
Triage desk routes; each expert uses its own tools and data.
Data Query and Inspection run together; conclusions carry evidence; one merged report.
More chat tabs? Still no triage desk — you stitch the story at 2 a.m.
- You talk only to the triage desk (AI Brain)
- The desk does not run labs — it pages the right specialty
- Experts query real telemetry and return evidence-backed reports
- The desk merges into something you can act on
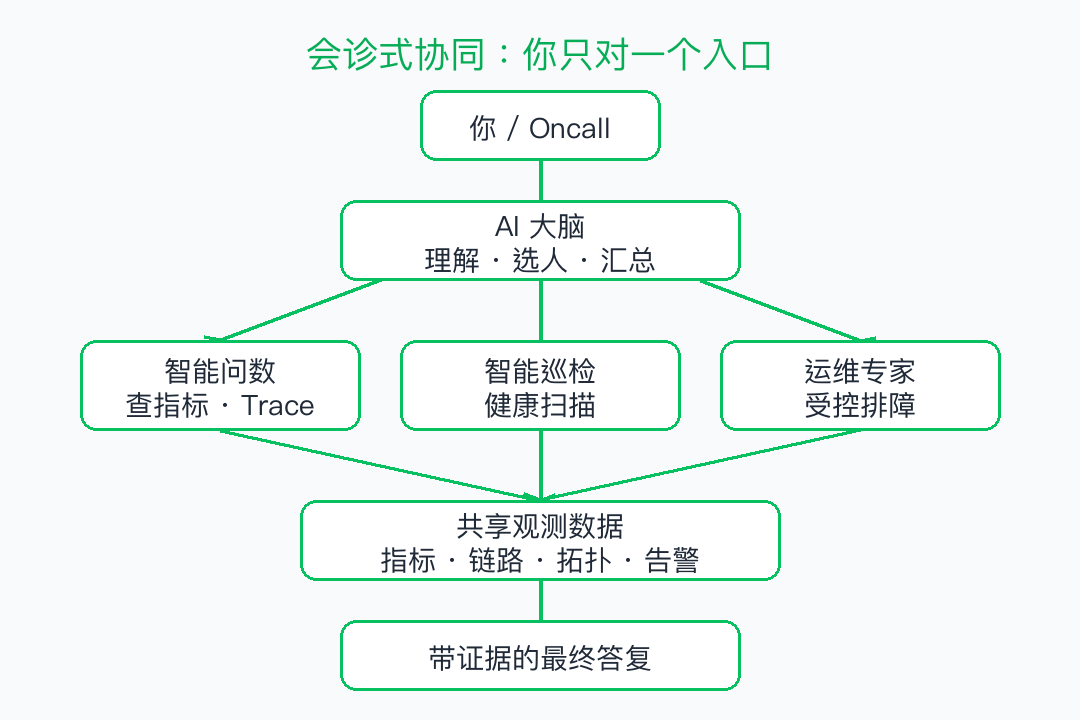
This is not sidebar ChatGPT. Classic APM + chat often cannot see live metrics and traces. DataBuff is AI-native APM on OpenTelemetry — experts must call tools; guessing is not the design.
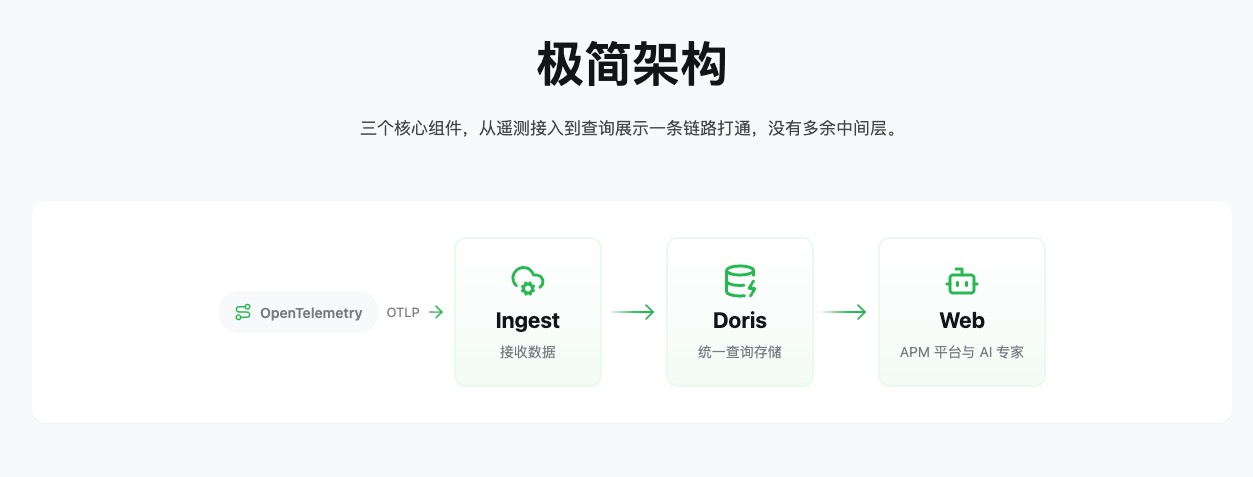
- Tools — instruments: service lists, traces, inspections, controlled commands
- Experts — roles with the right playbooks and permissions
- Playbooks — how each role investigates; routing rules for the Brain
A new “department” ≈ tools + playbook + expert registration. Your observability pipeline stays put. You still talk to one desk.
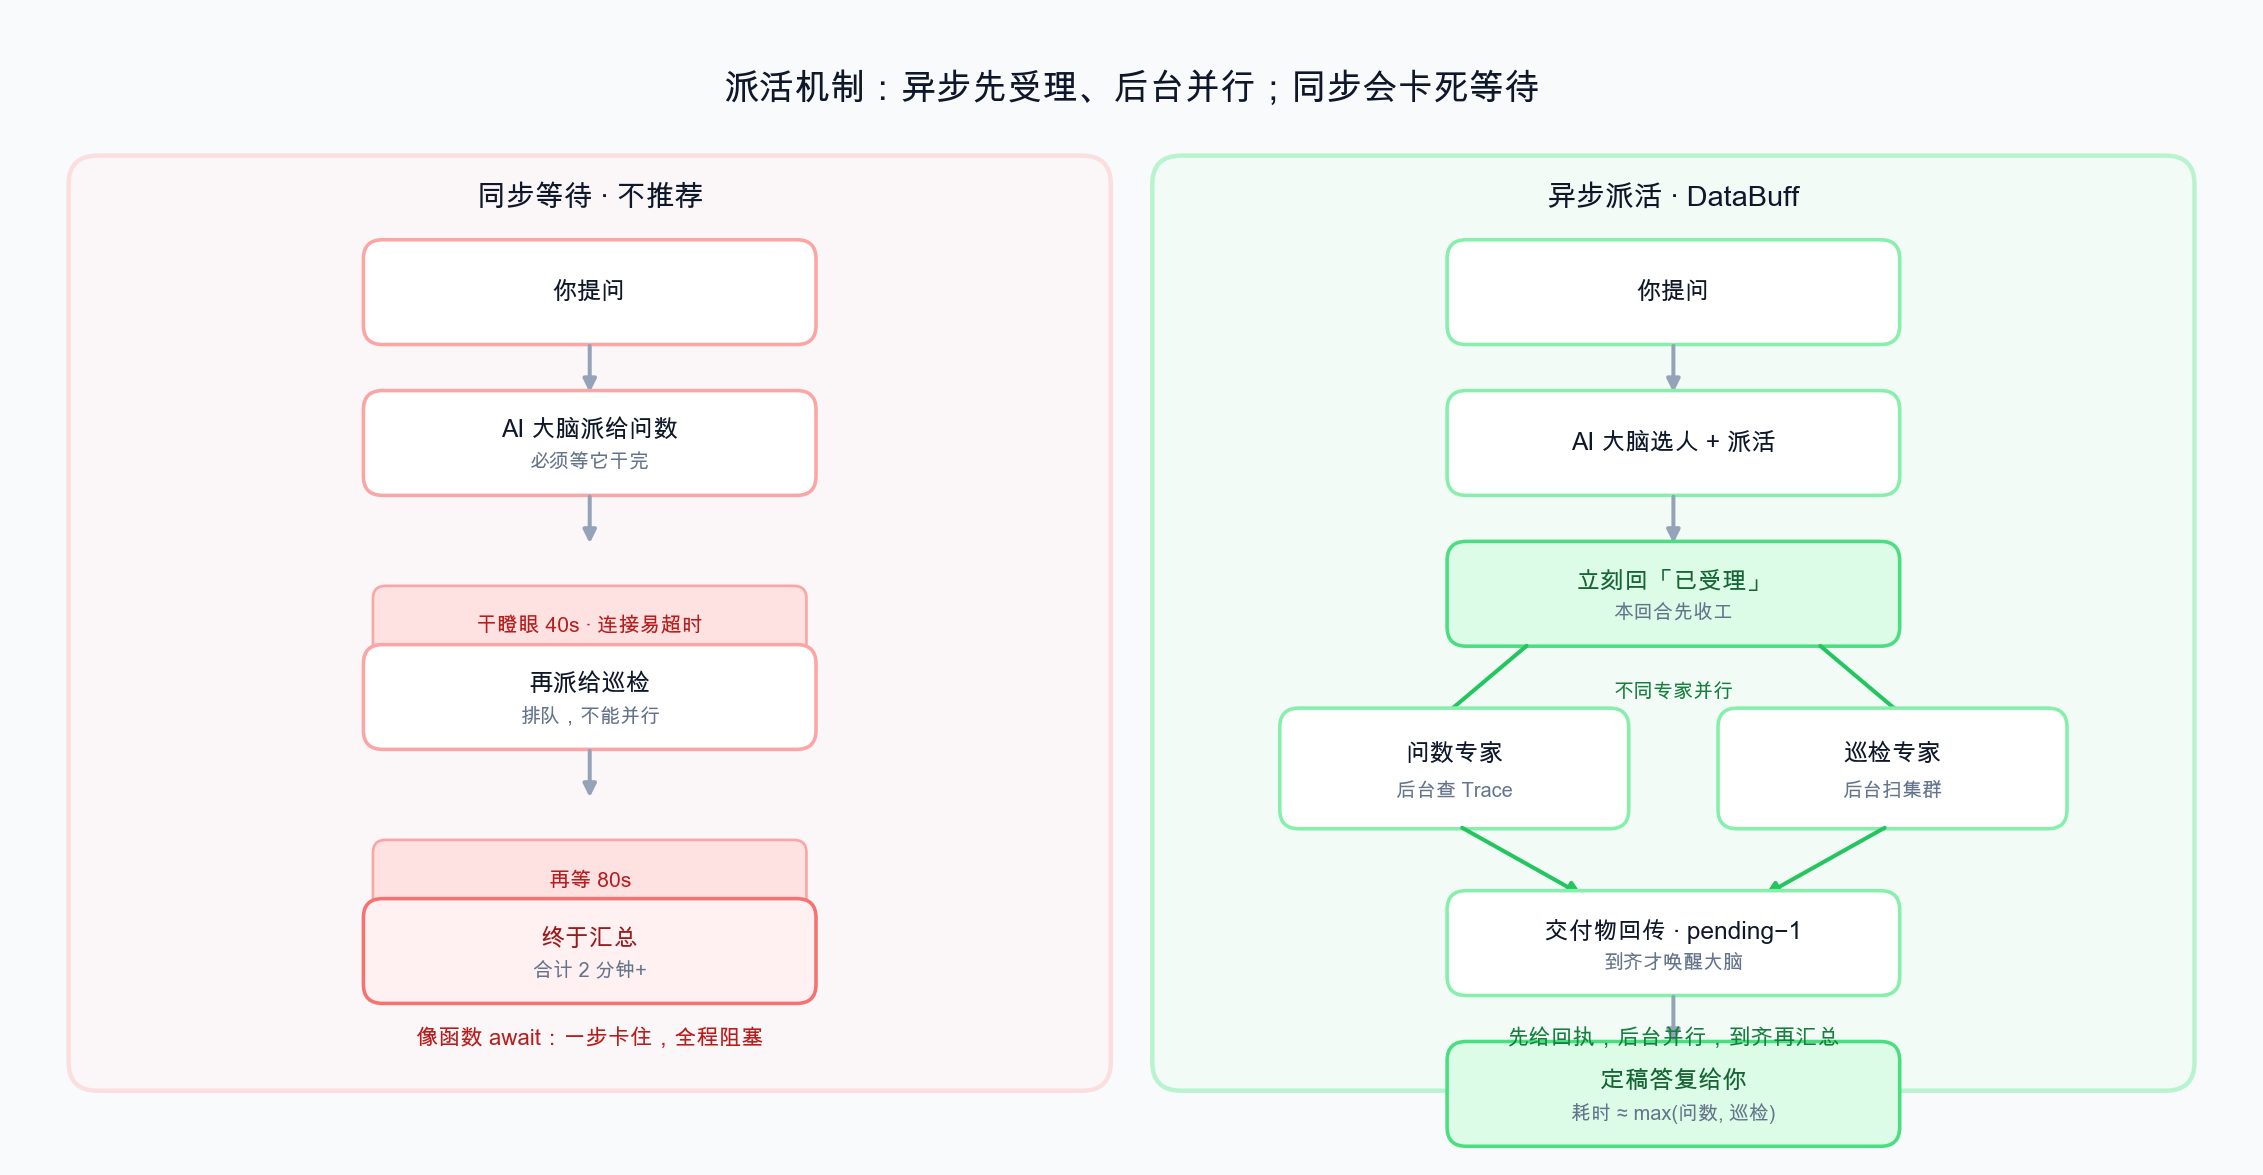
The Brain loads routing rules, reads expert charters, and semantically matches your request — then dispatches: which expert + task brief. Two hard rules: faithful to your intent, and the Brain does not do the work (no metrics, no inspection, no shell). Triage and synthesis only.
- Expert jobs are slow — inspections and trace hunts take tens of seconds.
- Long SSE connections time out if Brain blocks waiting.
- Parallelism dies — serial wait = sum of latencies; async = max of parallel legs.
- Experts are multi-step tool loops — binding that synchronously bloats Brain context.
On demo.databuff.ai, open AI Brain. Do not pick an expert manually. Paste:
Brain dispatches twice in parallel — Data Query and Inspection.
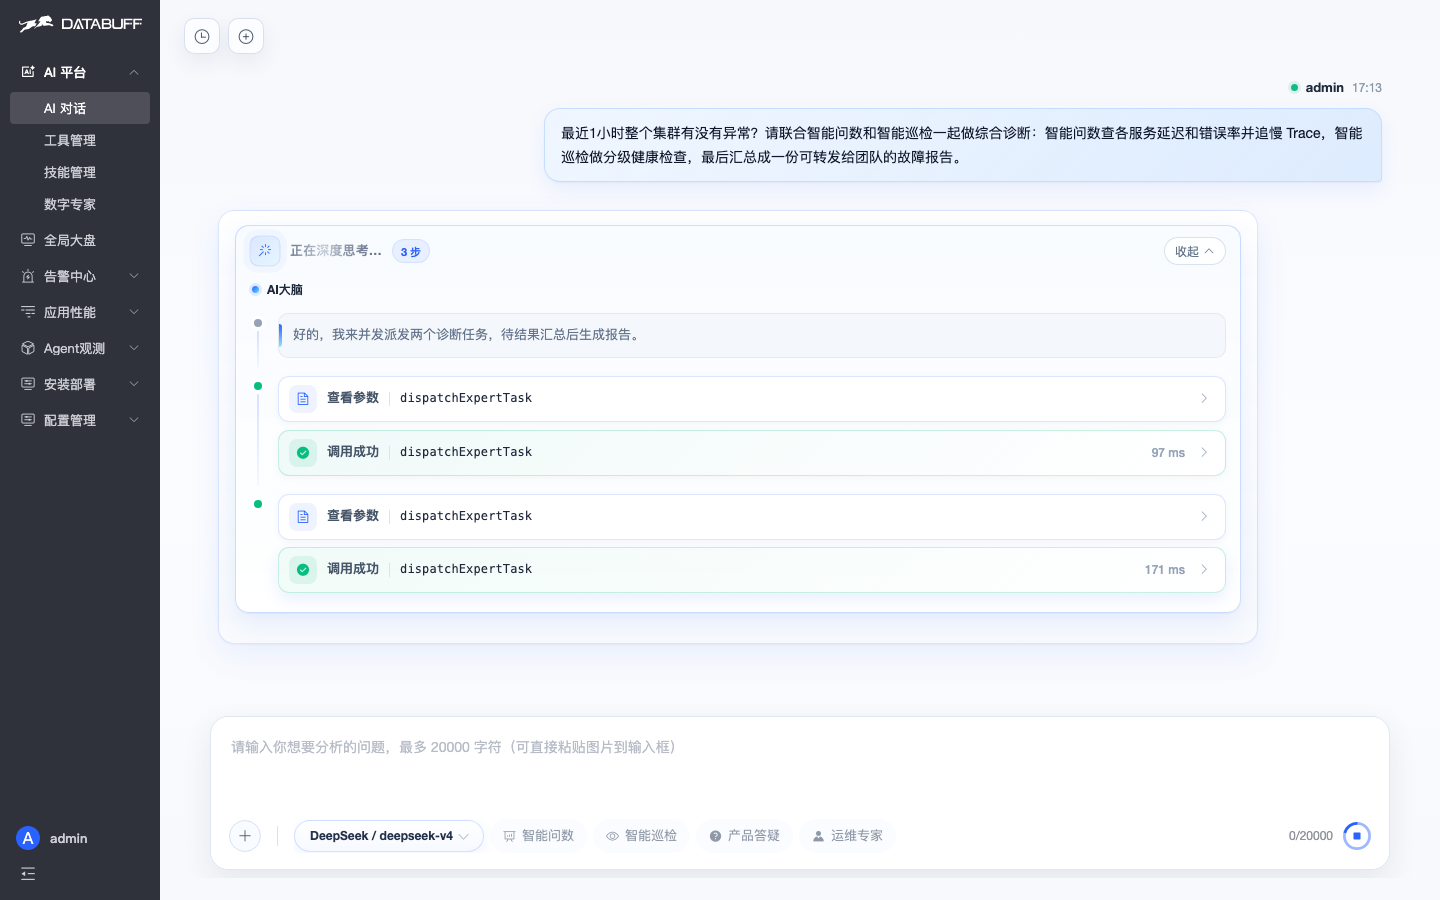
Inspection returns S/A/B tiers: most of 34 services in S/A; service-b at B with InsufficientStockException on SKU DEMO-10001. Brain merges HTML with P0/P1 actions — ready for the incident channel:
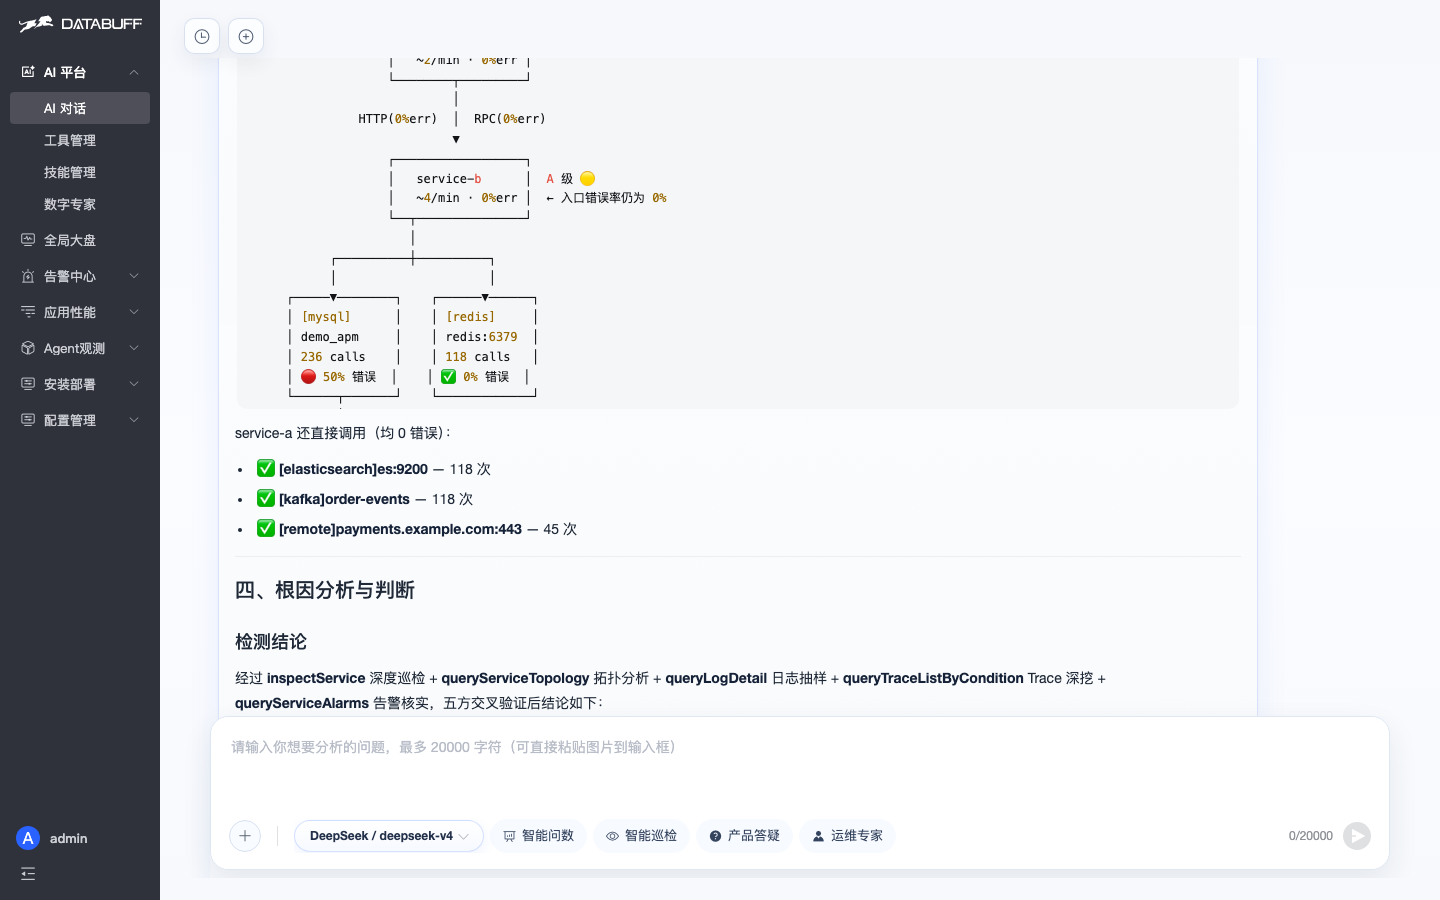
Many UIs show four tiles — Data Query, Inspection, Ops, Q&A. You guess which door to knock on. One conversation, one expert. Switch experts, new window. Ask for error rates and a JVM sweep? You play dispatcher across tabs.
Four entries, four single-chat rooms. Joint diagnosis = you relay between windows.
One AI Brain entry; Brain dispatches; demo above — one sentence, two experts, one report.
The gap is not four avatars vs one. It is who routes work: you picking experts, vs Brain dispatching, parallelizing, and merging with an evidence chain.
Try DataBuff
Open source · multi-expert orchestration · one entry, parallel dispatch
Online Demo: https://demo.databuff.ai
GitHub: https://github.com/databufflabs/databuff