Slow pages and timeouts, after you've already dug through backend logs — the gap is often the Nginx in front: did the proxy succeed, how long did it take? Access logs won't say.
- Can't see it: entry latency and proxy success aren't in classic logs
- Can't stitch it: Nginx and the backend each keep their own records
- Afraid to touch: existing Nginx — worried about adding a module to production
- Don't want code changes: zero-intrusion preferred — attach and export
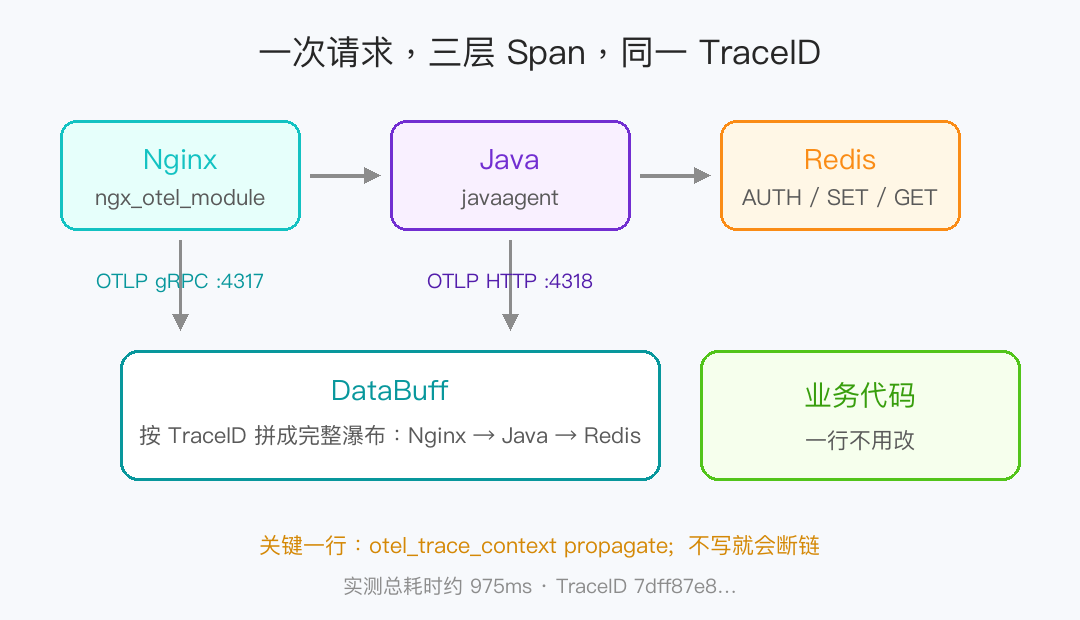
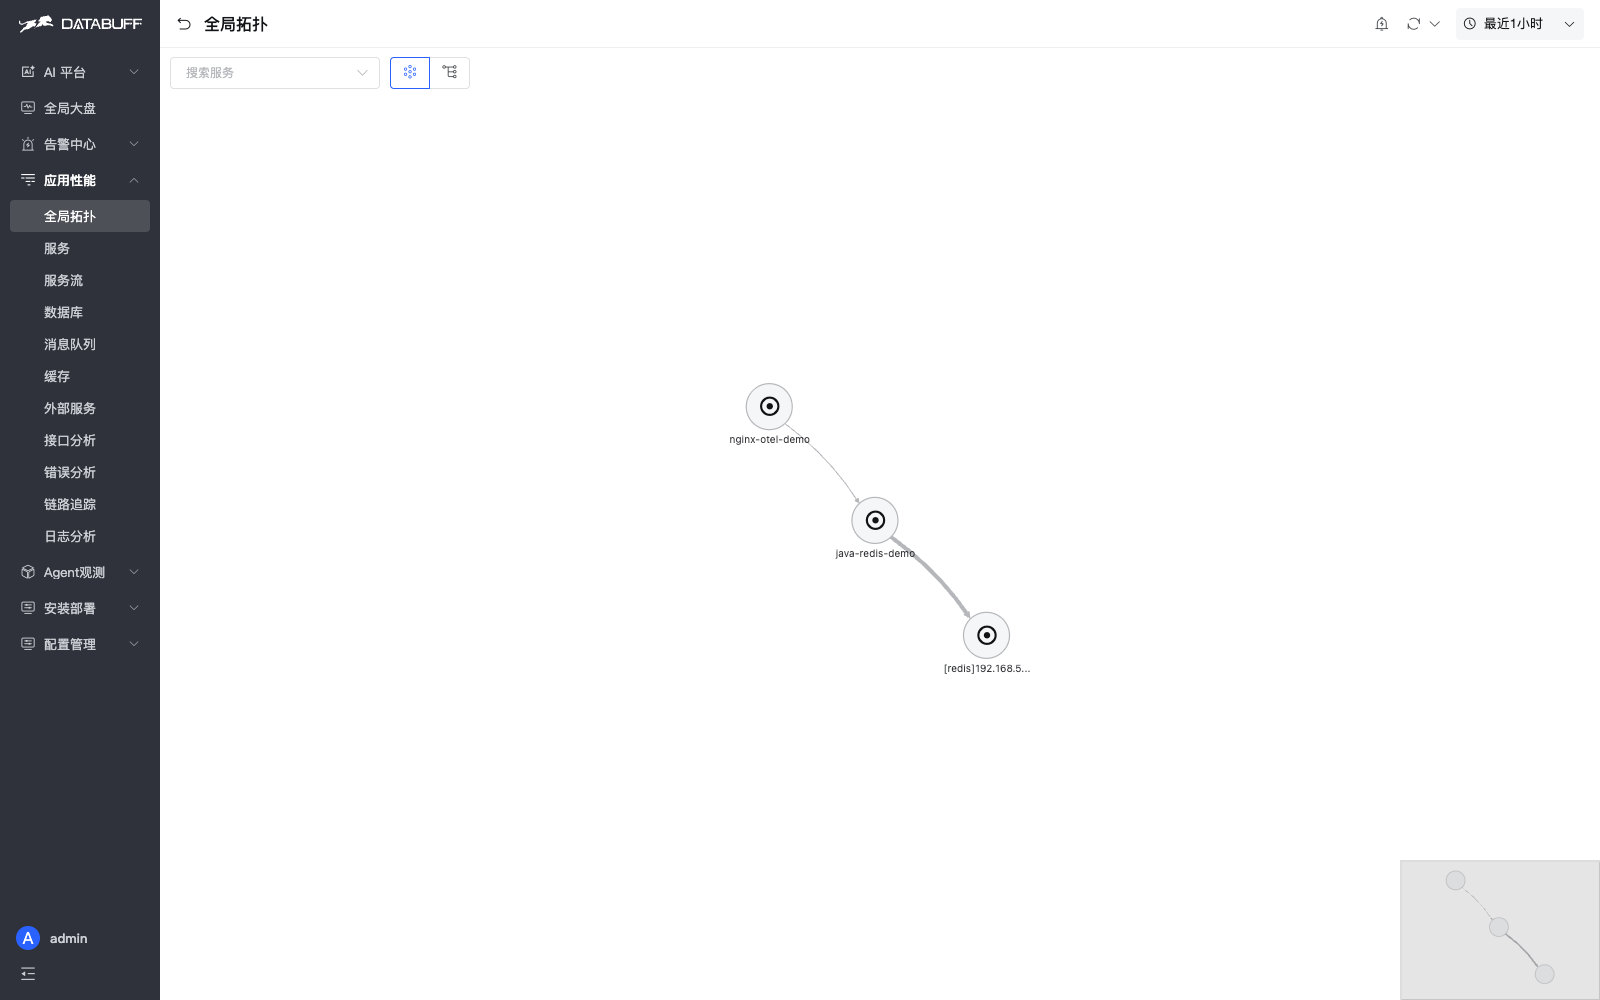
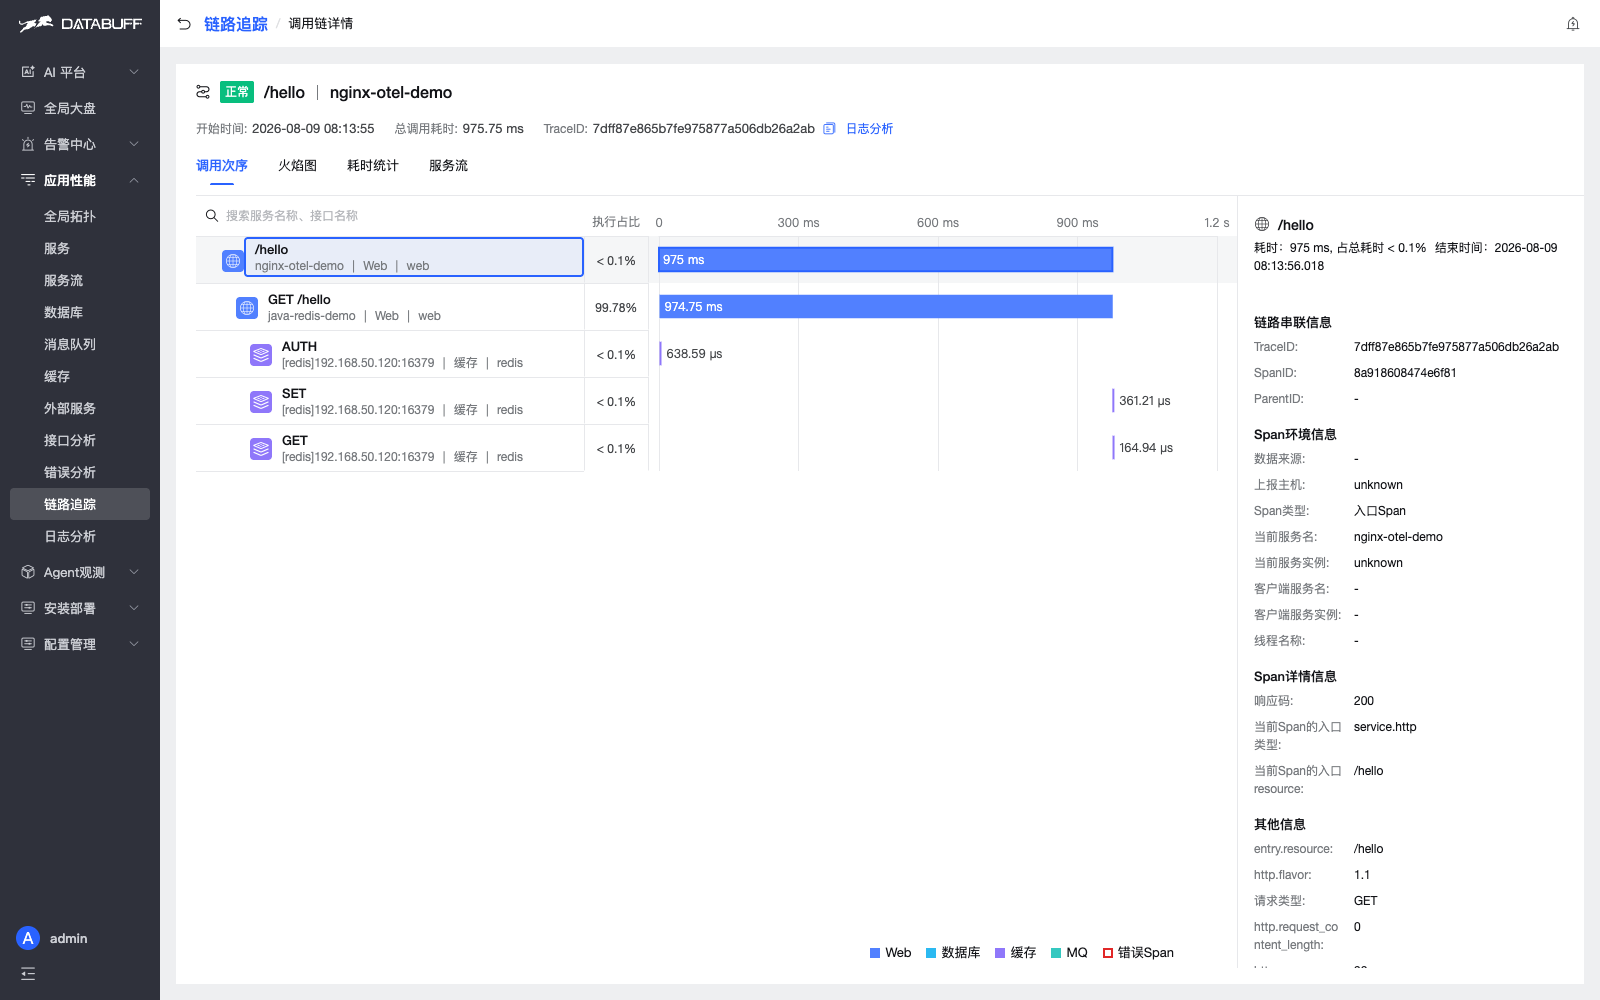
The approach is simple: install the OTel module on Nginx, attach the official Java agent, export both to DataBuff — one request shows the full Nginx → Java → Redis waterfall.
DataBuff is an open-source AI-native OpenTelemetry APM: metrics, traces, logs, and AI troubleshooting together. It natively accepts OTLP, so Nginx / Java exports stitch into one Trace.
GitHub: https://github.com/databufflabs/databuff
Each hop records its own Span with the same TraceID; the platform builds the waterfall. No business code changes.
Have a DataBuff that accepts OTLP (4317 gRPC / 4318 HTTP). Run the commands on the Nginx/Java host; DataBuff can be local or another machine on the LAN.
| Path | When | How |
|---|---|---|
| Path 1 | New / container | Use nginx:1.27-alpine-otel, module built-in, docker with your conf |
| Path 2 | Existing Nginx | Install nginx-module-otel → write conf → nginx -t → nginx -s reload |
OTel directives are the same. Module needs Nginx 1.21+; older hosts use Path 1 without touching the host Nginx.
Shared full nginx.conf (replace DataBuff / Java addresses; same host can use 127.0.0.1):
load_module /usr/lib/nginx/modules/ngx_otel_module.so;

worker_processes auto;
error_log /var/log/nginx/error.log notice;
pid /var/run/nginx.pid;

events {
    worker_connections 1024;
}

http {
    include /etc/nginx/mime.types;
    default_type application/octet-stream;

    otel_exporter {
        endpoint <DataBuff-host-IP>:4317;
        interval 5s;
    }
    otel_service_name nginx-otel-demo;
    # Critical: propagate traceparent downstream or the chain breaks
    otel_trace_context propagate;

    server {
        listen 80;
        otel_trace on;

        location / {
            proxy_pass http://<Java-host-IP>:18091;
        }
    }
}
Path 1 · Official OTel image
docker run -d --name nginx-otel \
  -p 8090:80 \
  -v /path/to/nginx.conf:/etc/nginx/nginx.conf:ro \
  nginx:1.27-alpine-otel
After config changes:
docker cp /path/to/nginx.conf nginx-otel:/etc/nginx/nginx.conf
docker exec nginx-otel nginx -t
docker exec nginx-otel nginx -s reload
Path 2 · Add module to existing Nginx
nginx -v
# Alpine
apk add --repository https://nginx.org/packages/mainline/alpine/v3.21/main nginx-module-otel

# CentOS / RHEL (nginx.org yum)
yum install nginx-module-otel

# Debian / Ubuntu (nginx.org apt)
apt install nginx-module-otel
nginx -t
nginx -s reload
Java · attach the agent
Download opentelemetry-javaagent.jar. No business code changes. Java uses HTTP 4318, Nginx uses gRPC 4317, same DataBuff:
java -javaagent:opentelemetry-javaagent.jar \
  -Dotel.service.name=java-redis-demo \
  -Dotel.exporter.otlp.endpoint=http://<DataBuff-host-IP>:4318 \
  -jar your-app.jar
Generate traffic
curl http://YOUR-HOST:8090/hello
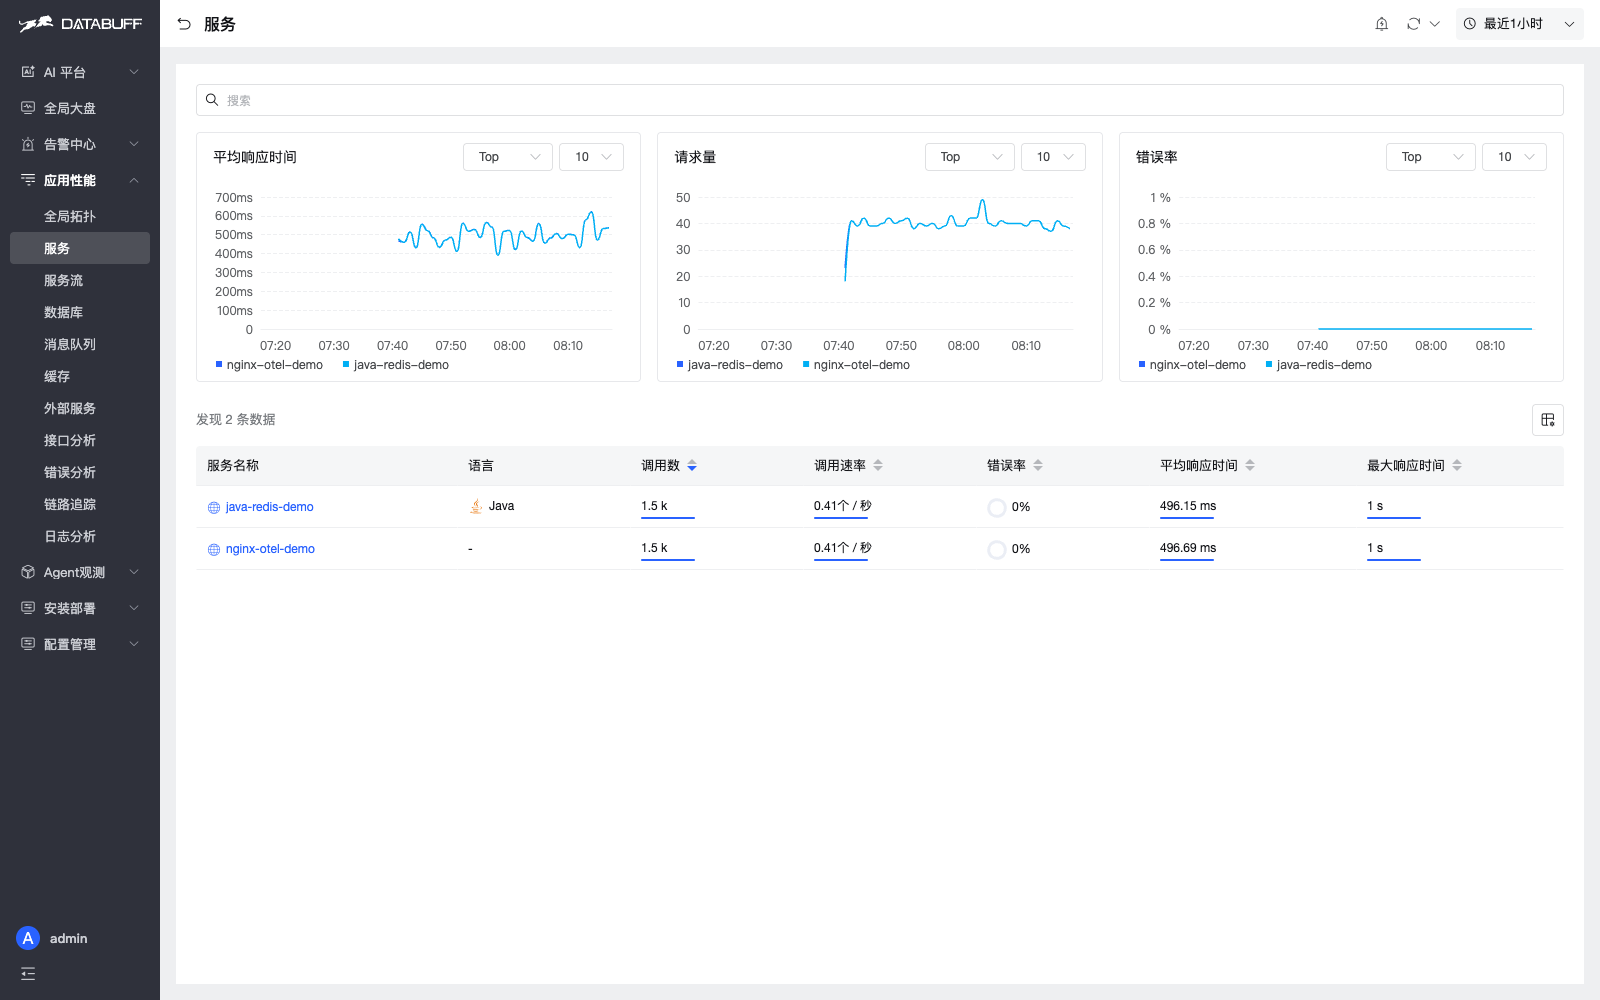
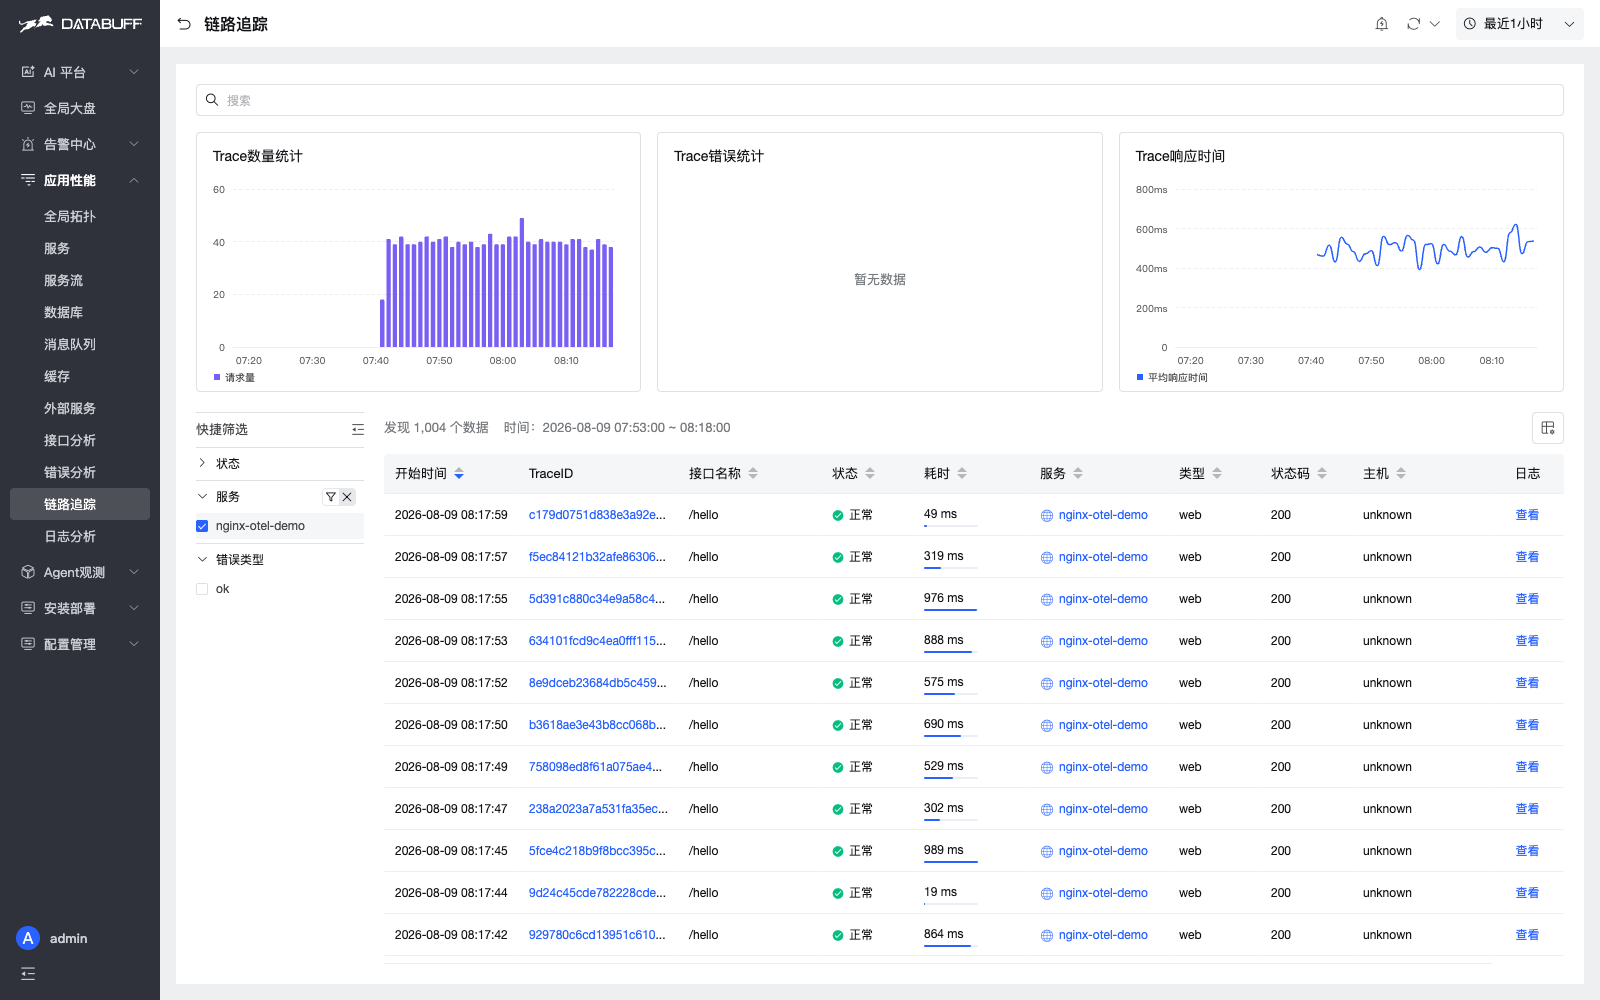
Wait ~30s, open DataBuff Traces, select nginx-otel-demo, open any waterfall.
Easiest pitfall: missing otel_trace_context propagate;. Without it Nginx and Java become two unrelated traces. Then nginx -t && nginx -s reload.
- Nginx too old? Use Path 1 official image.
- Change Java code? No. Official javaagent auto-instruments HttpServer / Jedis.
- Will reload hurt production?
nginx -tthennginx -s reload. - Suggested path: Path 1 in test first, then Path 2 on existing hosts.