Gartner coined AIOps back in 2016. For years the gut feeling was “vaporware”: commercial tools are expensive, closed, and black-box; in open source you get alert-noise scripts or log analyzers — nothing that truly wires AI into live monitoring data and can fix problems. The moment I got DataBuff running, my first thought was — someone finally built it.
This post skips architecture slides and protocol names. I walk through seven scenarios I ran hands-on in a test environment. Each starts with one sentence; the AI pulls data, draws conclusions, and in some cases SSHs in to repair. After these, AIOps stops being a deck concept and becomes something you can use.
What it is: open source, AI-native, OpenTelemetry APMOne-line positioning: DataBuff is an open-source, AI-native APM built on OpenTelemetry. Plain English — it is a monitoring platform for metrics, traces, and logs; unlike classic APM, AI is not a bolt-on chat box on the side. It lives on the data: you ask a question, it reads live metrics, follows traces, queries logs, and returns evidence-backed answers instead of dumping charts on you.
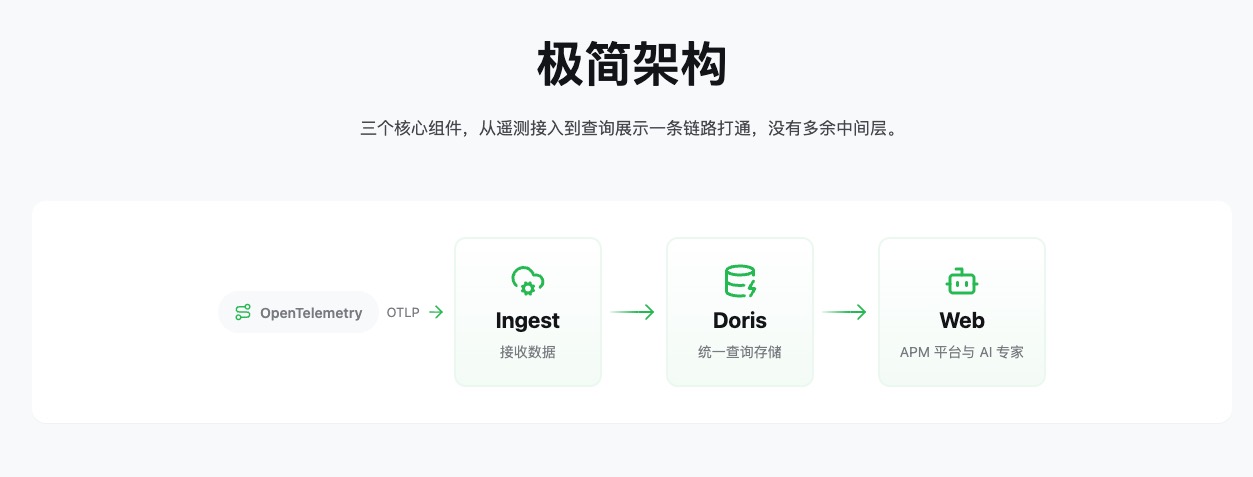
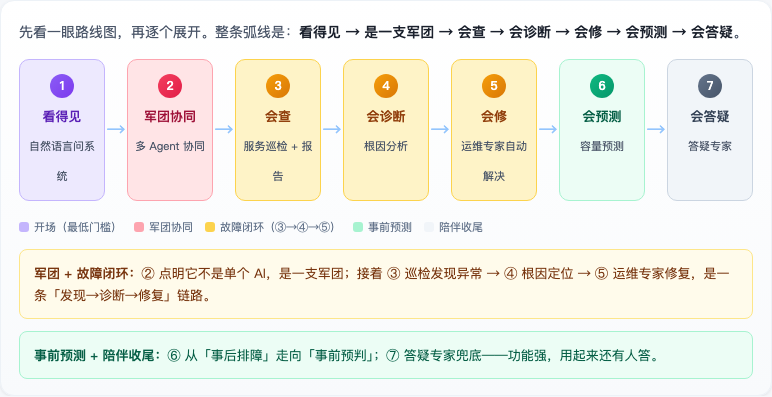
The gap is “AI-native.” Many products are “APM + chat widget” where the model just tells you to look at a dashboard. DataBuff’s AI reads data, calls tools, and can reach hosts — the seven scenarios below are proof. The arc to keep in mind:
Start with the obvious. To find slow services you used to open Grafana, memorize PromQL, write queries, read charts, and sort yourself. In DataBuff I asked in plain English: “Which service was slowest in the last hour? List the top 3.”
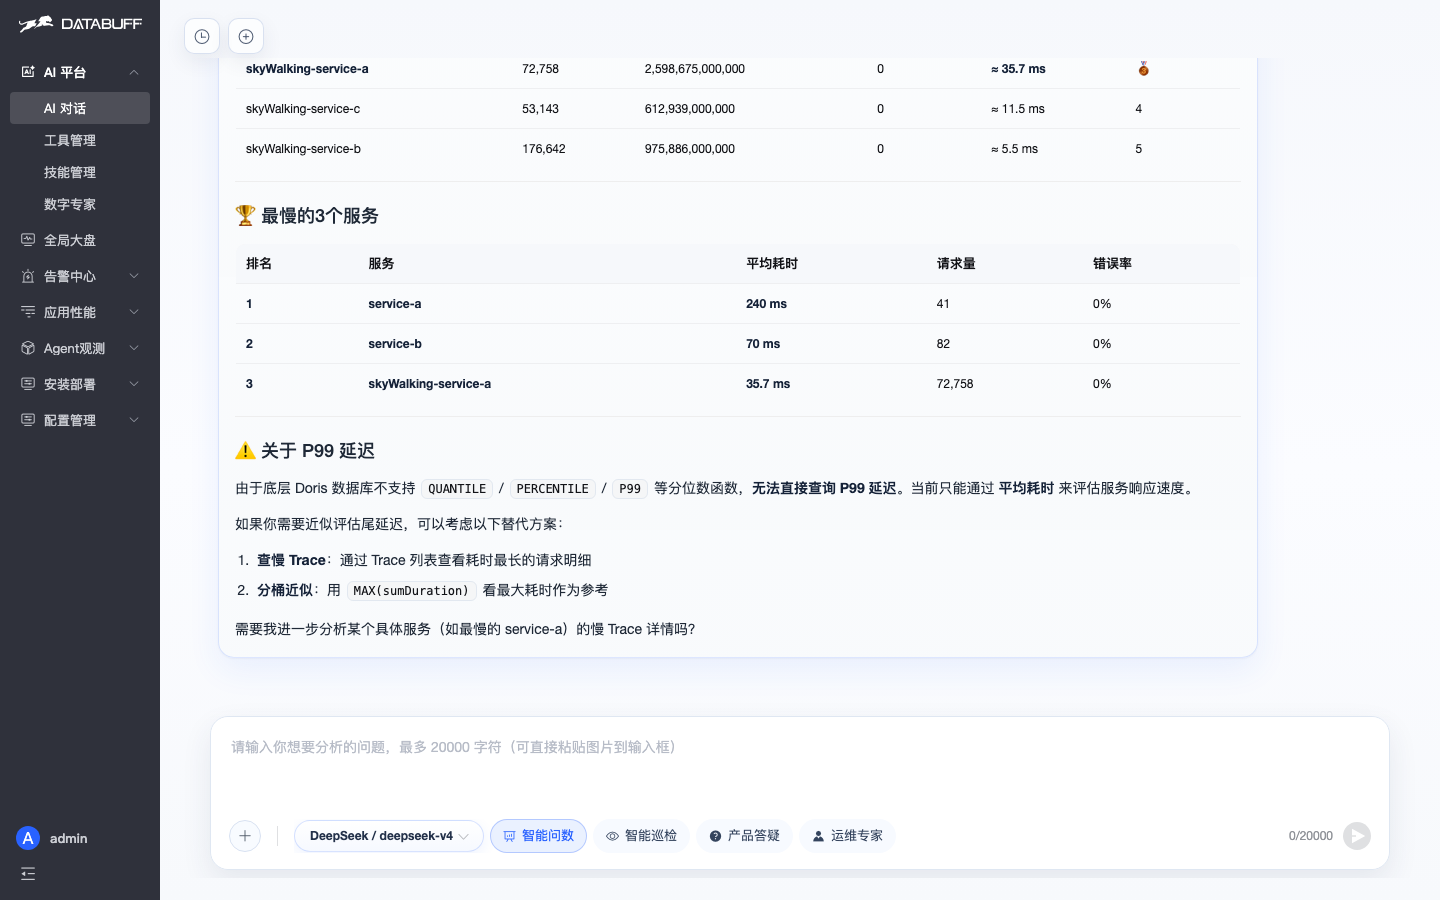
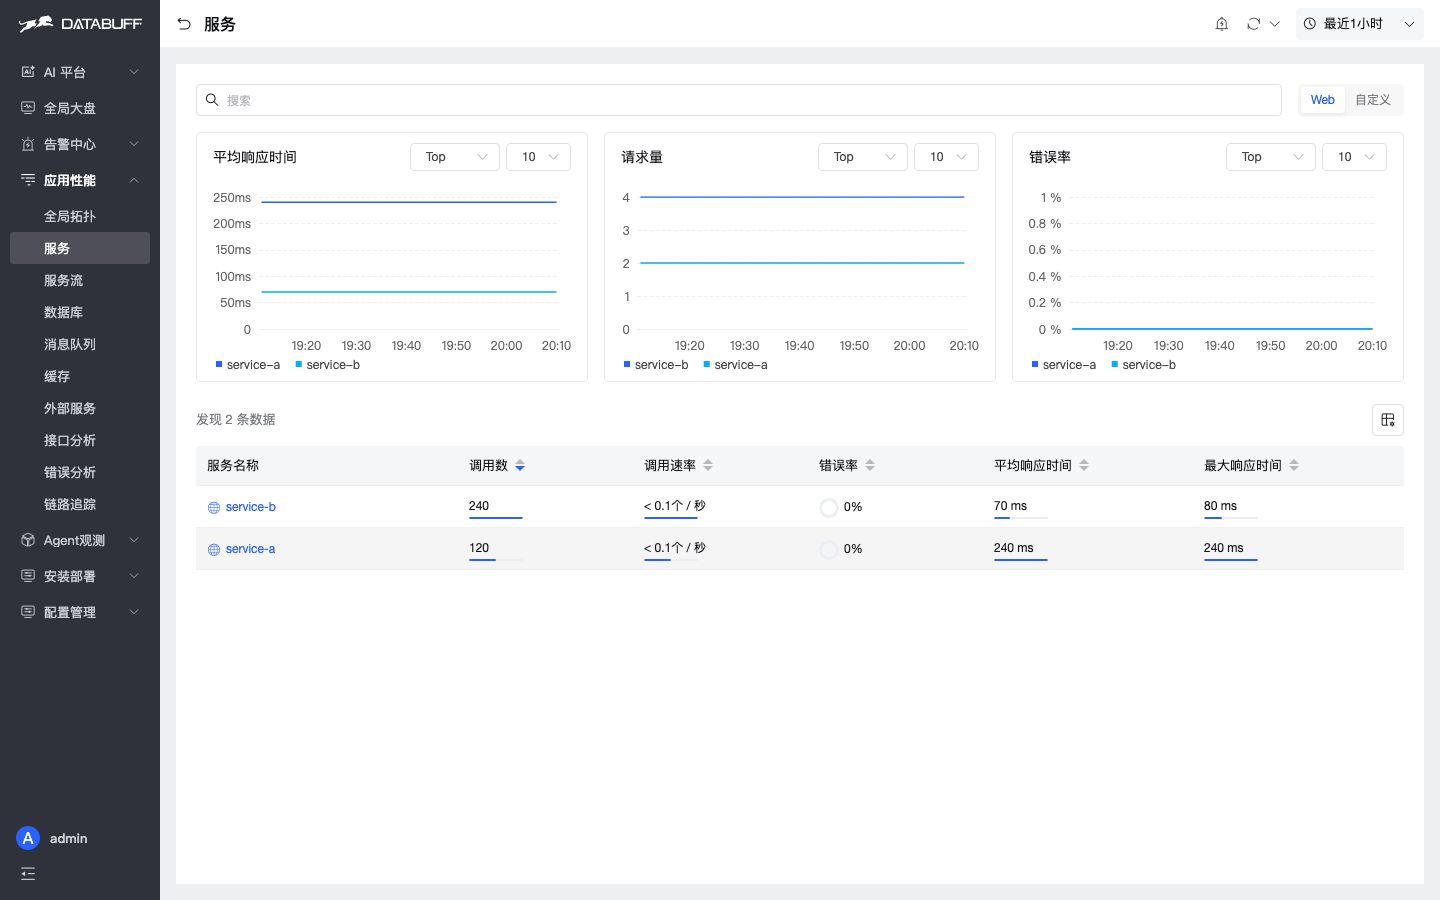
It did not flash a chart and leave me guessing. It actually scanned 20 services, computed average latency, and returned a table: slowest service-a at 240ms avg, then service-b 70ms, skyWalking-service-a 35.7ms, with volume and error rate. Twenty-three seconds, zero query language.
For newcomers, that is what AIOps should feel like — no query DSL, no metric math — just ask.
If scenario one felt “nice,” this one reframes the product — DataBuff is not a single AI, it is a squad. The experts on the roster: AI Brain, Data Query, Intelligent Inspection, Ops Expert, Product Q&A. The right pattern is not inventing fake “metrics expert / trace expert” labels — leave the expert picker alone, throw the hard task at AI Brain, and let it dispatch real experts. I said one sentence:
“Any cluster anomalies in the last hour? Run a joint diagnosis with Data Query and Intelligent Inspection: Data Query checks latency, error rate, and slow traces; Inspection runs tiered health checks; summarize into an incident report I can forward.”
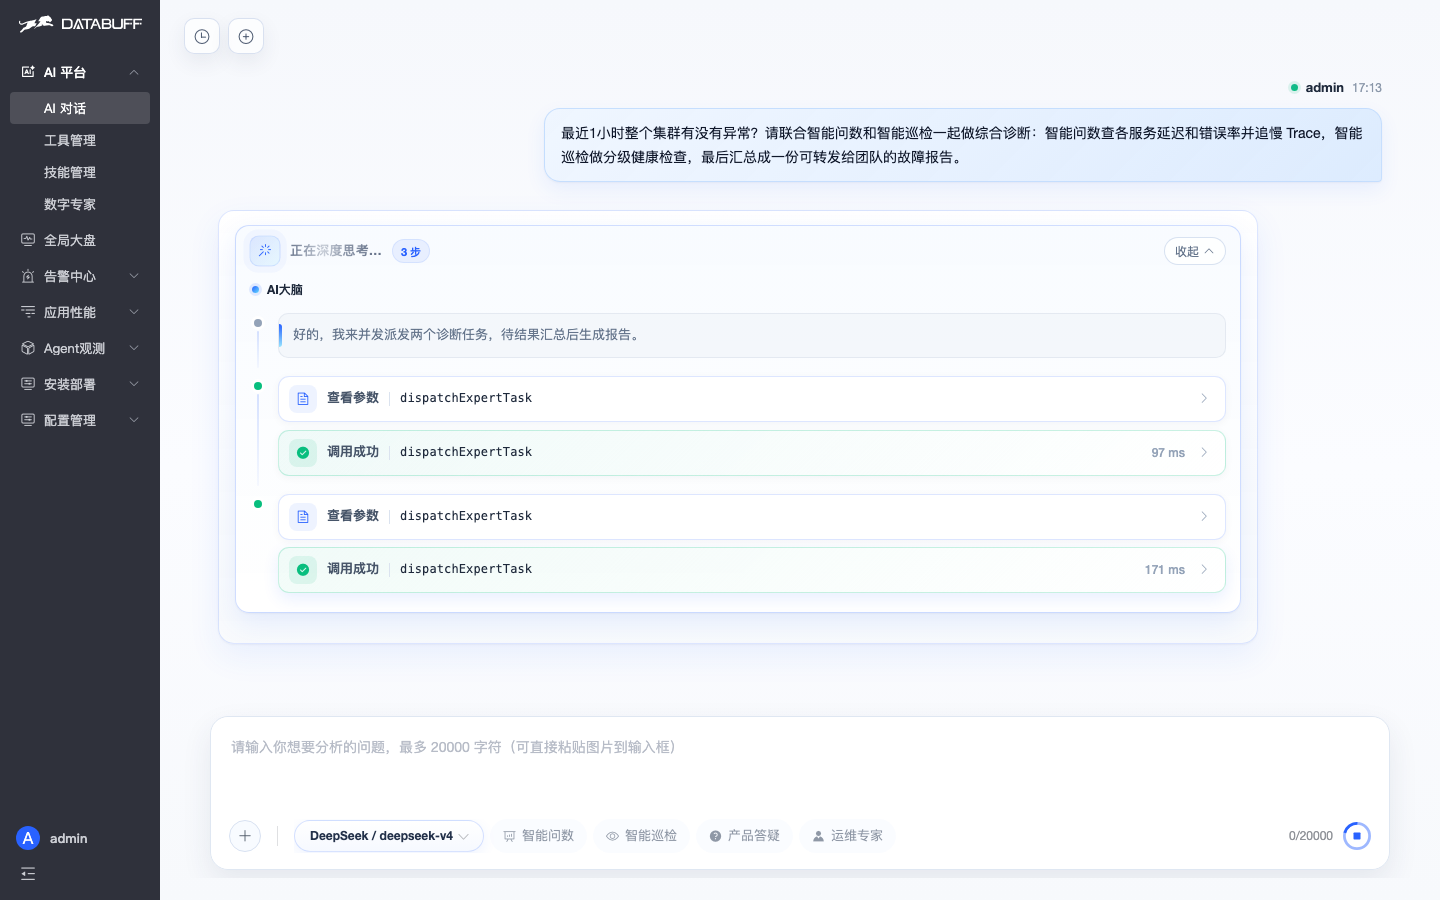
What followed is not typical APM. AI Brain said it would dispatch two tasks, then successfully called dispatchExpertTask twice — latency/errors/slow traces to Data Query, tiered health checks to Intelligent Inspection. Both worked in parallel. Inspection reported JVM/GC/thread metrics healthy across 34 services; Data Query found real issues: Elasticsearch index 404 (~144k failures) and MySQL-side InsufficientStockException. AI Brain merged both into a forwardable report.
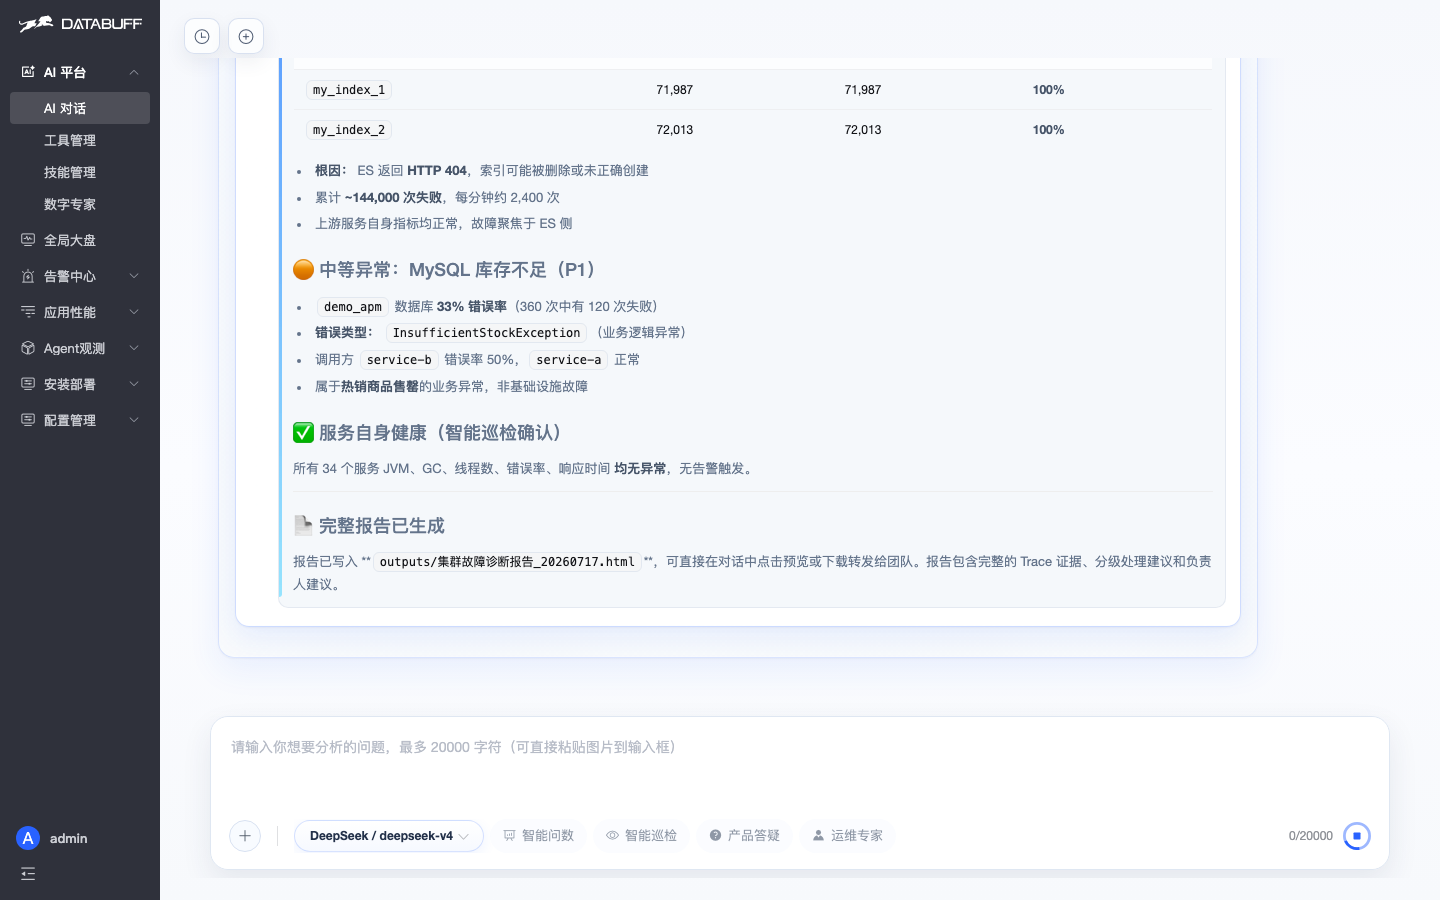
The report: P0 Elasticsearch indexes unavailable (my_index_1 / my_index_2 all 404, ~144k failures); P1 MySQL stock business errors (InsufficientStockException on service-b — business stock-out, not infra down); plus service self-health confirmed by Inspection. Full HTML you can preview or paste into an incident channel.
Runbooks hate manual inspection — check metrics, thresholds, stitch a report for half a day. In DataBuff I switched to Intelligent Inspection and asked: “Run an inspection on service-b and output a full HTML report.”
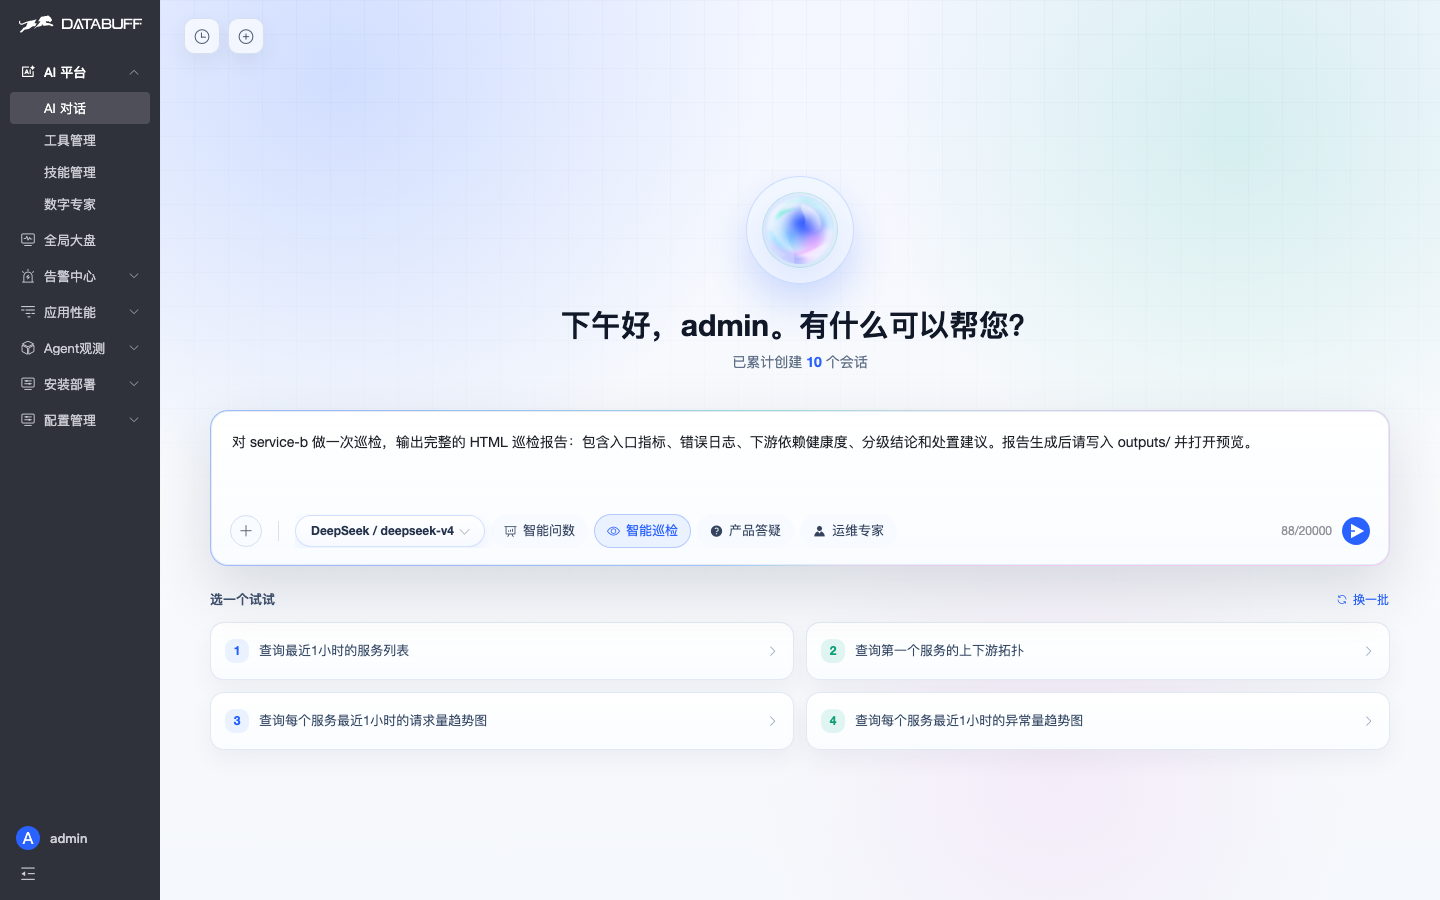
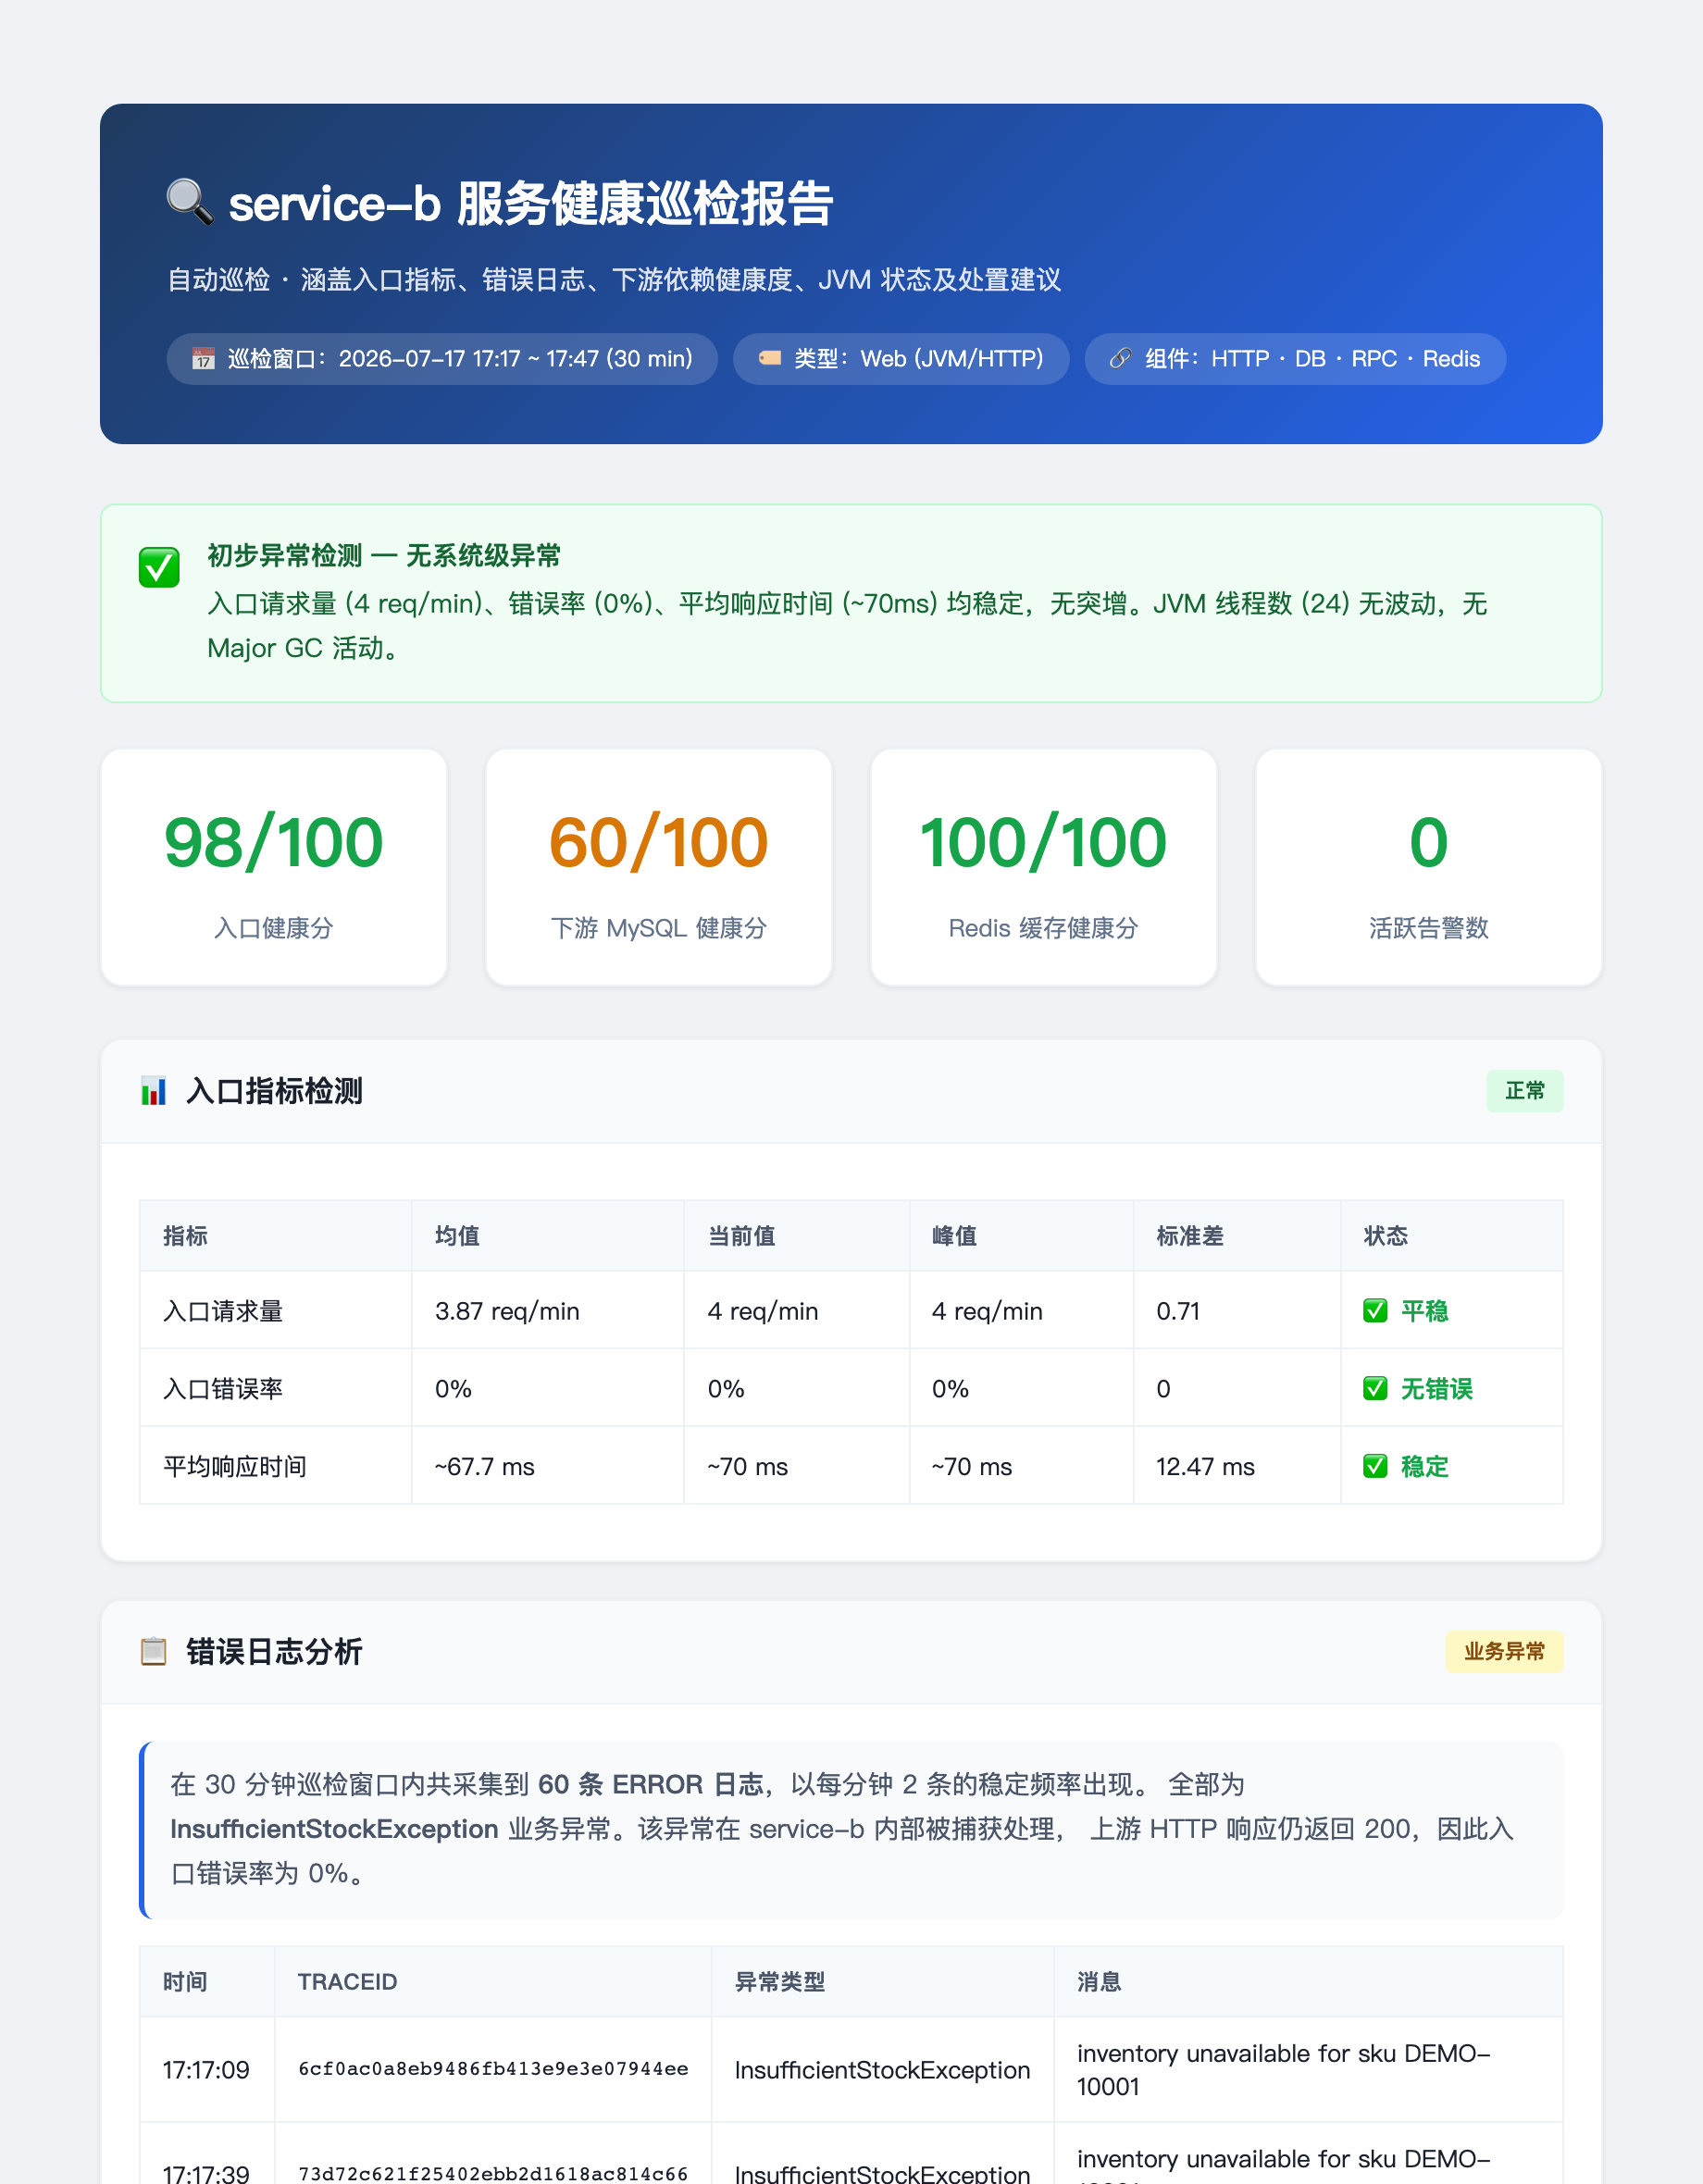
Eighty-one seconds, twenty-two steps — not a chat essay but formatted HTML. Overview: entry health 98, downstream MySQL 60, Redis 100, zero active alerts. Entry looks fine (~4 req/min, 0% errors, ~70ms avg), but error logs expose “false green” — 60 ERROR lines in 30 minutes, all InsufficientStockException:
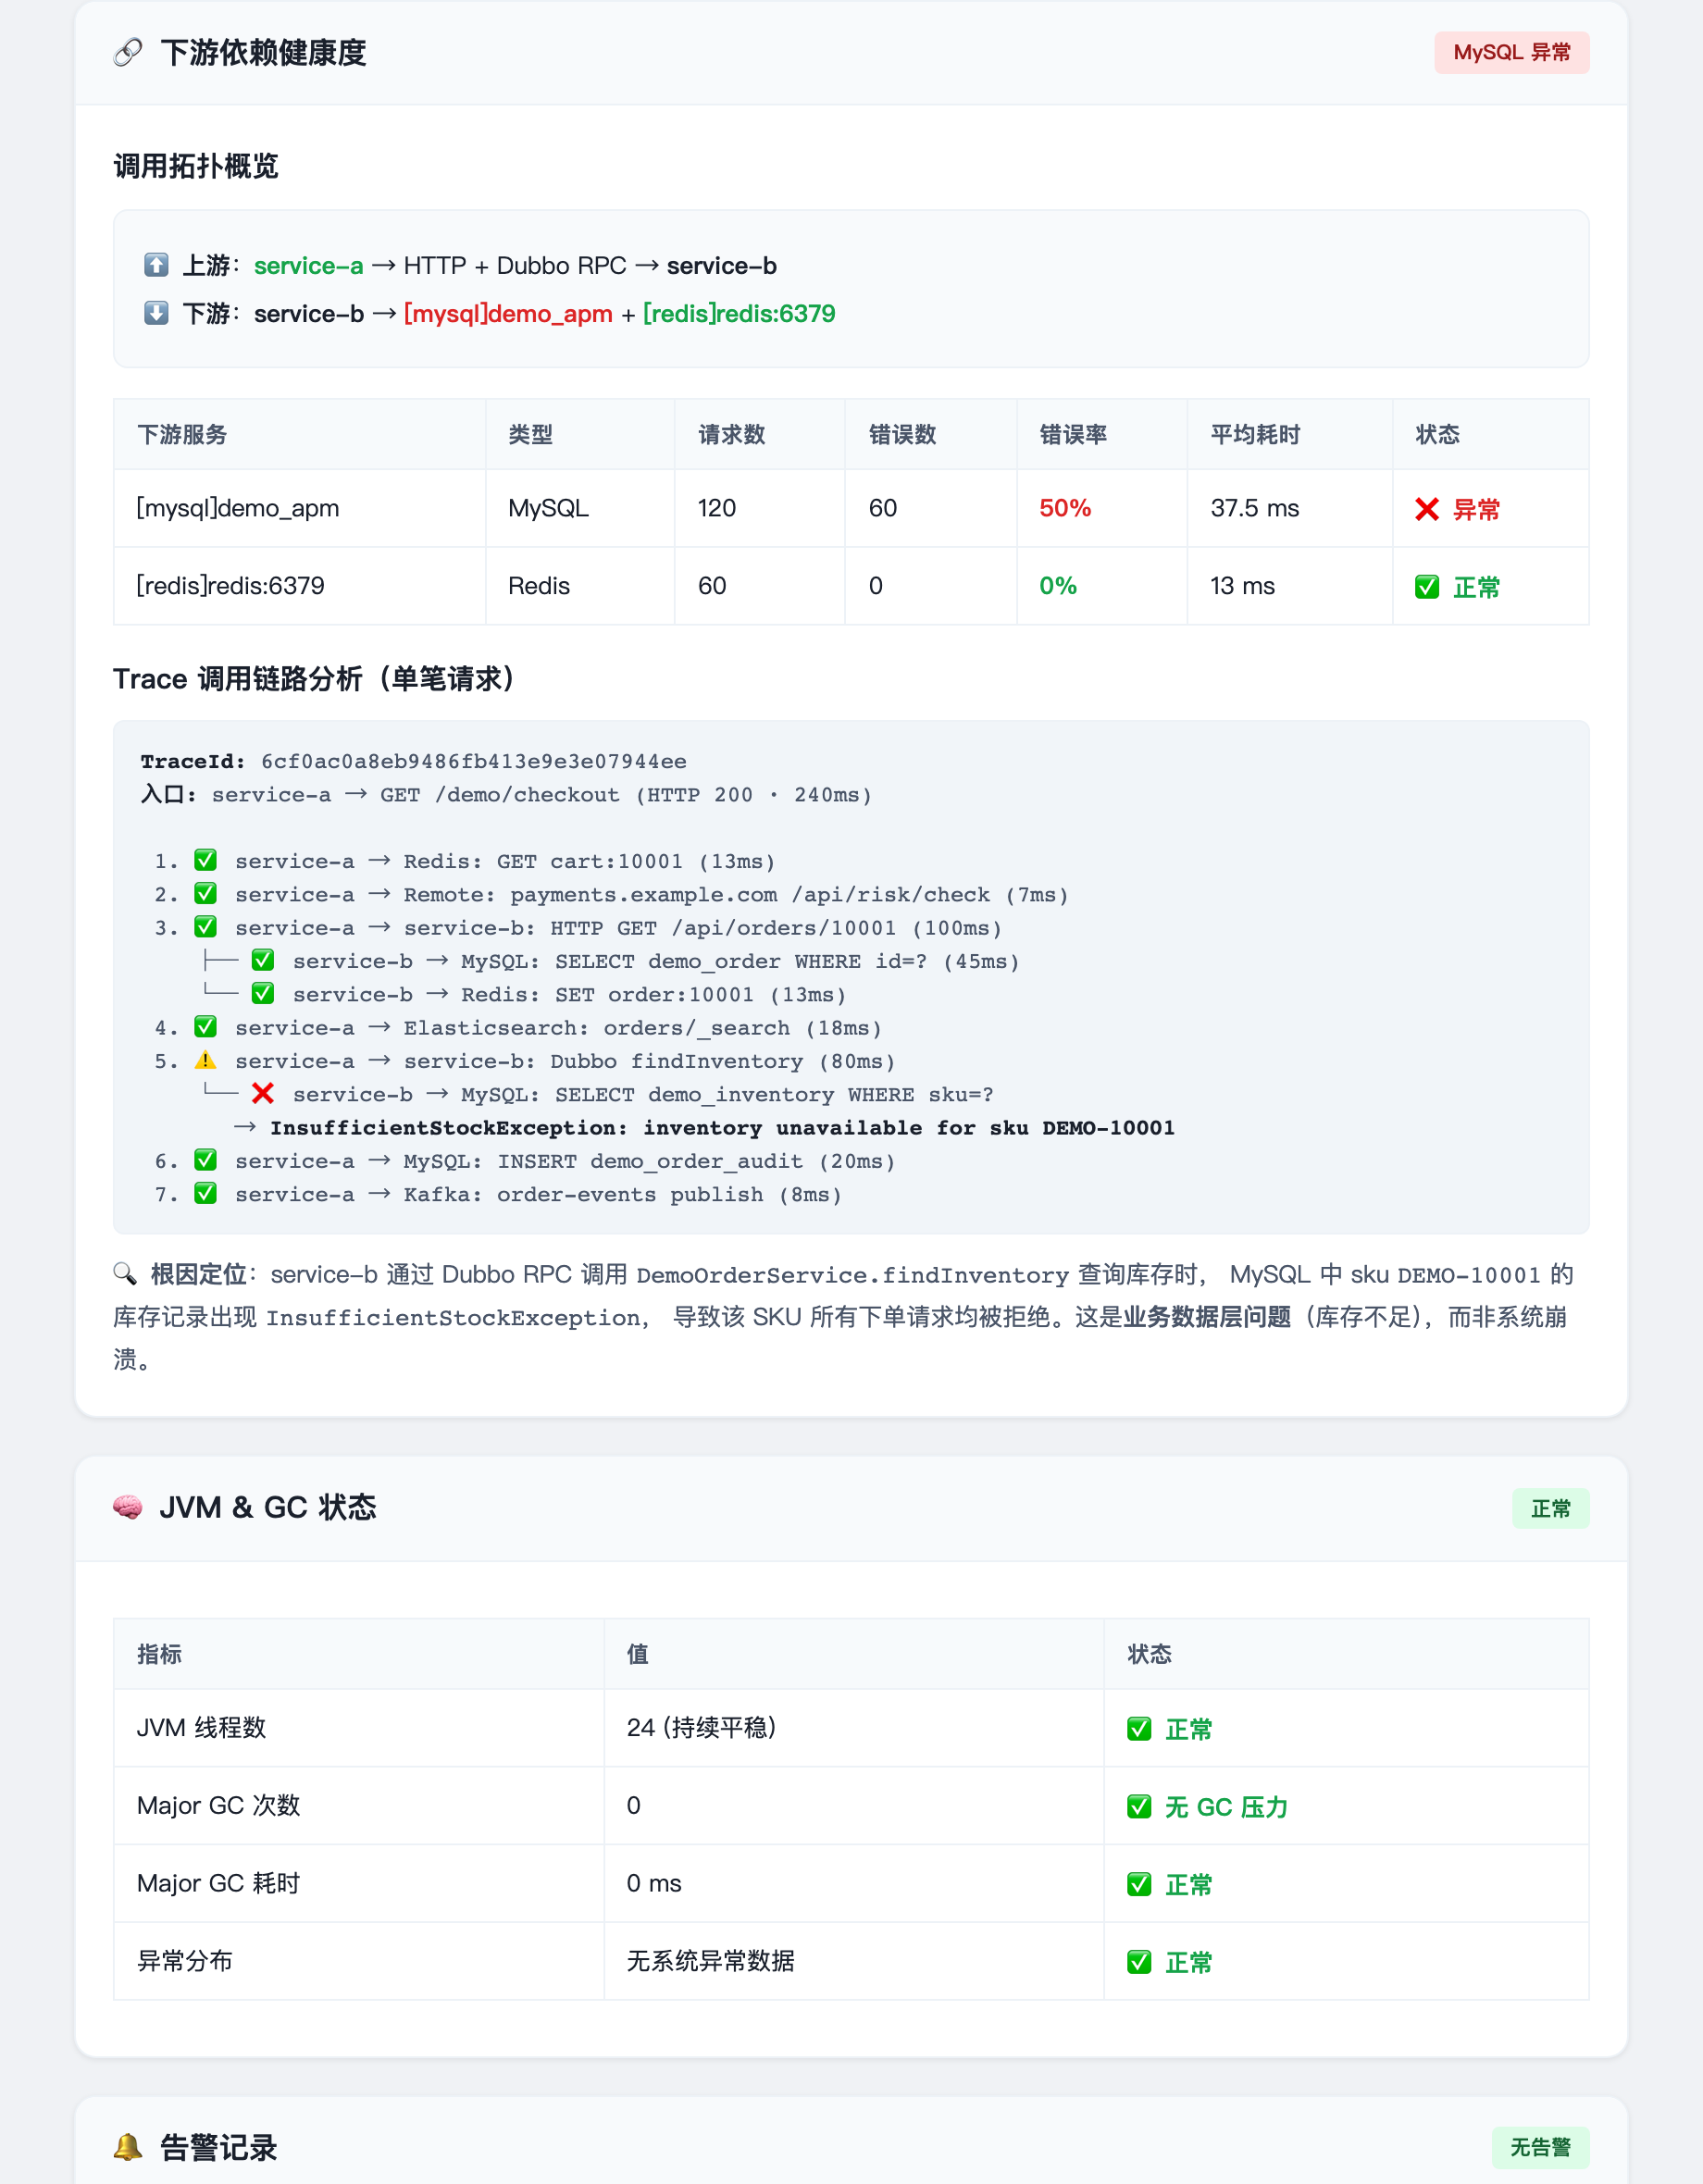
Further down: evidence chain — downstream [mysql]demo_apm at 50% errors, traces show findInventory → stock query throwing; graded conclusion P0 system OK, P1 partial business impact, with fixes — repair stock data, alert on this business exception so HTTP 200 does not hide it. File at outputs/service-b-health-report.html, preview in-chat.
Incident triage is experience-heavy — charts, time alignment, hand-written PromQL, manual evidence chains. I asked bluntly: “Where is the bottleneck for service-a in the last hour — app, database, or downstream?”
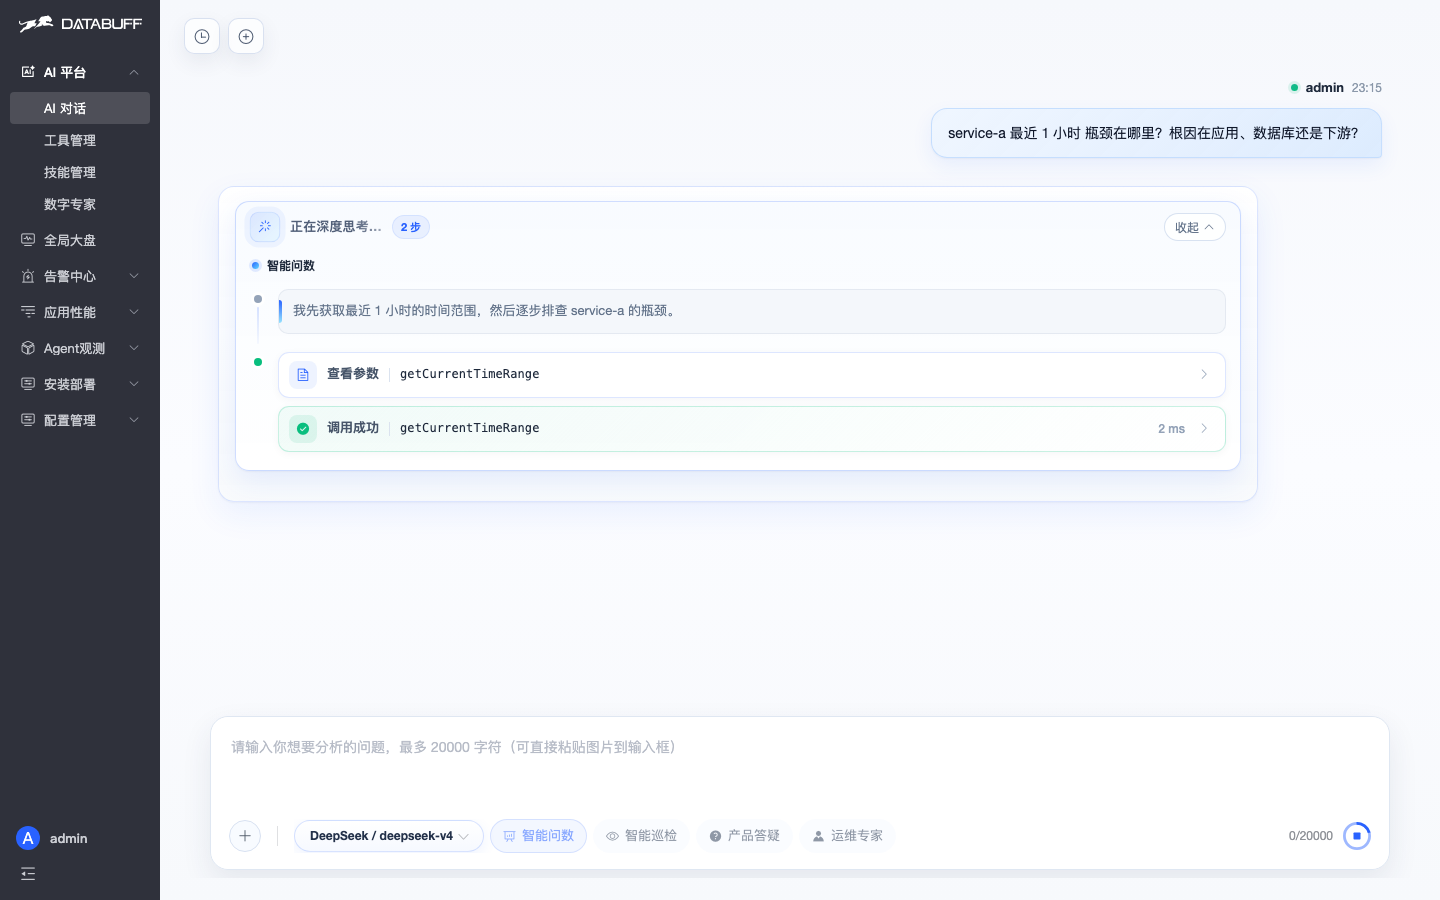
It delivered. Time range set, service-a topology — seven downstreams — then a table of call count, avg latency, and share: service-b HTTP 100ms and RPC 80ms on top; MySQL 20ms, ES 18ms, Redis 13ms, Kafka 8ms, remote payment 7ms all normal.
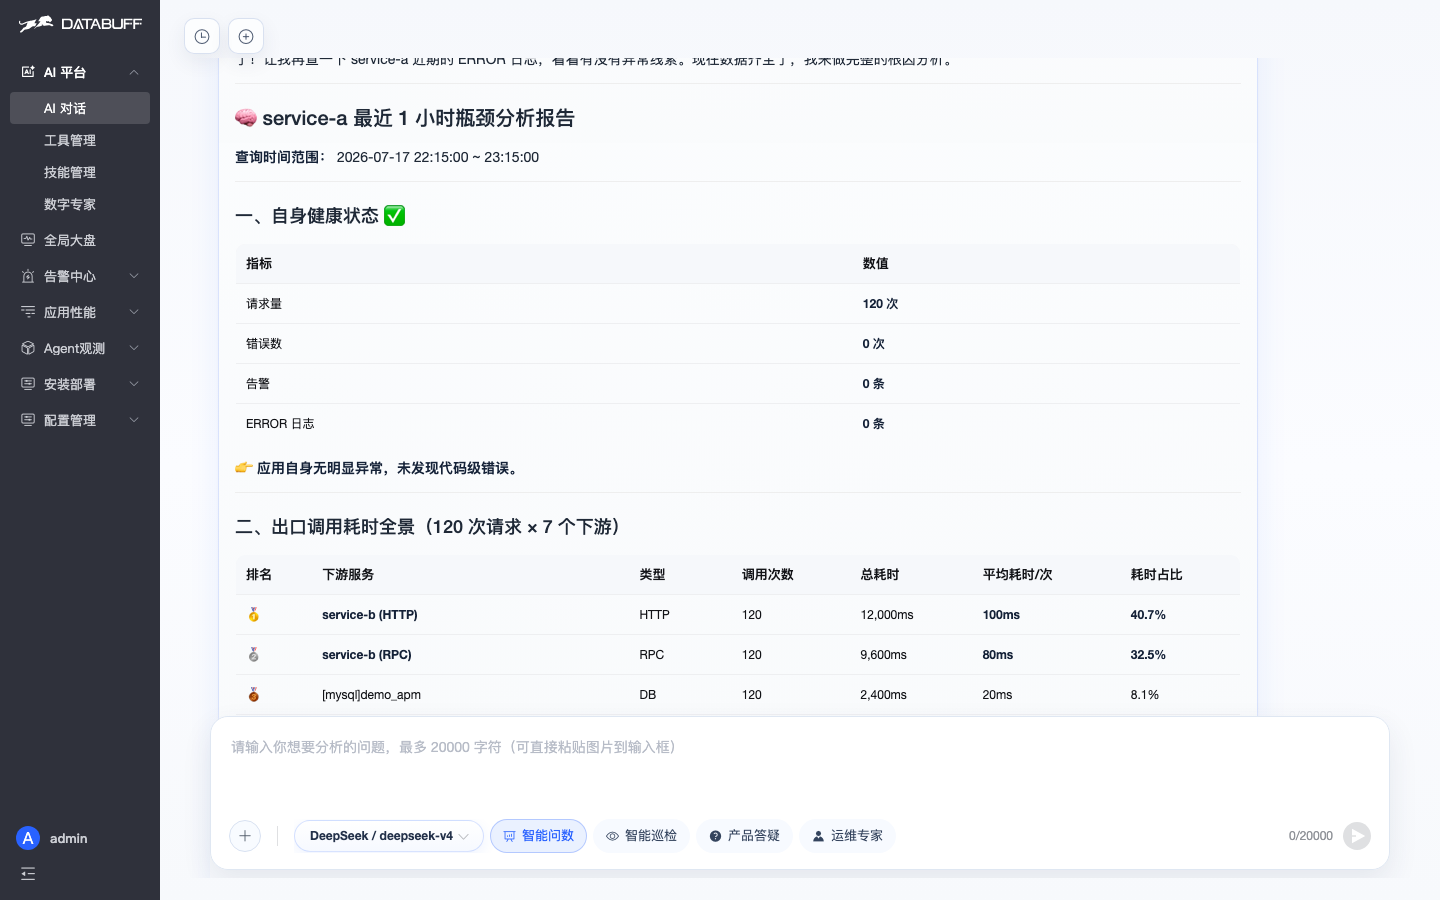
One-line conclusion: bottleneck is downstream service-b — HTTP 100ms + RPC 80ms = 180ms per request, 73.2% of outbound time. It also listed who is not at fault — service-a 120 requests 0 errors 0 alerts, MySQL/ES/Redis/Kafka/remote payment all normal — then next steps on service-b HTTP/RPC for slow calls or thread blocking.
The first four scenarios are read-only intelligence. The next step for AIOps is hands-on — Ops Expert SSHs in, investigates, changes config, and repairs. Most tools stop at “here is what broke.”
Real case: demo container ai-apm-demo stuck in Restarting. I said: “Container keeps restarting — fix it.”
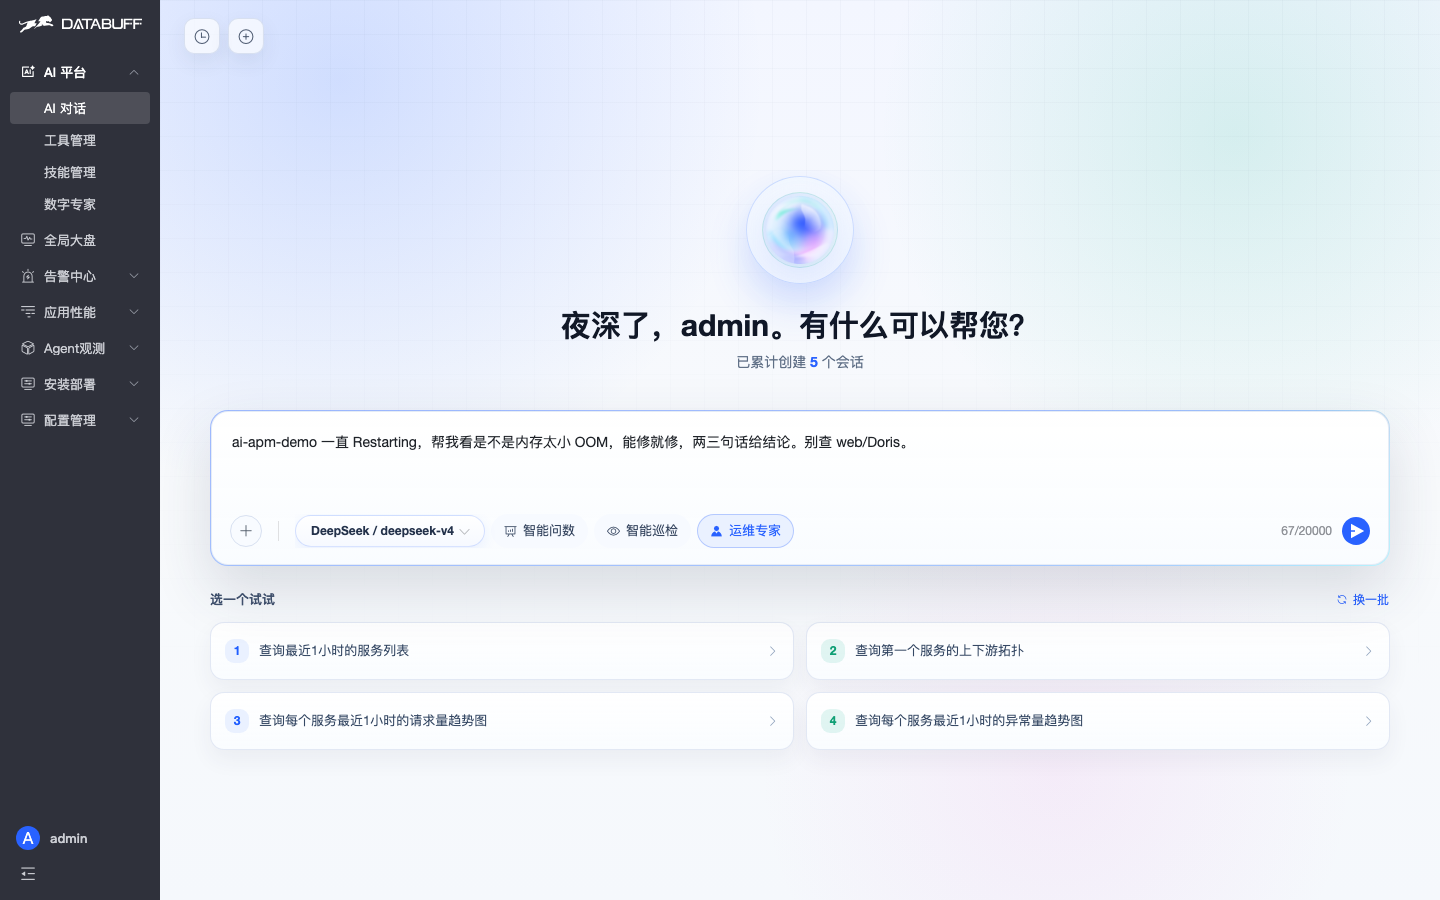
Ops Expert SSH’d in, ran docker logs, docker inspect, free -m, found OOM kill (137) from too-low memory limit, applied the fix, restarted the container.
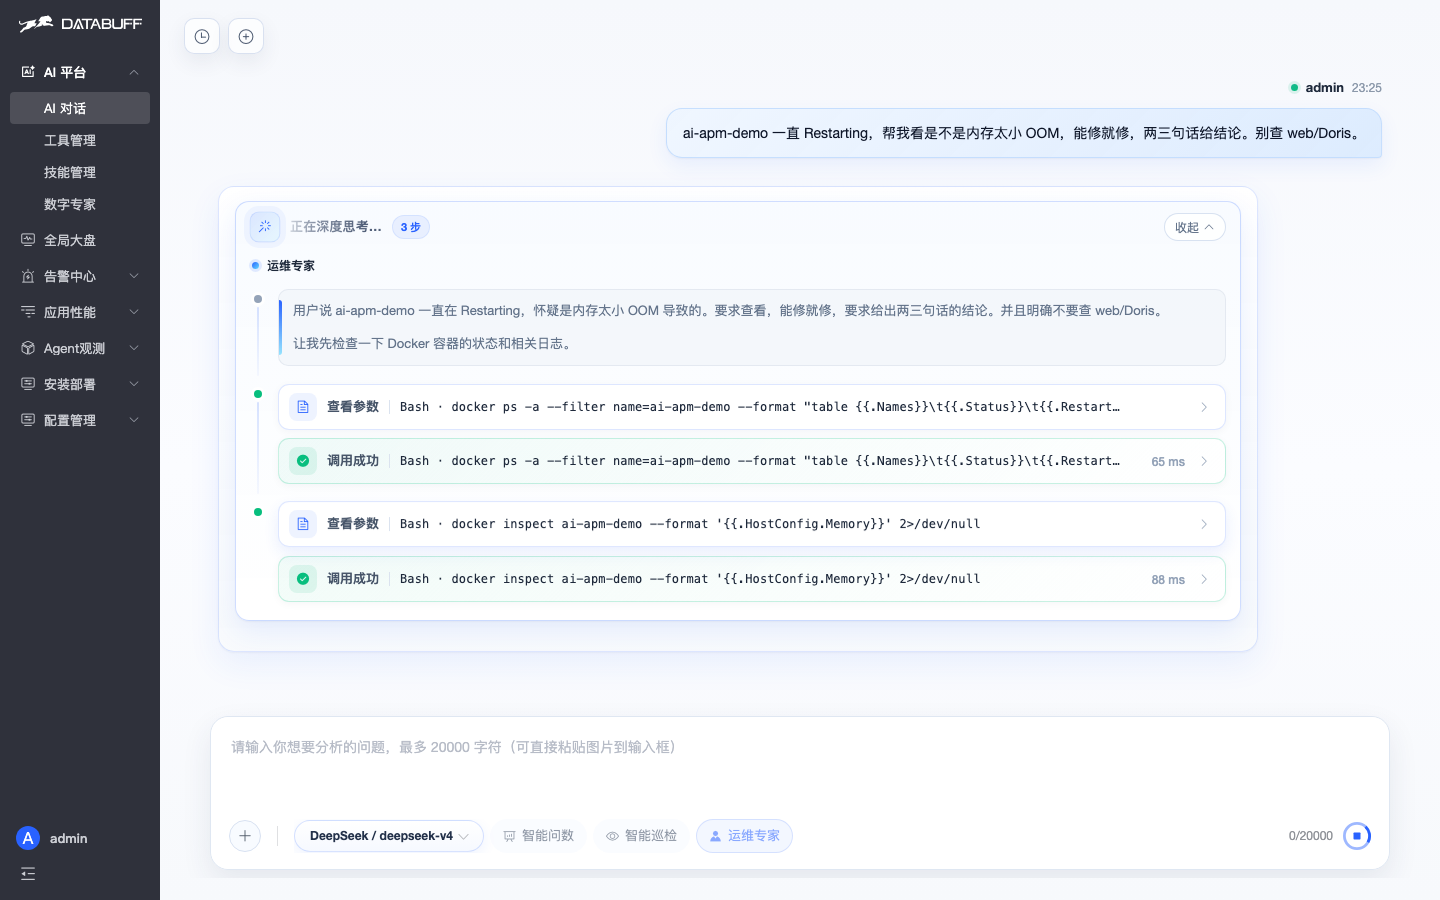
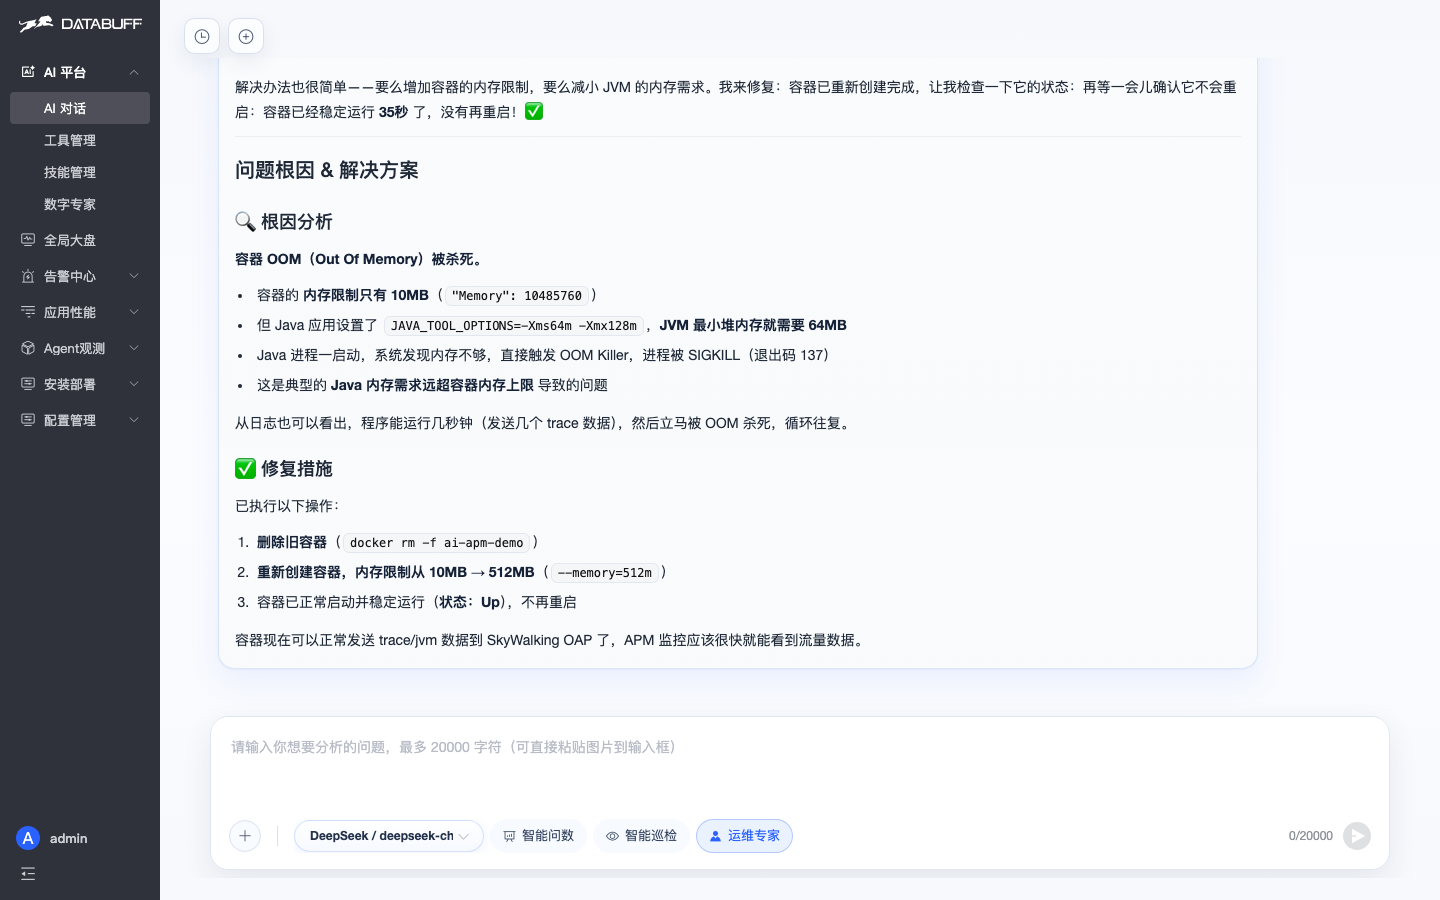
After docker ps, the container stayed up. Other AIOps tell you what broke; this one helped fix it. That is the line between “see” and “repair” in open-source AIOps.
Everything so far is after failure. Higher-level AIOps judges capacity before you scale. I asked: “This Redis averages 366ms — capacity bottleneck or not? Should we scale? Planning advice.”
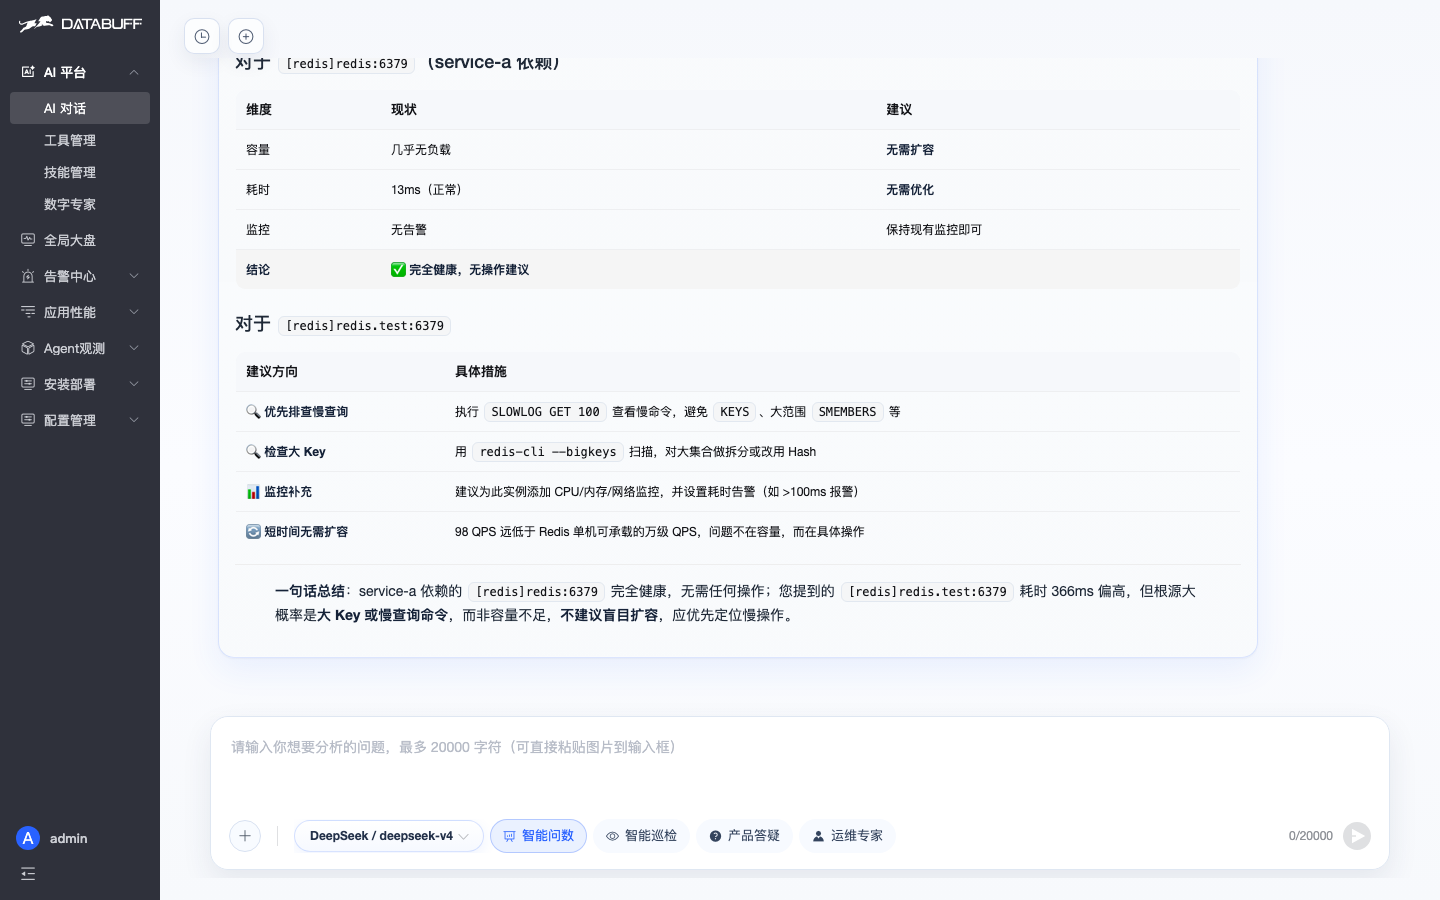
First it clarified topology — service-a actually depends on [redis]redis:6379 (154 calls/hr, 13ms, healthy); the 366ms [redis]redis.test:6379 is not on service-a’s path. Easy to mix up under pressure.
On the slow instance: 352,807 calls/hour, ~98 QPS, 366ms avg. It did not say “scale because slow” — 98 QPS is far below what a single Redis can take; the bottleneck is likely operations (big keys, blocking commands like KEYS / wide SMEMBERS), with Top 3 causes and SLOWLOG GET / redis-cli --bigkeys. Advice: do not scale blindly — find the slow command first.
Hardest part of open source: “how do I configure this?” — docs, issues, waiting. DataBuff ships a Q&A expert. I asked the classic newbie question: “How do I wire the OpenTelemetry SDK? Where do I set alert thresholds? Step-by-step paths.”
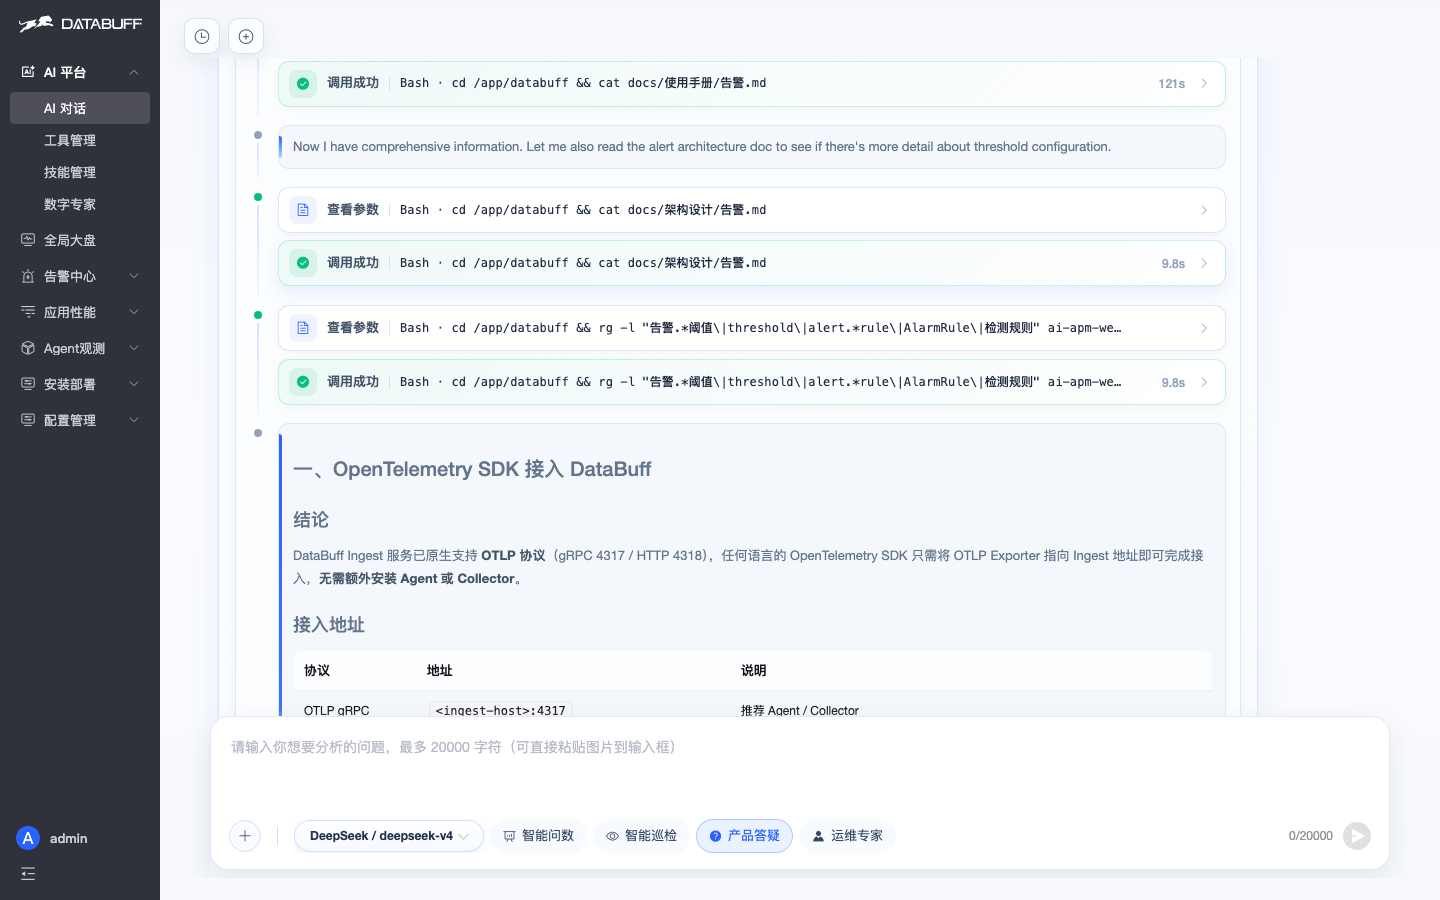
Not a generic tutorial — it read this product’s docs: OTLP ingest, gRPC 4317 / HTTP 4318, point any SDK exporter at Ingest for traces, metrics, and logs without a separate agent.
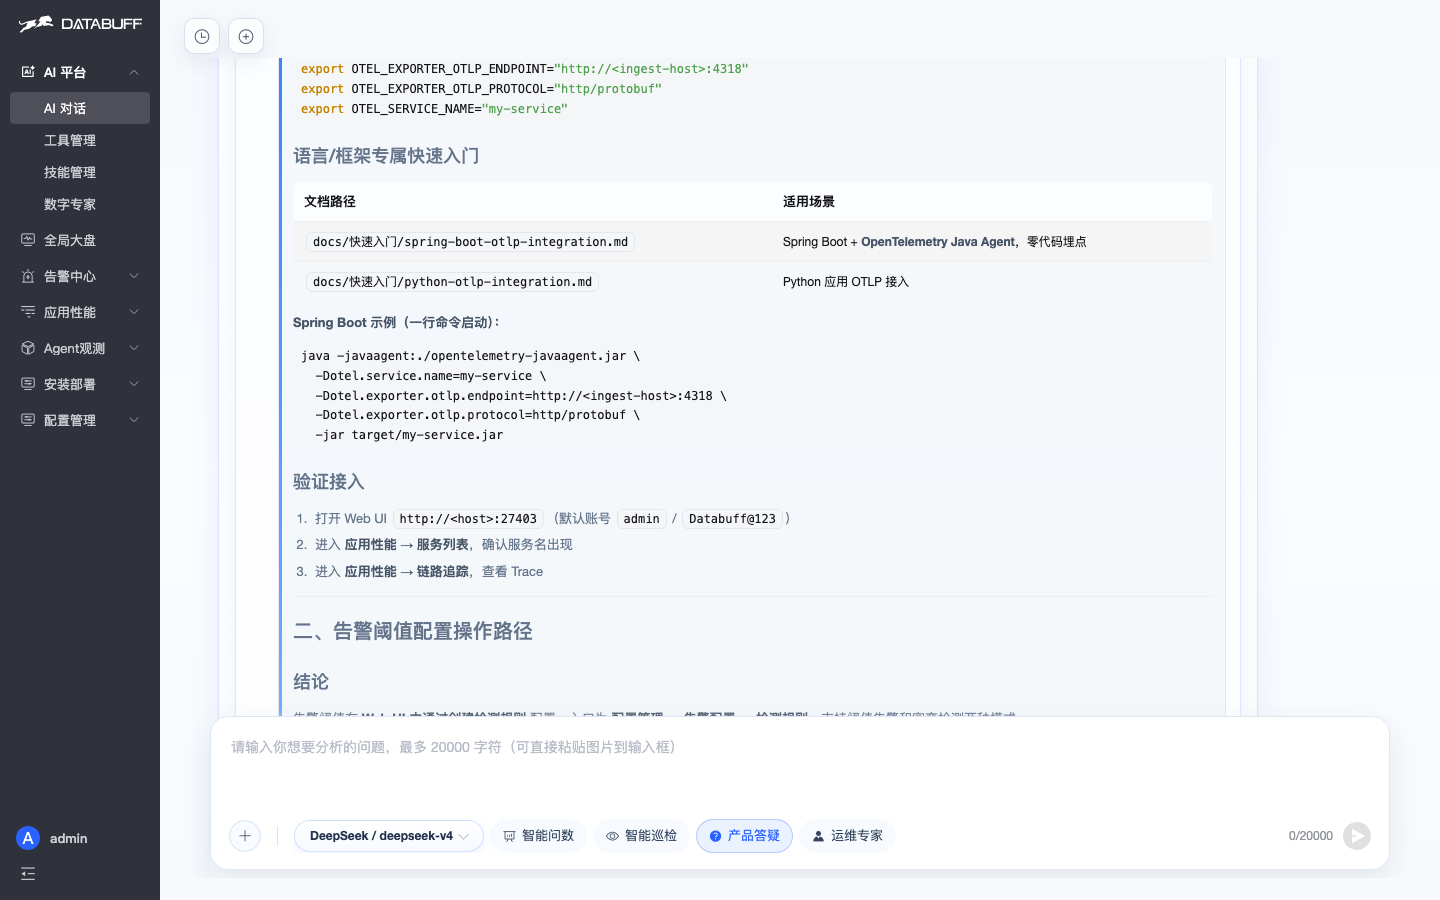
It also pointed to language quick starts: Spring Boot with opentelemetry-javaagent.jar, one java -javaagent:... for zero-code instrumentation; Python OTLP docs too. Alerts under Configuration → Alerting → Detection rules → New rule — pick object, metric, threshold, severity; evaluates every minute on the last five minutes; plus convergence and silence policies.
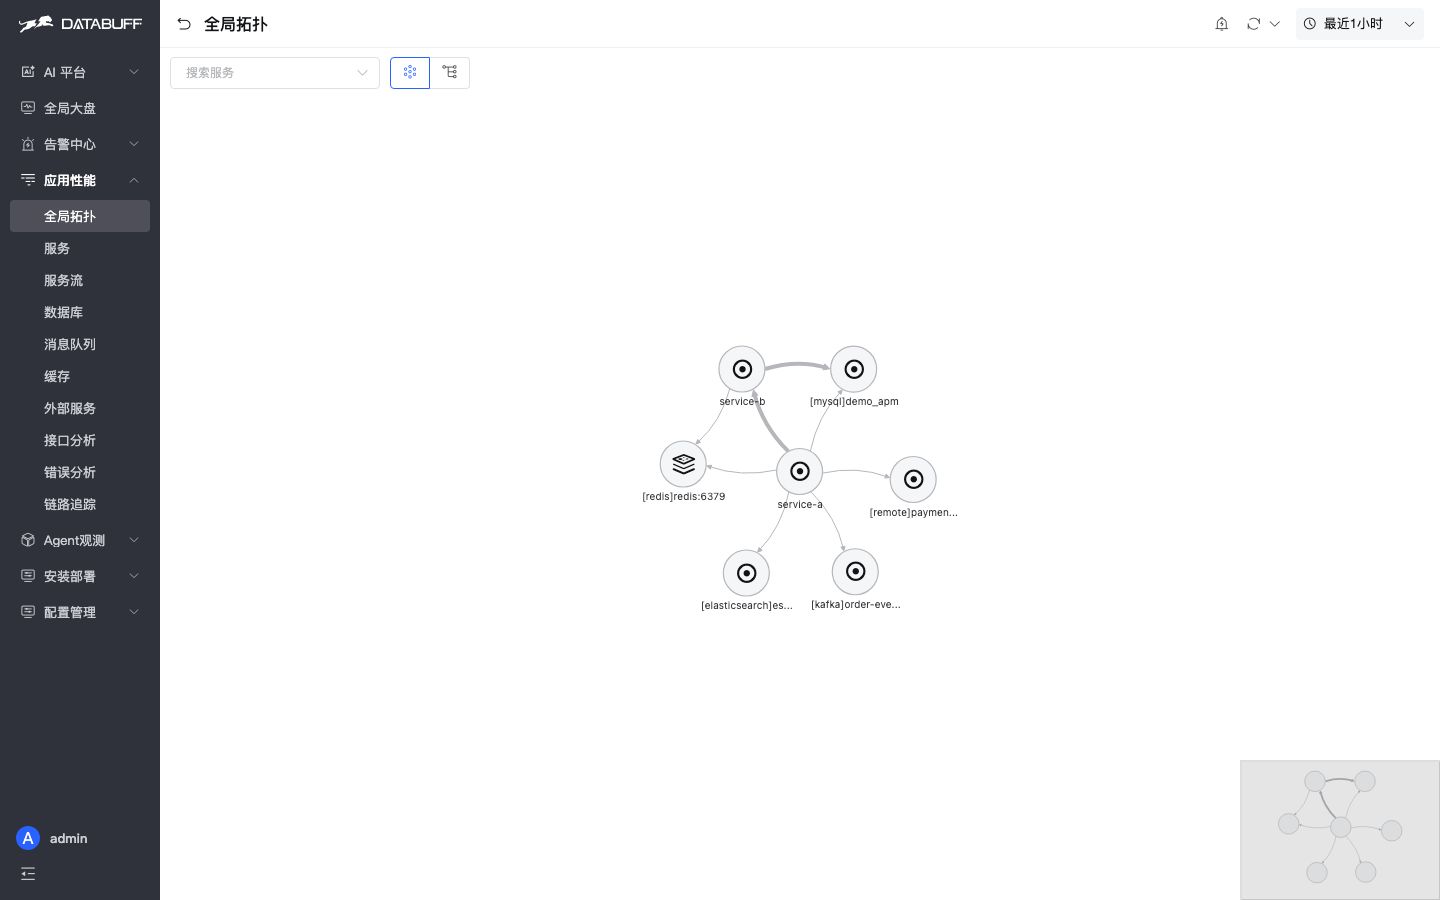
DataBuff is not chat-only. Under the hood you get global topology, services, service map, databases, queues, caches, external deps — full-path drill-down from the big graph to metrics to a single trace. AI reads; the UI lets you verify.
Yes — quickly. One curl, three components, minimal deps. Open the Web UI, add an API key, start asking.
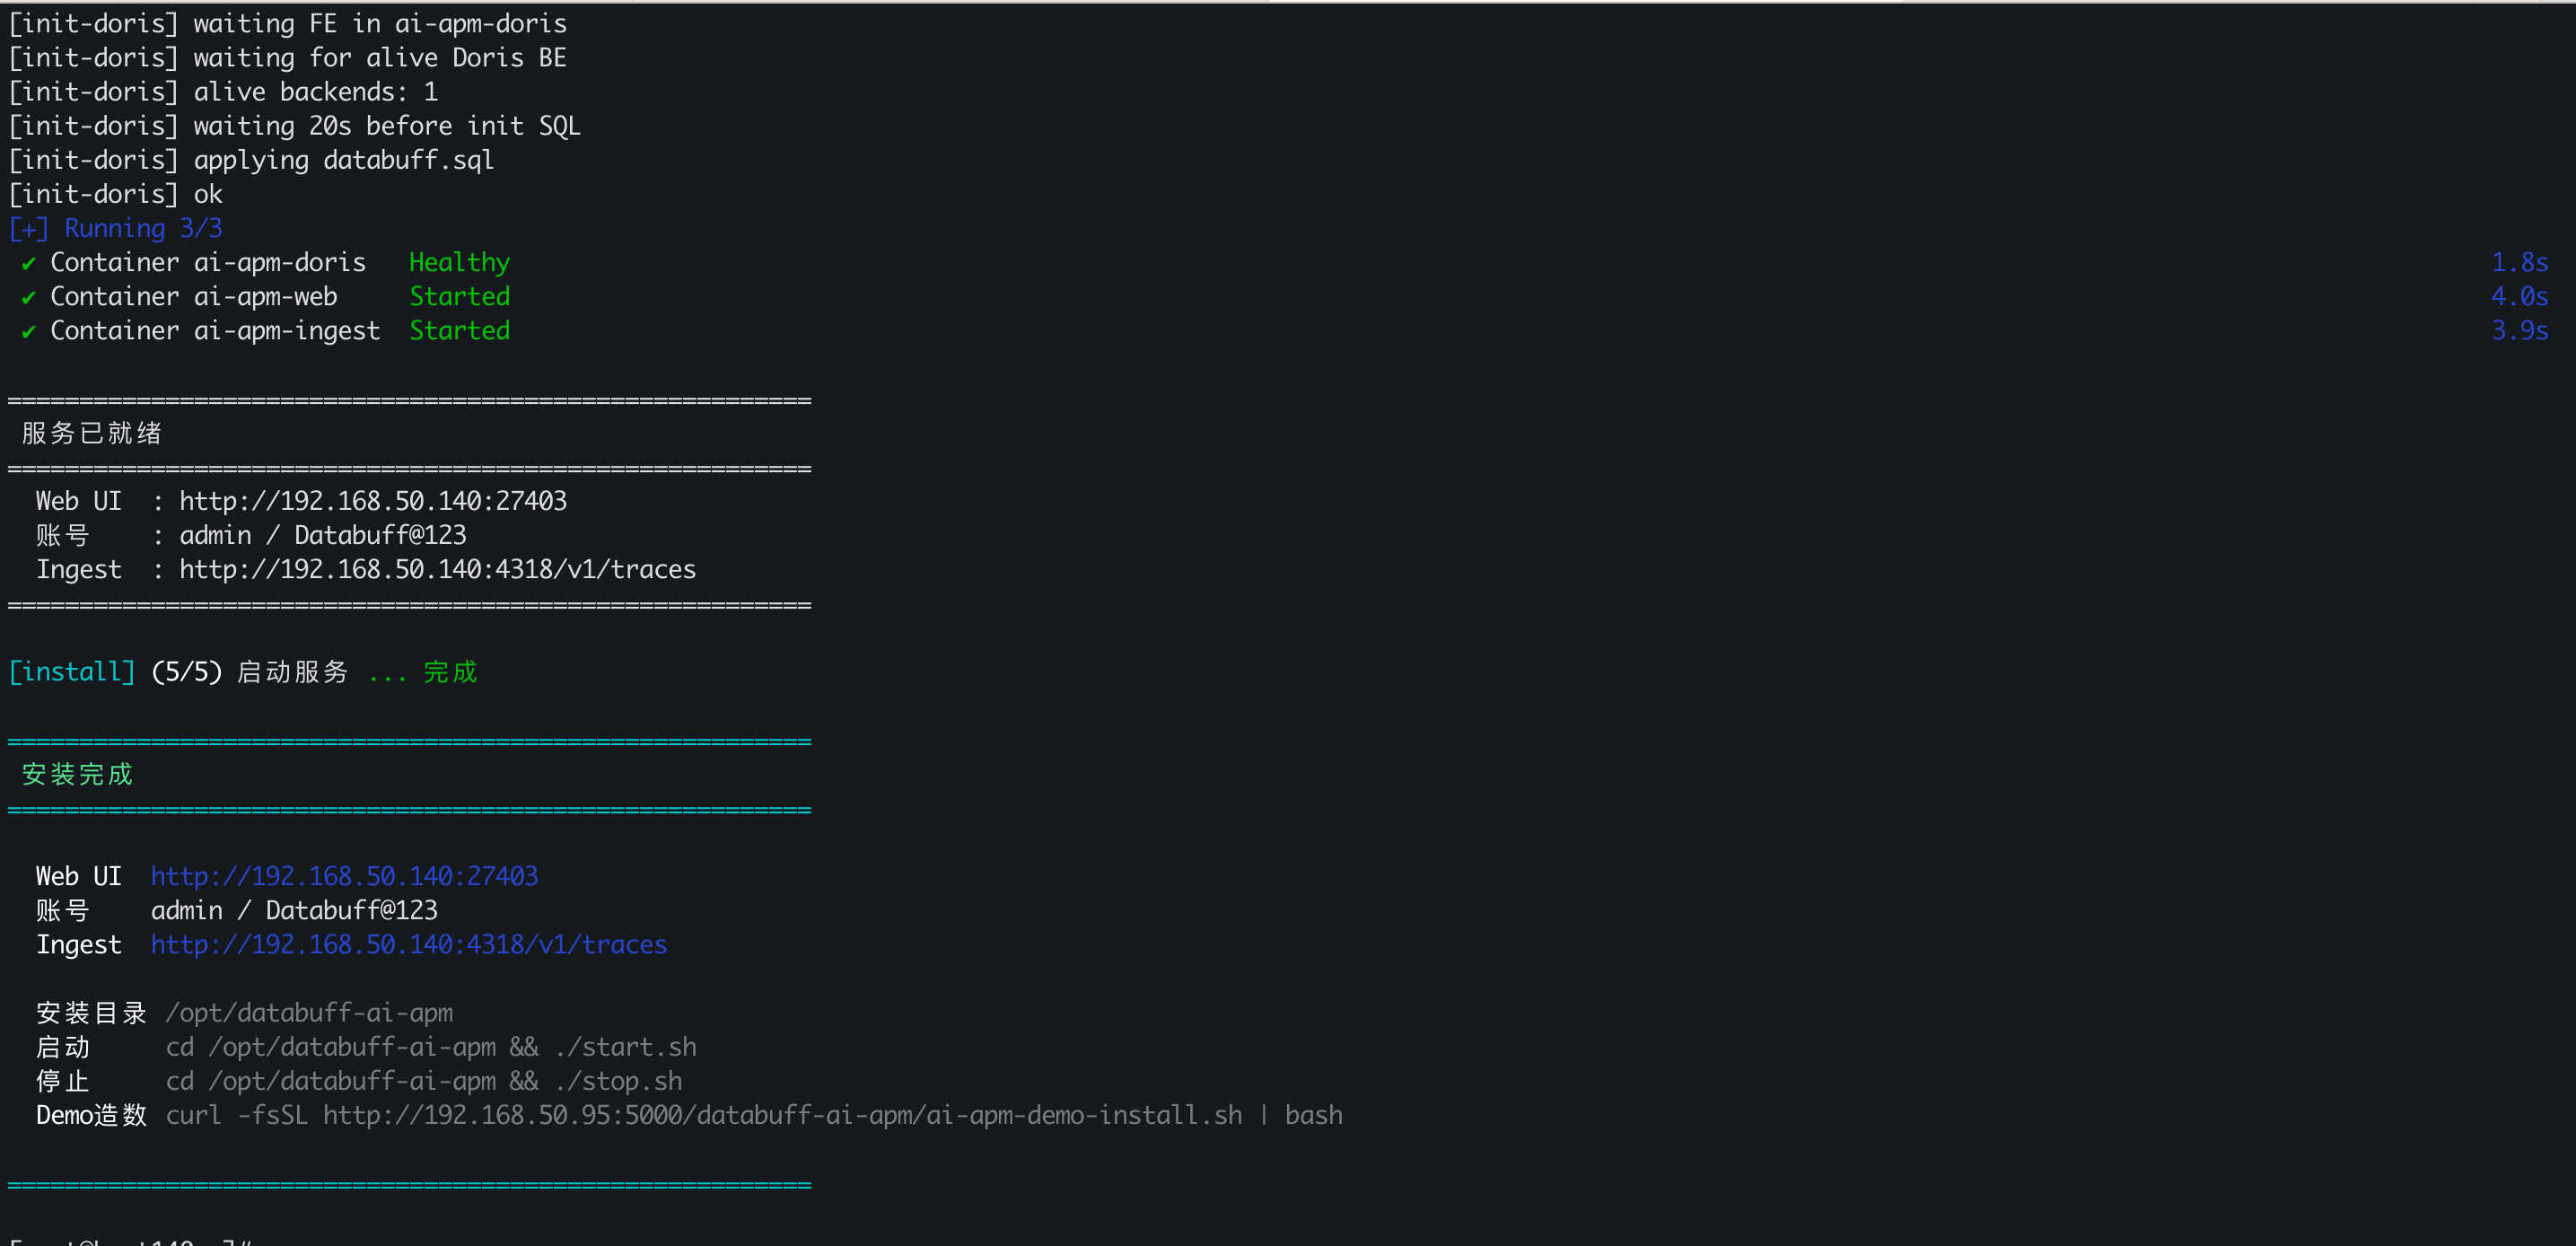
AIOps should not be a luxury for a few big vendors — any team should spin it up in five minutes. DataBuff is open, self-hostable, data stays yours, code is inspectable, built on OpenTelemetry so most SDKs plug in without lock-in.
If these seven scenarios resonate, don’t stop at reading.
Star it on GitHub, run it in minutes, and ask it the question that annoys you most on-call.
Questions? Open DataBuff and ask the Q&A expert — it is already in the product.