1Meet DataBuff: AI-native OpenTelemetry APM
DataBuff (github.com/databufflabs/databuff) is an open-source AI-native OpenTelemetry APM — deploy with one Docker command.
📊 OpenTelemetry APM foundation
- Native OTLP — traces, service metrics, topology, alerting
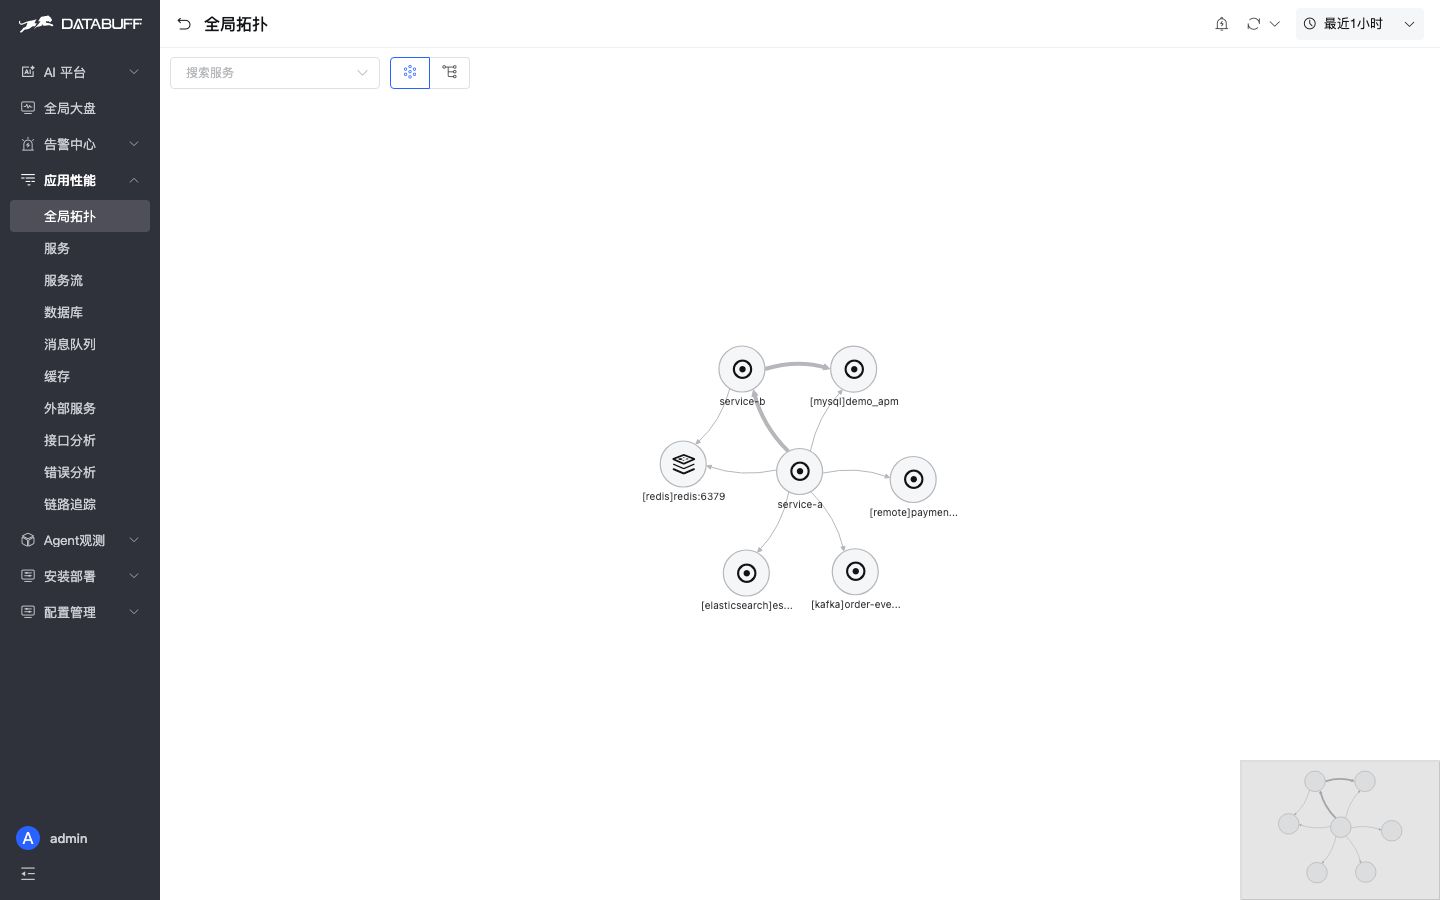
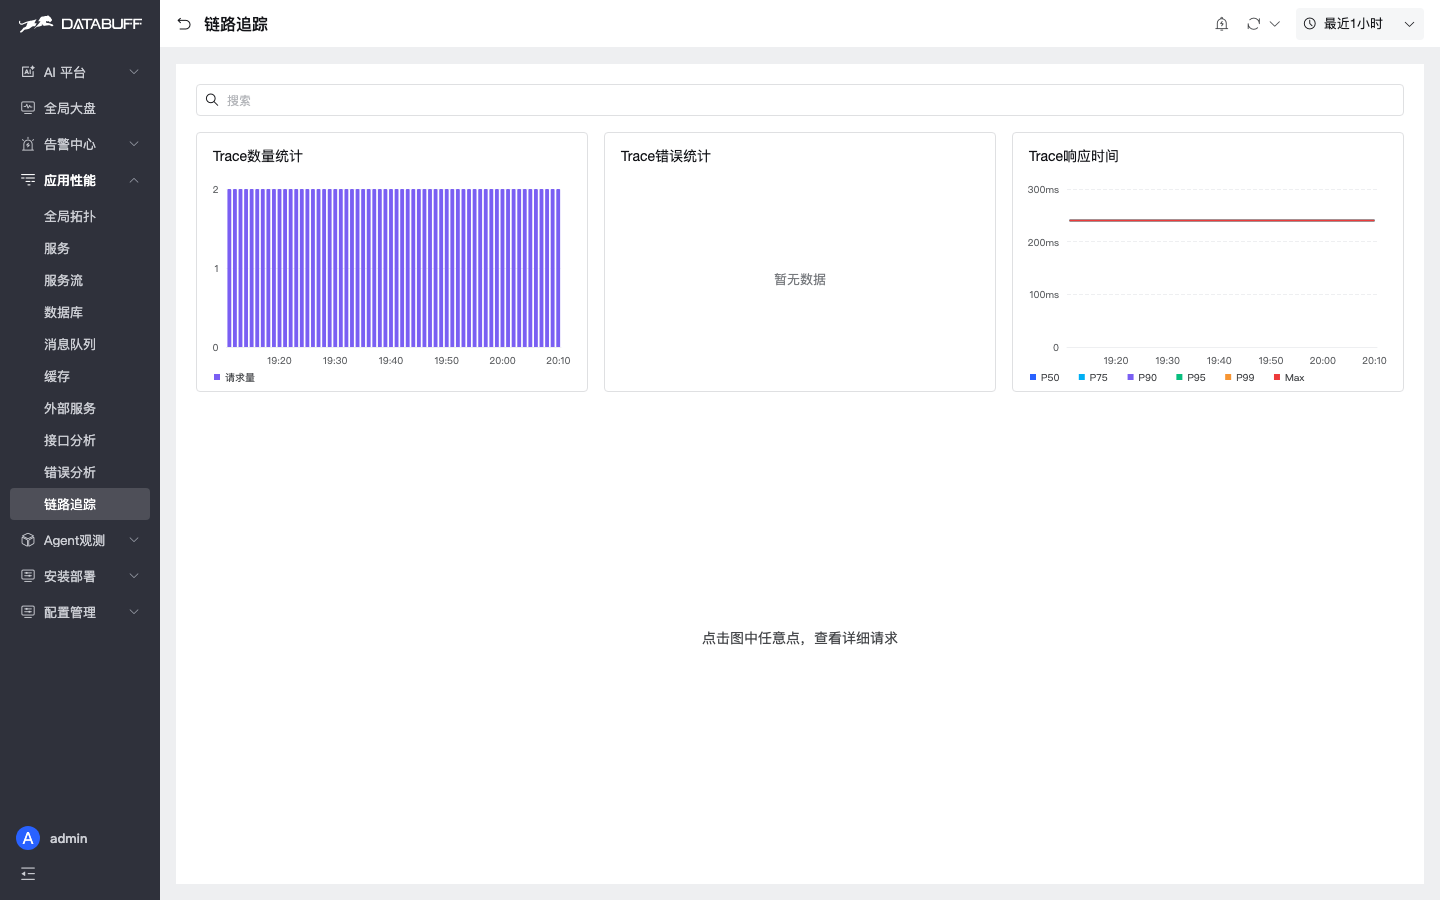
- Rich data model derived from traces (services, APIs, flows, component metrics)
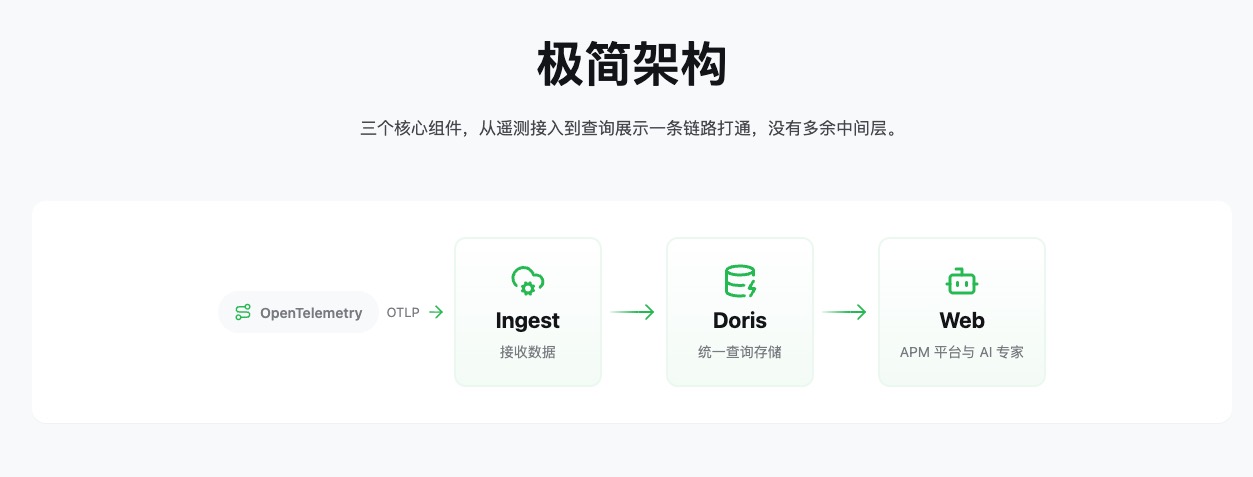
- Three components: Ingest → Doris → Web, low ops overhead
🤖 AI-native capabilities
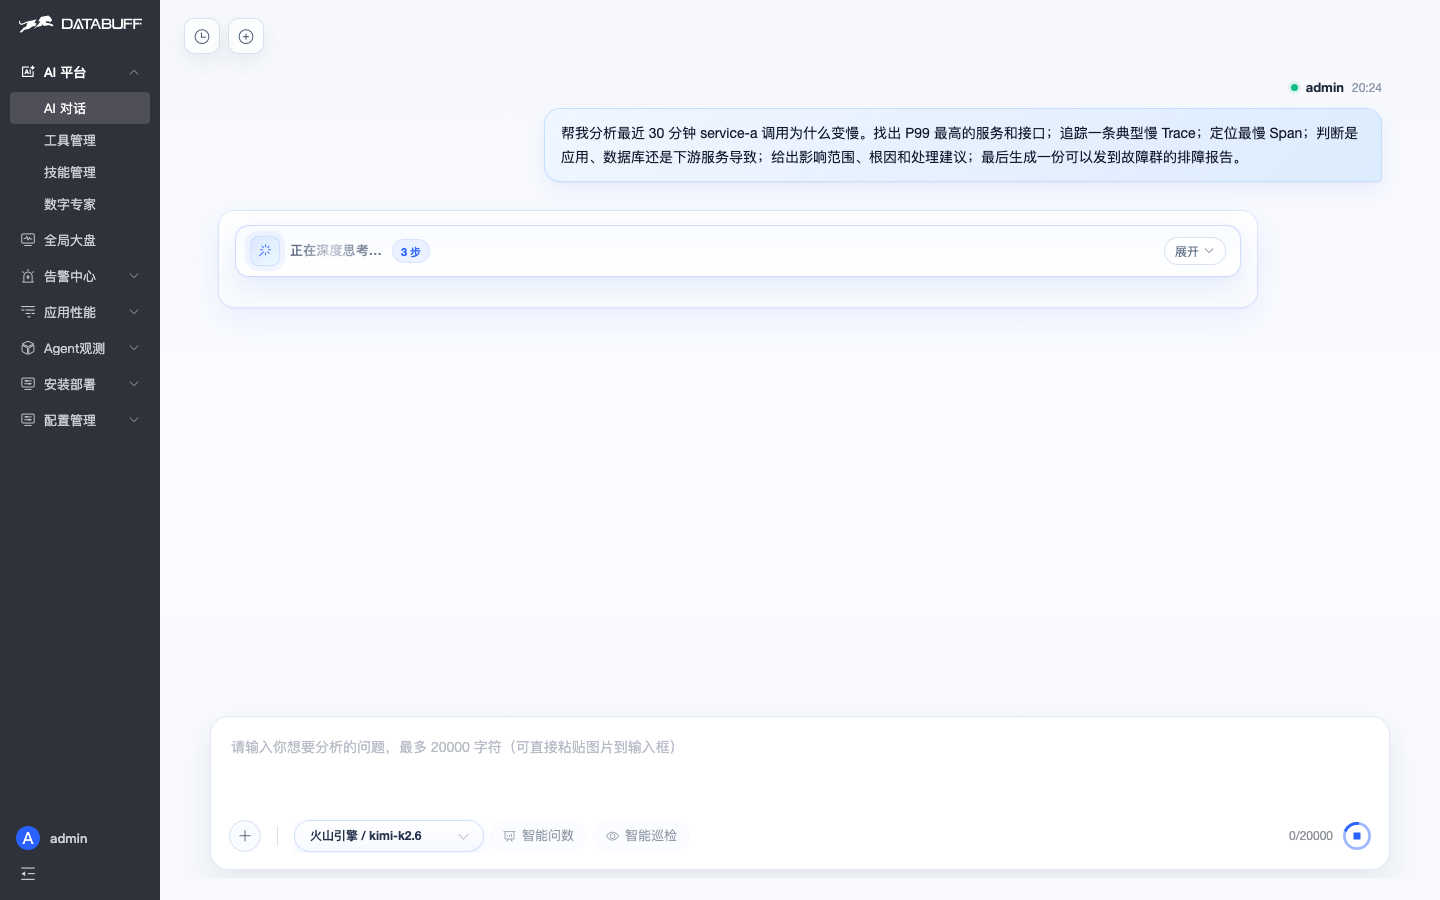
- Multi-agent collaboration: AI brain + metrics / inspection experts
- Smart query: natural language over metrics, traces, topology, alerts
- Health inspection: threshold-free anomaly screening with evidence chains
| Capability | What it does |
|---|---|
| In-platform AI chat | Ask in the Web UI: “Why is this trace slow?” or “Inspect order-service” |
| MCP for external agents (this article) | Cursor, Claude Code, OpenClaw call the same APM tools |
| Official Skills | Constrain query semantics and inspection flows — agents don't invent metrics |
22am alert: five tabs, or one sentence?
Alert fires: “Checkout is slow — anything wrong cluster-wide?”
Old way: APM dashboard → traces → topology → alert list → hand-written summary. 20–30 minutes per round.
With OpenClaw: send one message in CLI, WebChat, or Feishu / DingTalk. The agent calls DataBuff MCP against real OTel data in Doris, follows official Skills, and returns an evidence-backed report — not hallucinated numbers.
❌ Without MCP
The model invents “error rate 2.3%” — pure hallucination, not safe for incident channels.
✅ MCP + Skills
inspectService first → traces / topology for anomalies → Chinese or English report with evidence.
3MCP is the hands; Skills are the brain
DataBuff ships an agent integration pack (integrations/agent/). You need both layers for a real ops agent:
Skills = query semantics + inspection workflow (when to inspect, time ranges, evidence chaining)
| Layer | Contents | Examples |
|---|---|---|
| MCP tools | Live data access | queryServicesAll, inspectService, queryTraceDetail |
| Skills | Behavior rules | skill.data.metrics, skill.inspection.health |
External agents hit the same Spring beans as in-platform AI experts — not pasted APIs, real OTel data in Doris.
45-minute setup: MCP + Skills end-to-end
Prerequisite: DataBuff deployed; OpenClaw can reach the Web port.
Step 0 · Get the official integration pack — do not download Skills/MCP from third-party marketplaces:
Or browse integrations/agent/ on GitHub. Contains skills/ (2 official Skills) and mcp/ (client config examples).
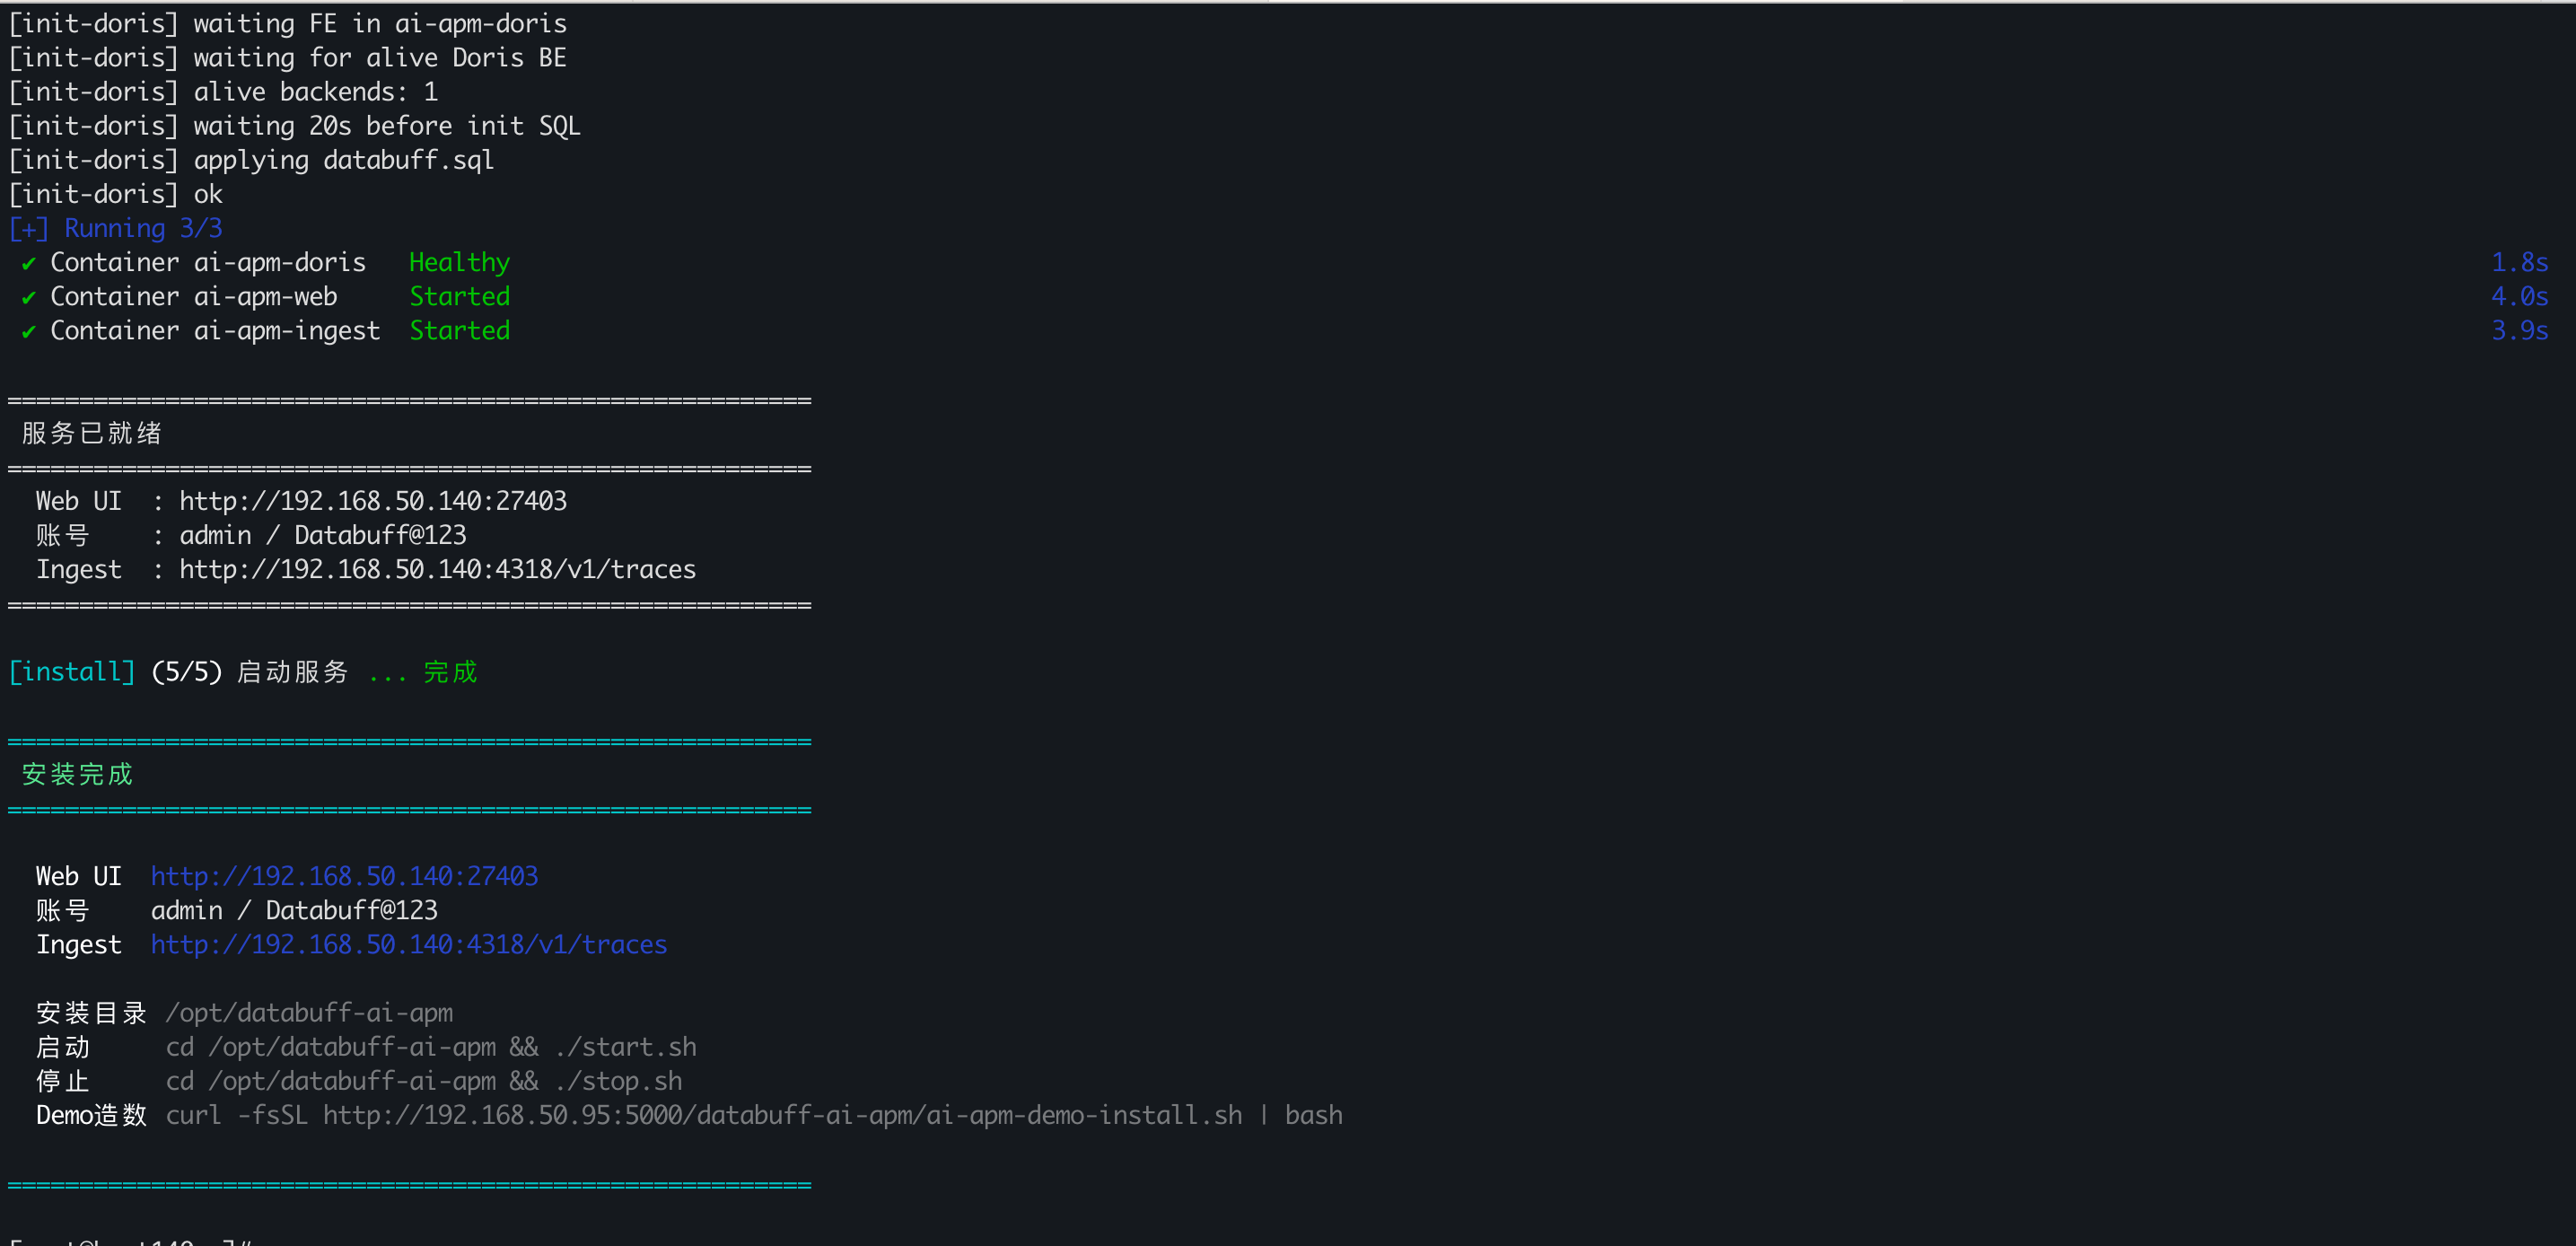
Step 1 · Deploy DataBuff (if not installed):
Step 2 · Configure MCP — copy mcp/openclaw-amc-config.example.json, set mcp.url to your DataBuff host:
Replace YOUR_DATABUFF_HOST:PORT. MVP needs no Authorization header. MCP endpoint: /mcp (Streamable HTTP).
Step 3 · Install Skills — copy integrations/agent/skills/ to your client Skills path:
| Client | Skills path |
|---|---|
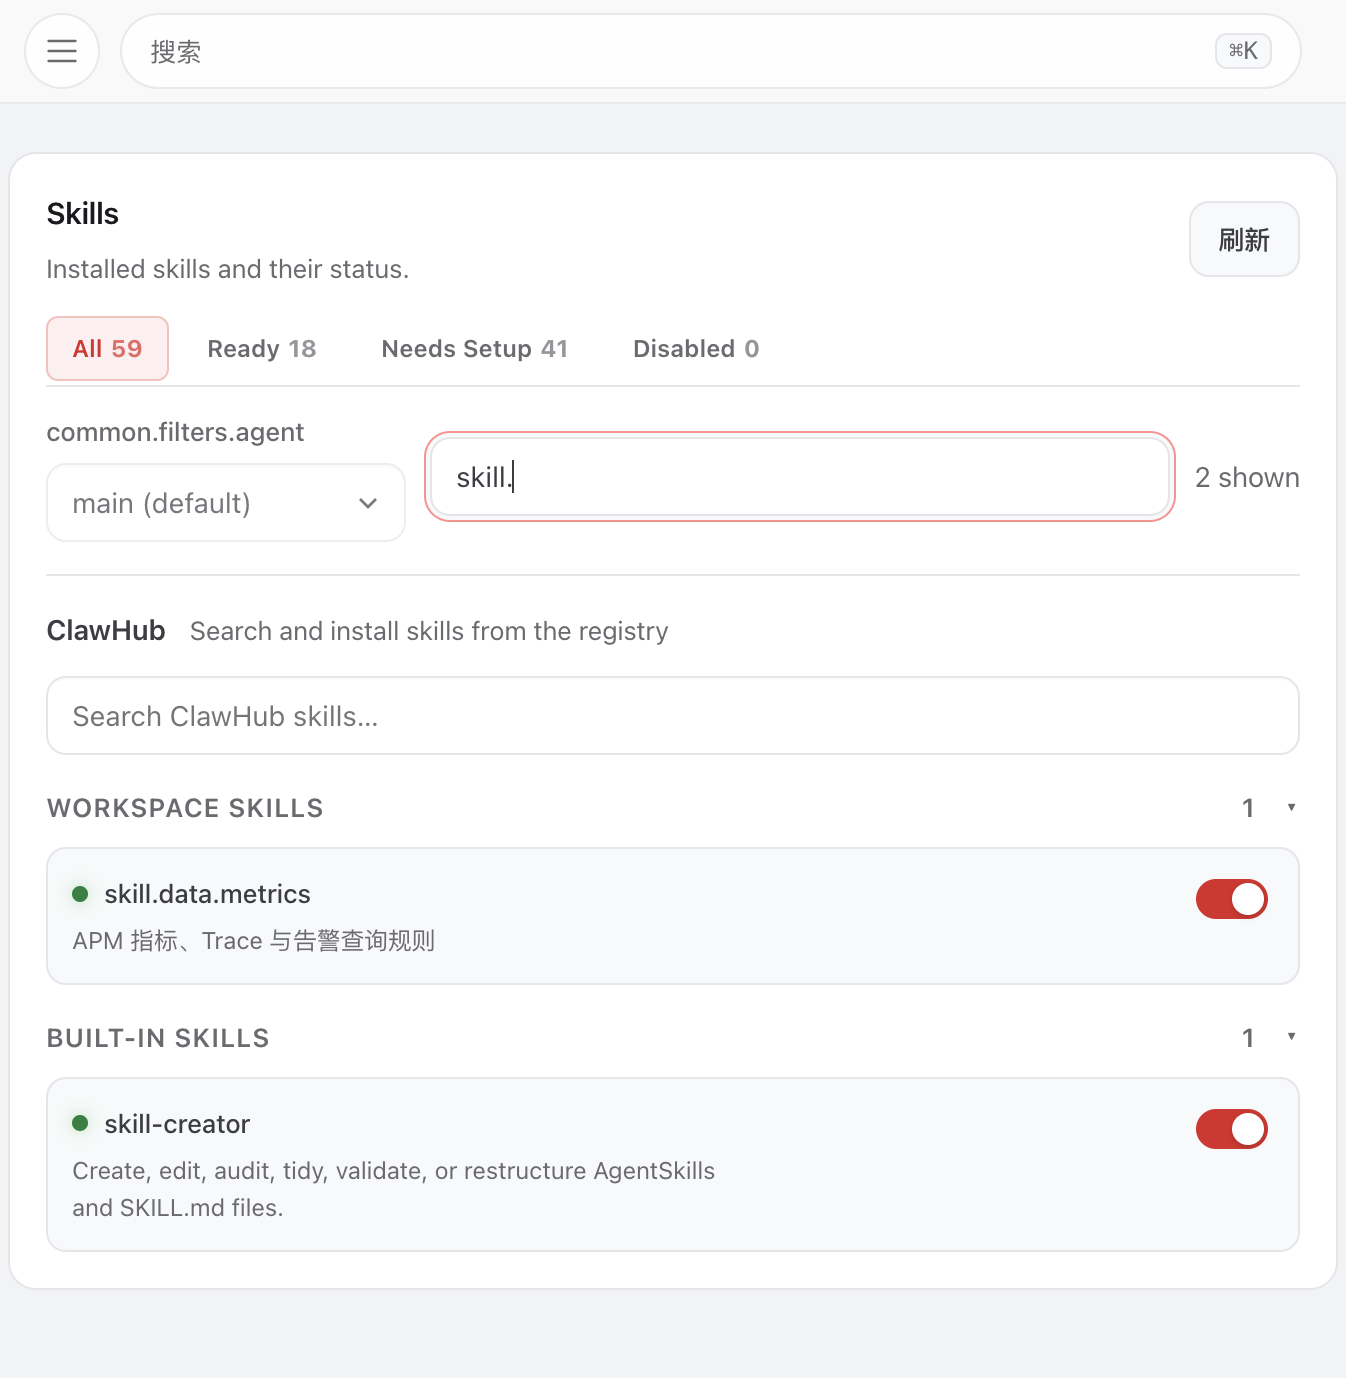
| OpenClaw | OpenClaw workspace skills/ (Control UI → Skills should list both) |
| Cursor | ~/.cursor/skills/ or project .cursor/skills/ |
| Claude Code | ~/.claude/skills/ |
Each Skill is a directory with SKILL.md. Synced with deploy/common/skills/ — re-copy after updates.
| skillId | Purpose |
|---|---|
skill.data.metrics | APM metrics, trace, alert query semantics (time ranges, which tool) |
skill.inspection.health | Health inspection flow (inspect first, gather evidence, conclude) |
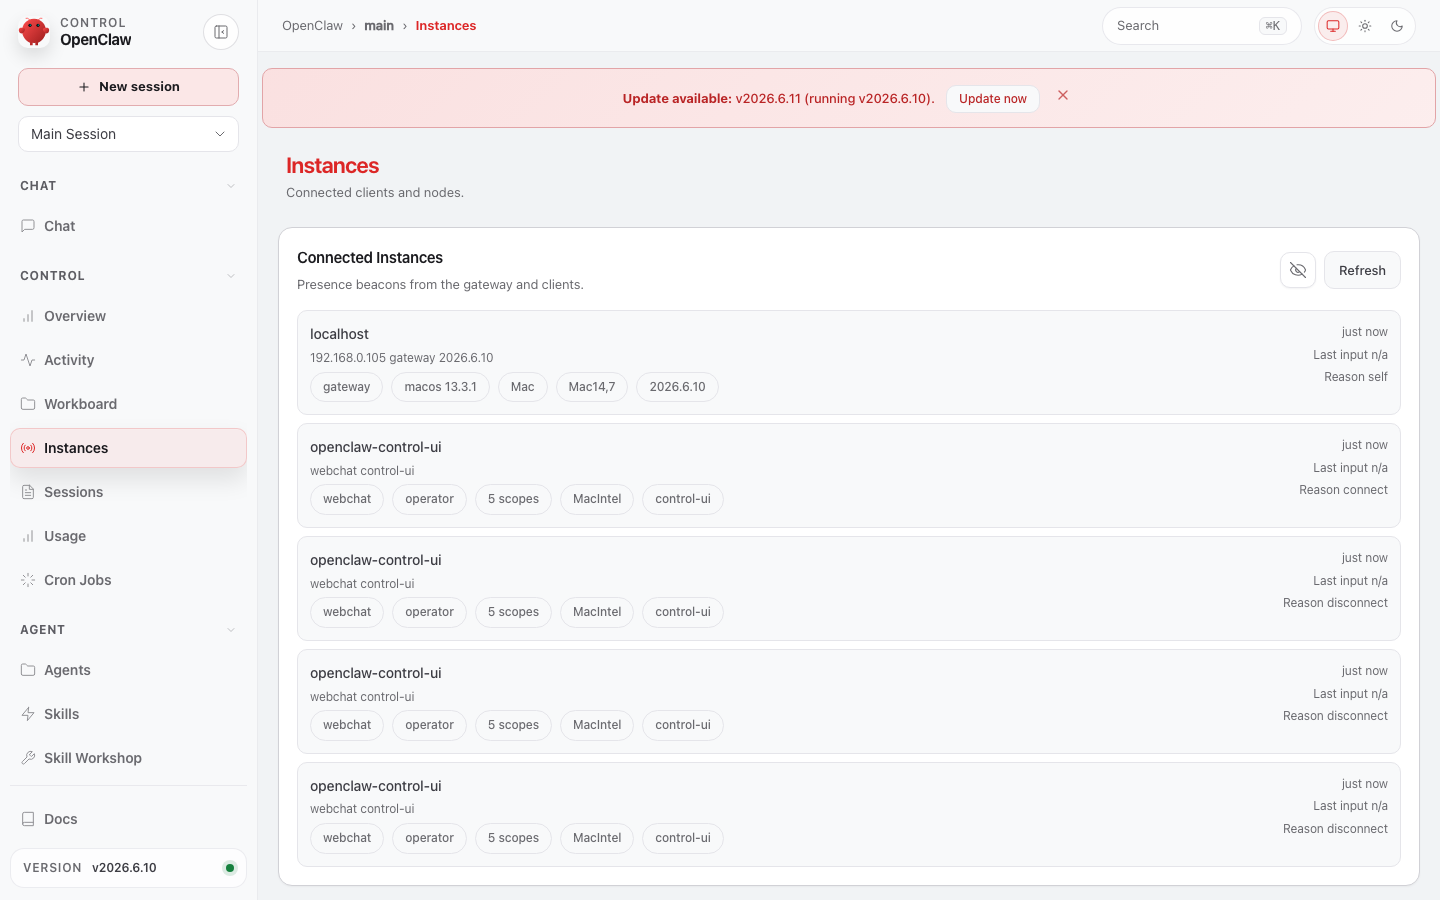
Step 4 · Verify — after restarting OpenClaw Gateway:
- Control UI → Skills:
skill.data.metrics,skill.inspection.health - Control UI → Instances: Gateway online
- New chat → Activity:
Databuff-apmtools (e.g.QueryServicesAll)
5Three prompts to validate the full path
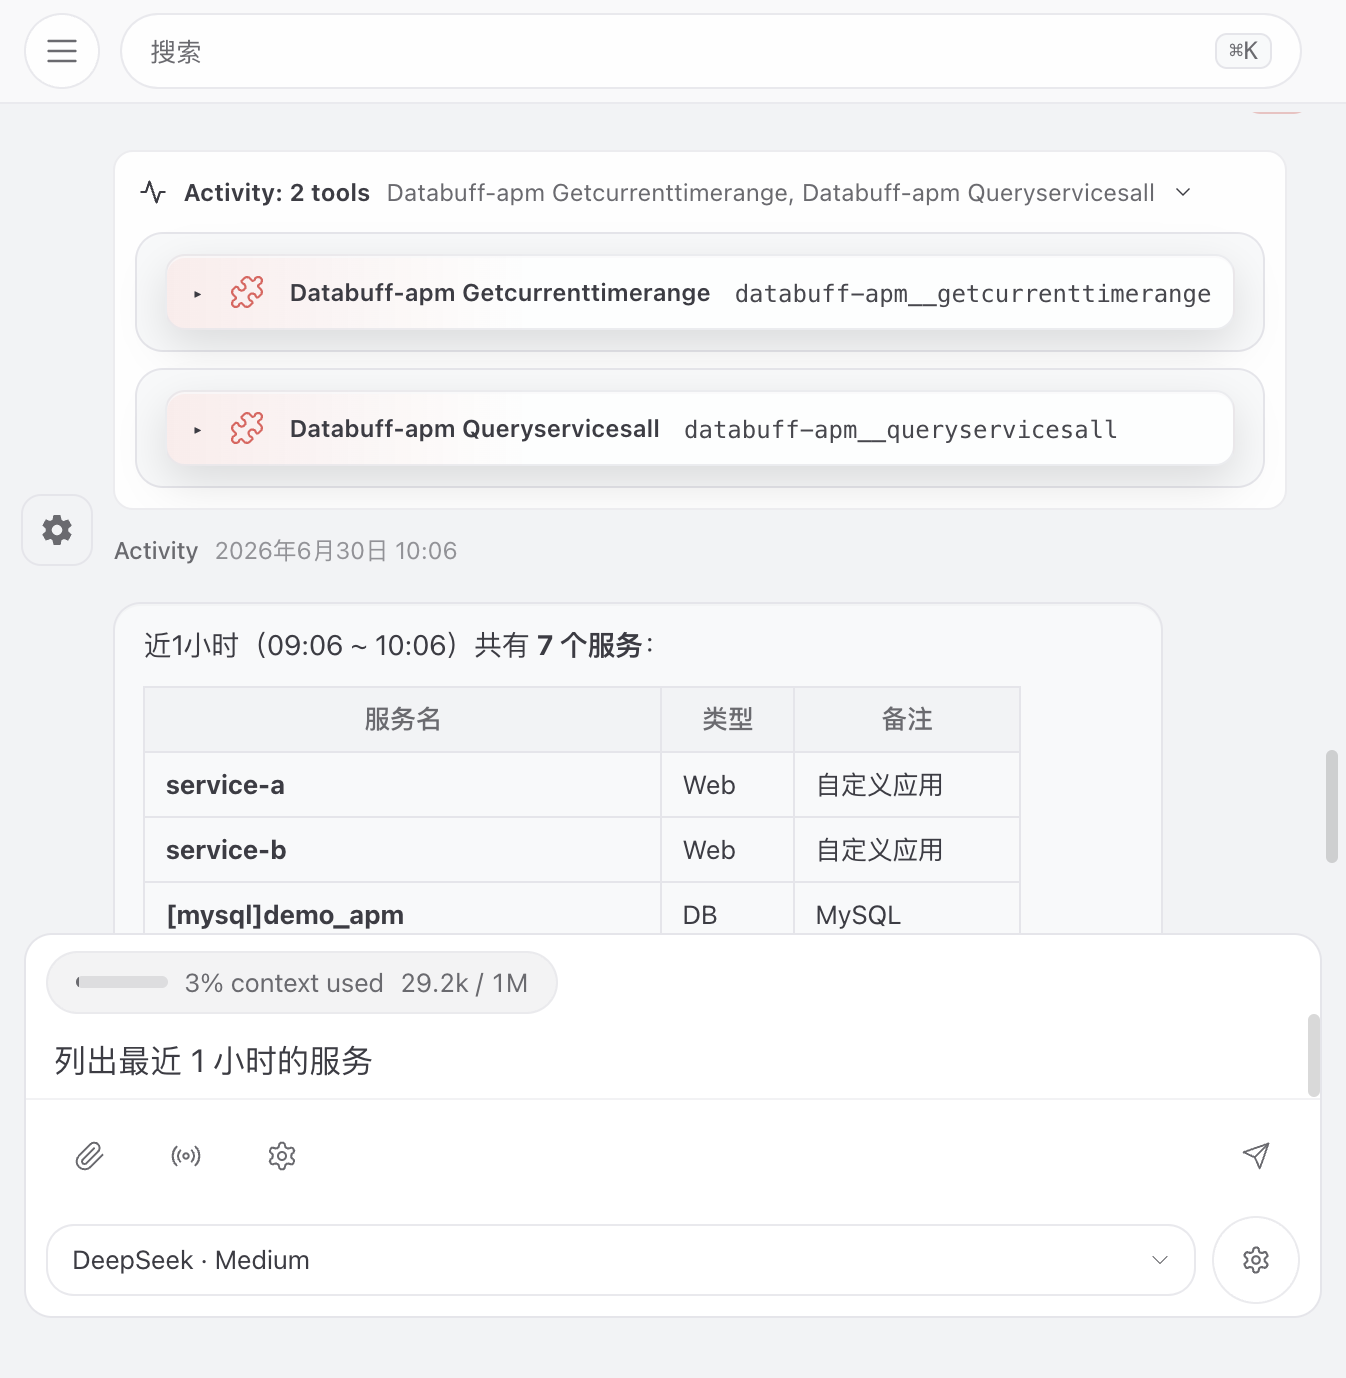
“List services from the last hour” — Skill parses time → getCurrentTimeRange → queryServicesAll
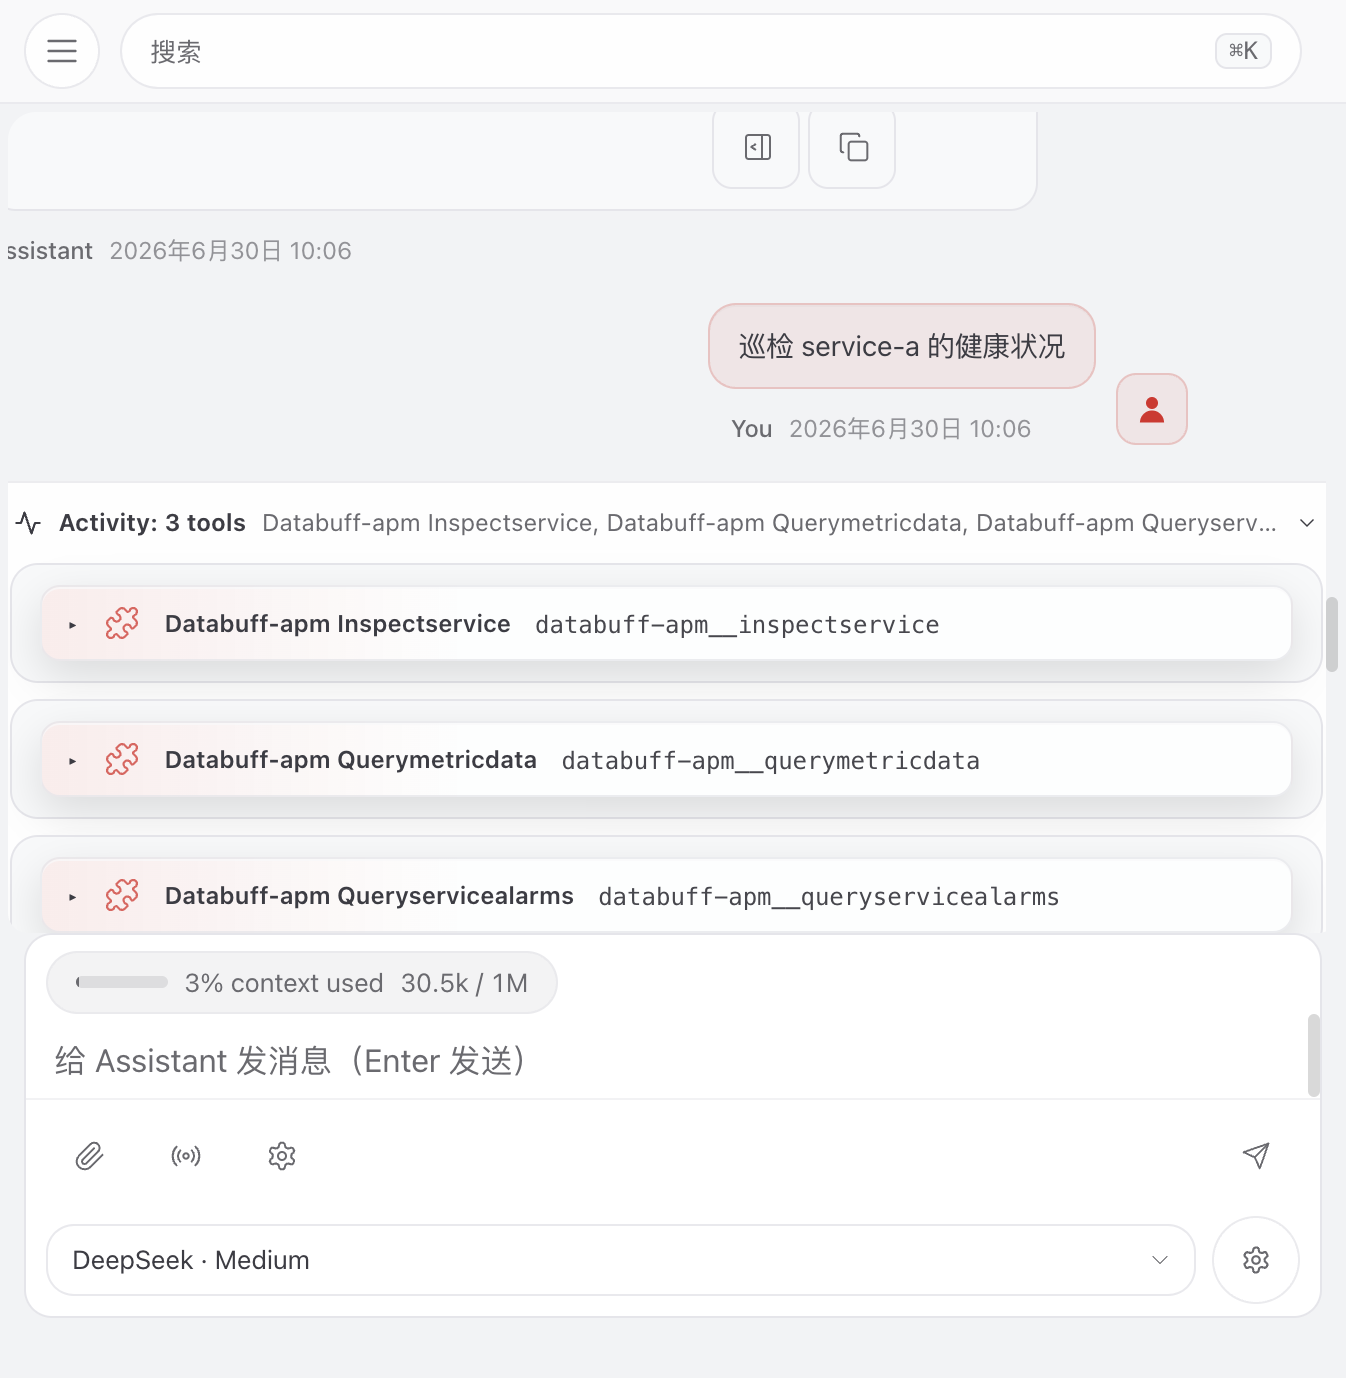
“Inspect service-a health” — inspectService → queryMetricData / queryServiceAlarms
“Chart service-a error rate for the past hour” — queryMetricData + drawTrendCharts
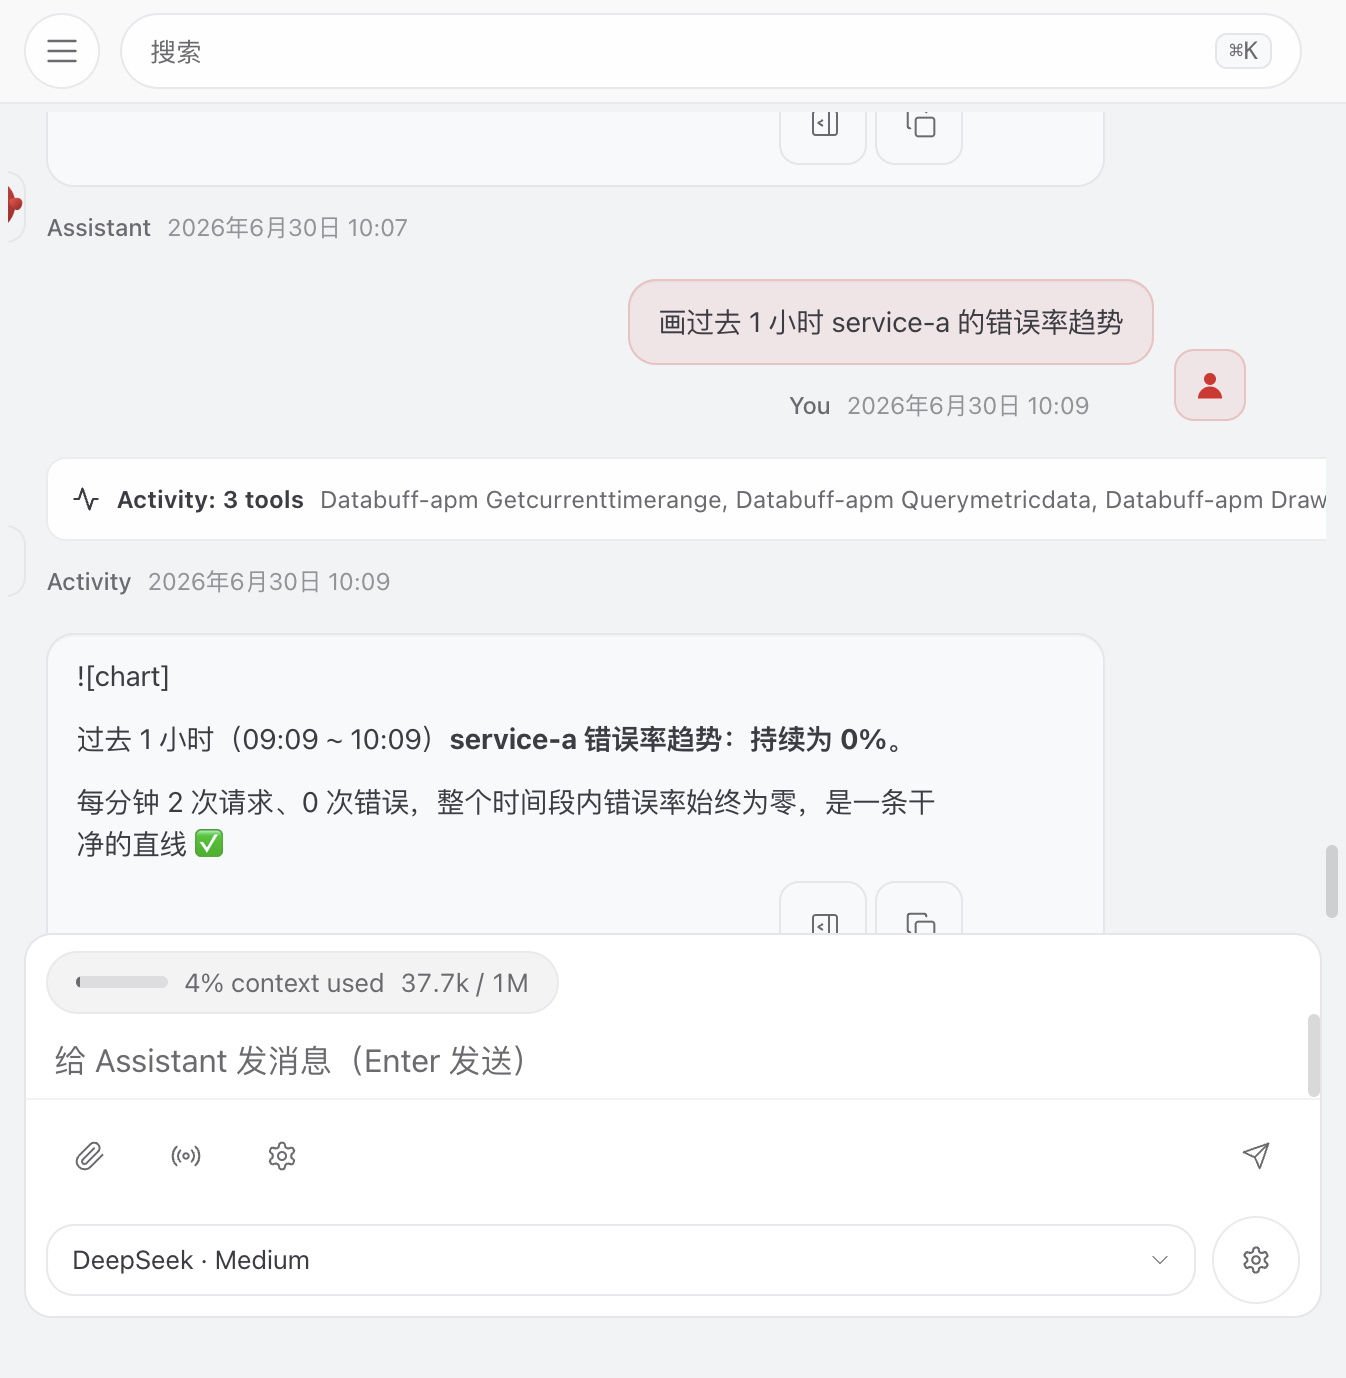
queryServicesAll / inspectService with JSON responses — not plain-text guesses.
6vs in-platform AI and vs Cursor?
| Scenario | Path | Best for |
|---|---|---|
| DataBuff Web UI | AgentScope JAVA_BEAN + multi-expert | Day-to-day console troubleshooting |
| OpenClaw / Feishu / DingTalk | MCP + Skills | One-liner queries in alert channels |
| Cursor / Claude Code | Same MCP + Skills | Developers querying APM from the IDE |
All three paths are independent. OpenClaw brings APM into your existing agent runtime — no extra browser tab for AI incidents.
Full config and FAQ: docs/manual/agent-integration.md and integrations/agent/README.md in the repo.
7From guessing metrics to calling real APM
DataBuff opens APM to any agent runtime; OpenClaw / Feishu / DingTalk are just entry points — MCP for real data, Skills for semantics is the core.
⭐ Wire up DataBuff agent integration in 5 minutes
github.com/databufflabs/databuff/integrations/agent
Try: “Inspect service-a, then check if anything is wrong cluster-wide.”
View on GitHub →