Let's start with four familiar operations headaches, then look at four ways OpenOcta addresses them.
1. Four everyday problems
Problem 1/4: Investigating one issue means switching between several systems
Finding out why a service has slowed down often starts with opening several different systems.
First, you check the CMDB to find the hosts running the service and the team responsible for it. Then you open Prometheus or Zabbix to check metrics and host status.
Next comes APM to find the slow part of a request, Elasticsearch to search logs from the same period, and your change management system to check for recent releases.
Each switch means finding the service again, selecting a time range, and setting filters. One system expects a service name; another needs a host IP.
You still have to bring the results together yourself. When a new clue appears, you return to an earlier system and keep searching.
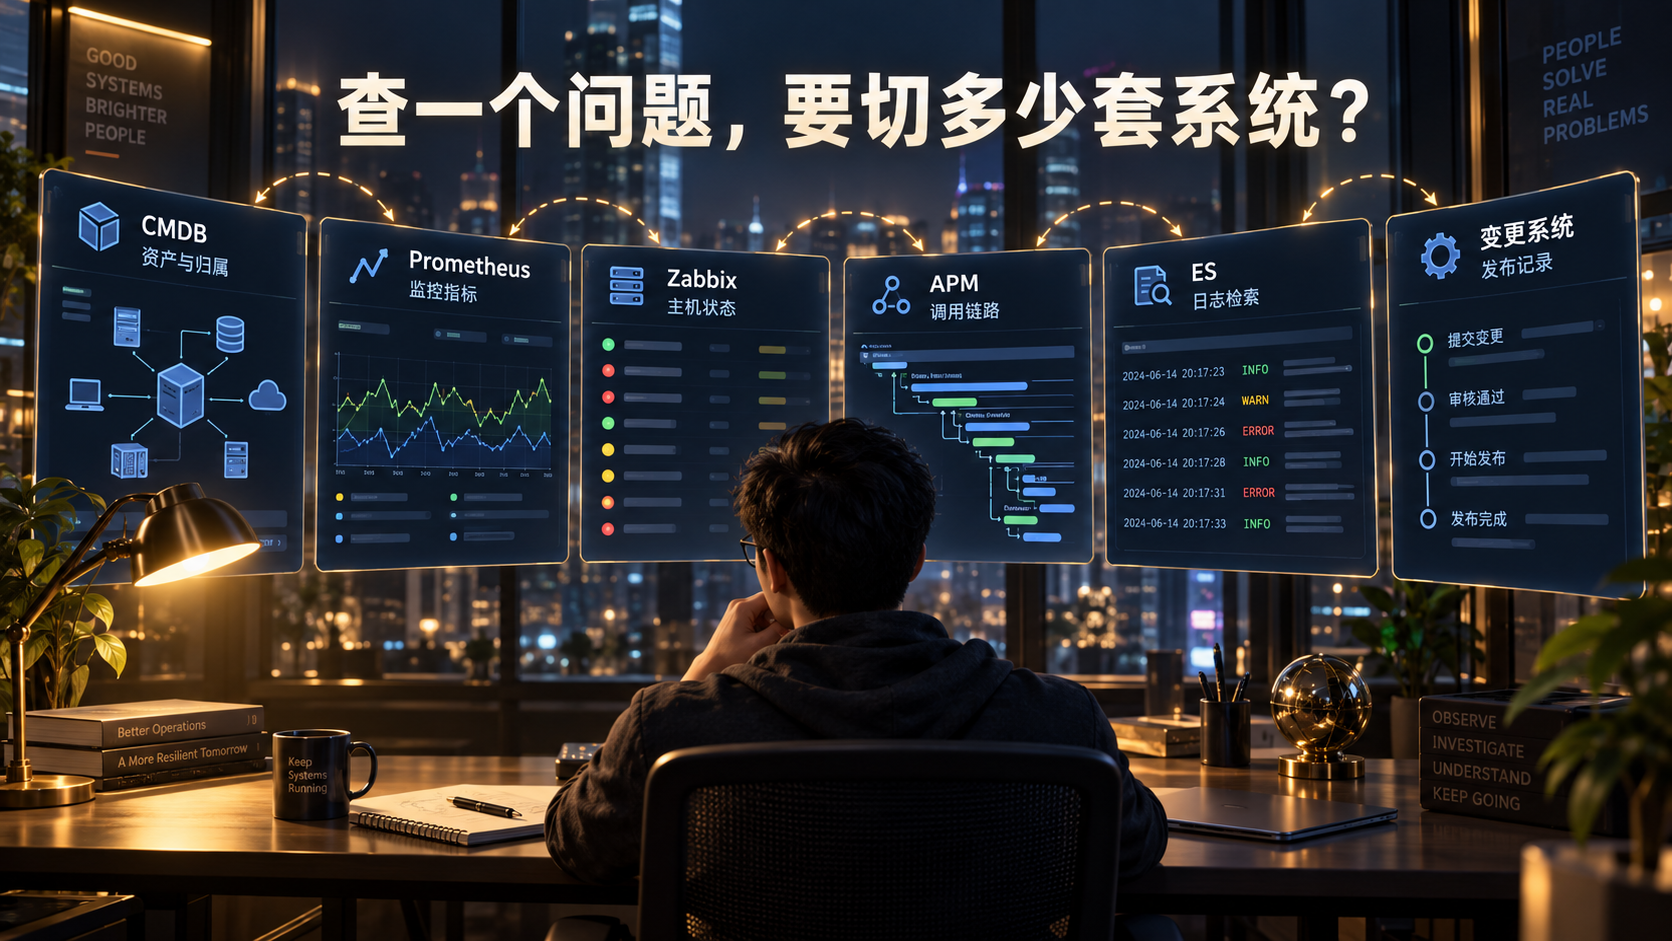
Problem illustration: information about the same issue is spread across several systems.
What if I could ask in one place, have it query those systems, and continue the investigation using the results?
Problem 2/4: Alerts arrive everywhere, and you have to identify duplicates
Prometheus sends an alert. Zabbix reports something too. You open both pages and compare the service, host, and time to work out whether they are related. Before you finish, the same abnormal condition triggers another notification.
Without a shared view, you first have to work out which notifications represent new problems and which are repeats. Once you find the alert that needs attention, there are still metrics to check, logs to search, and possible remedies to investigate.
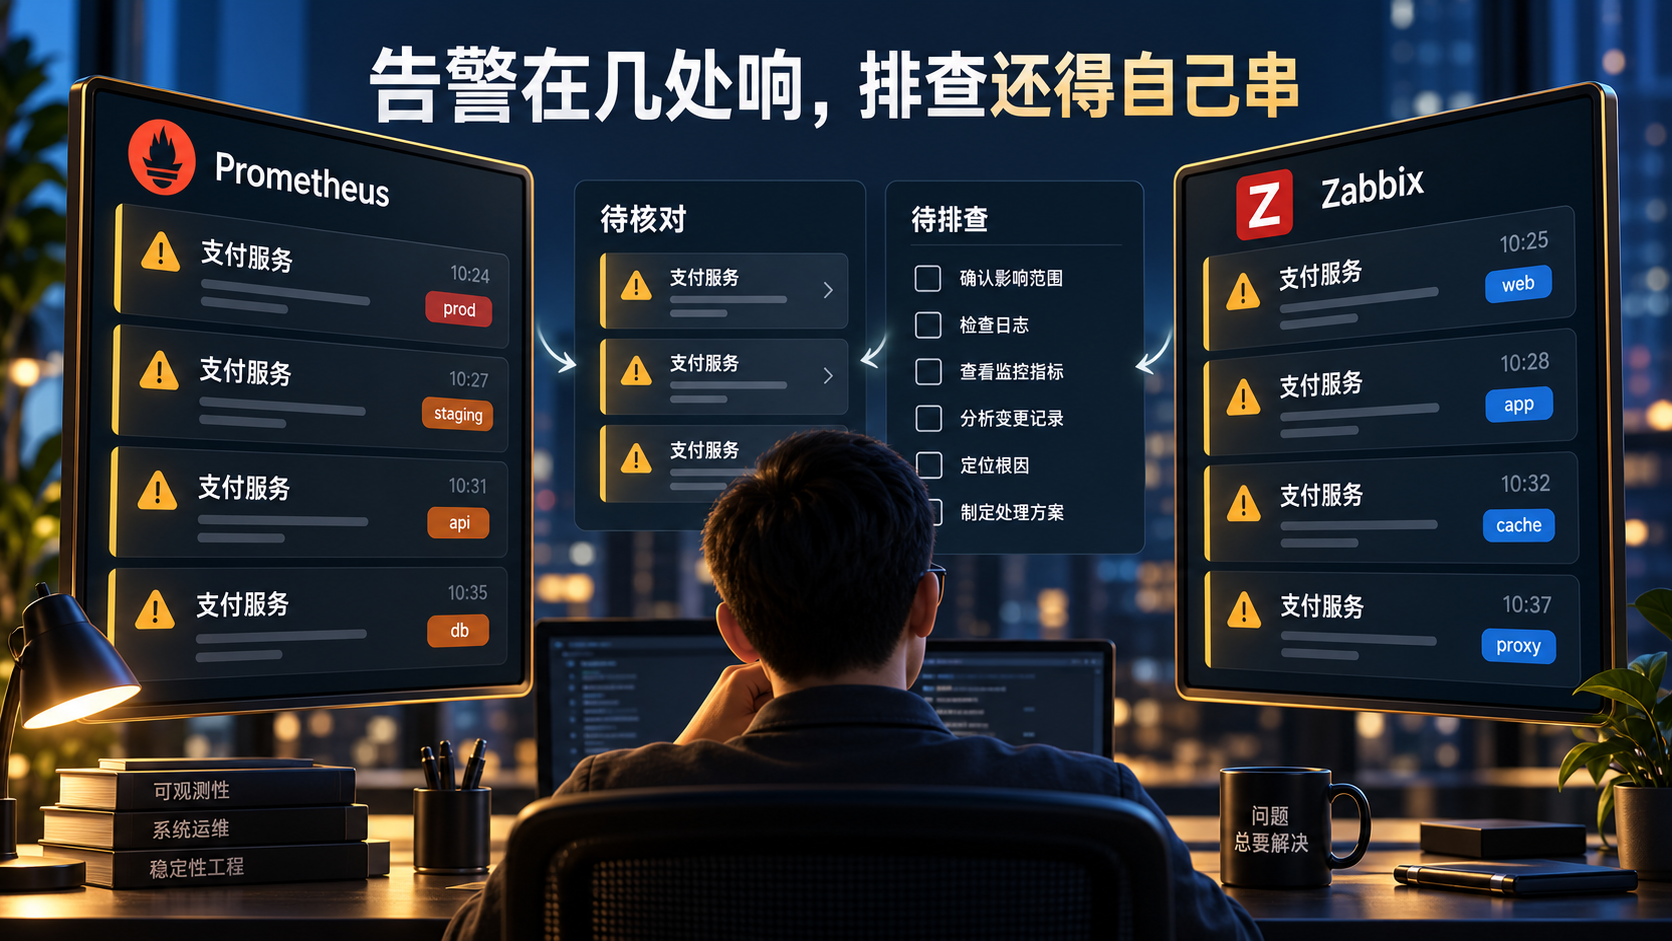
Problem illustration: several systems raise alerts; someone must identify duplicates before investigating.
What if I could see these alerts together, group repeated notifications, and continue straight into investigation and handling?
Problem 3/4: Daily, weekly, and monthly work still involves repetitive manual steps
Even when no alert interrupts you, routine work keeps coming.
Daily health checks mean reviewing the status and metrics of core services one by one. If something looks wrong, you gather more information. Then you write up the results.
Scripts can do part of the work, but someone often still has to decide what to run first and what to check next.
What if I could describe the services and checks, have the steps run, investigate abnormalities, and receive a report?
Weekly reviews of unresolved issues raise another set of questions: which alerts from last week remain unresolved, and which problems have returned? With records spread across systems, you have to compare them by business service and time.
What if last week's records could give me an initial list of unresolved and recurring issues, instead of making me find everything again?
Monthly operational summaries require collecting alert, health-check, and handling records, then calculating statistics and reviewing trends for the services you own. The report format barely changes, but next month you repeat the collection and organization with a new set of data.
What if I could specify the services and period, and have that summary prepared for me?
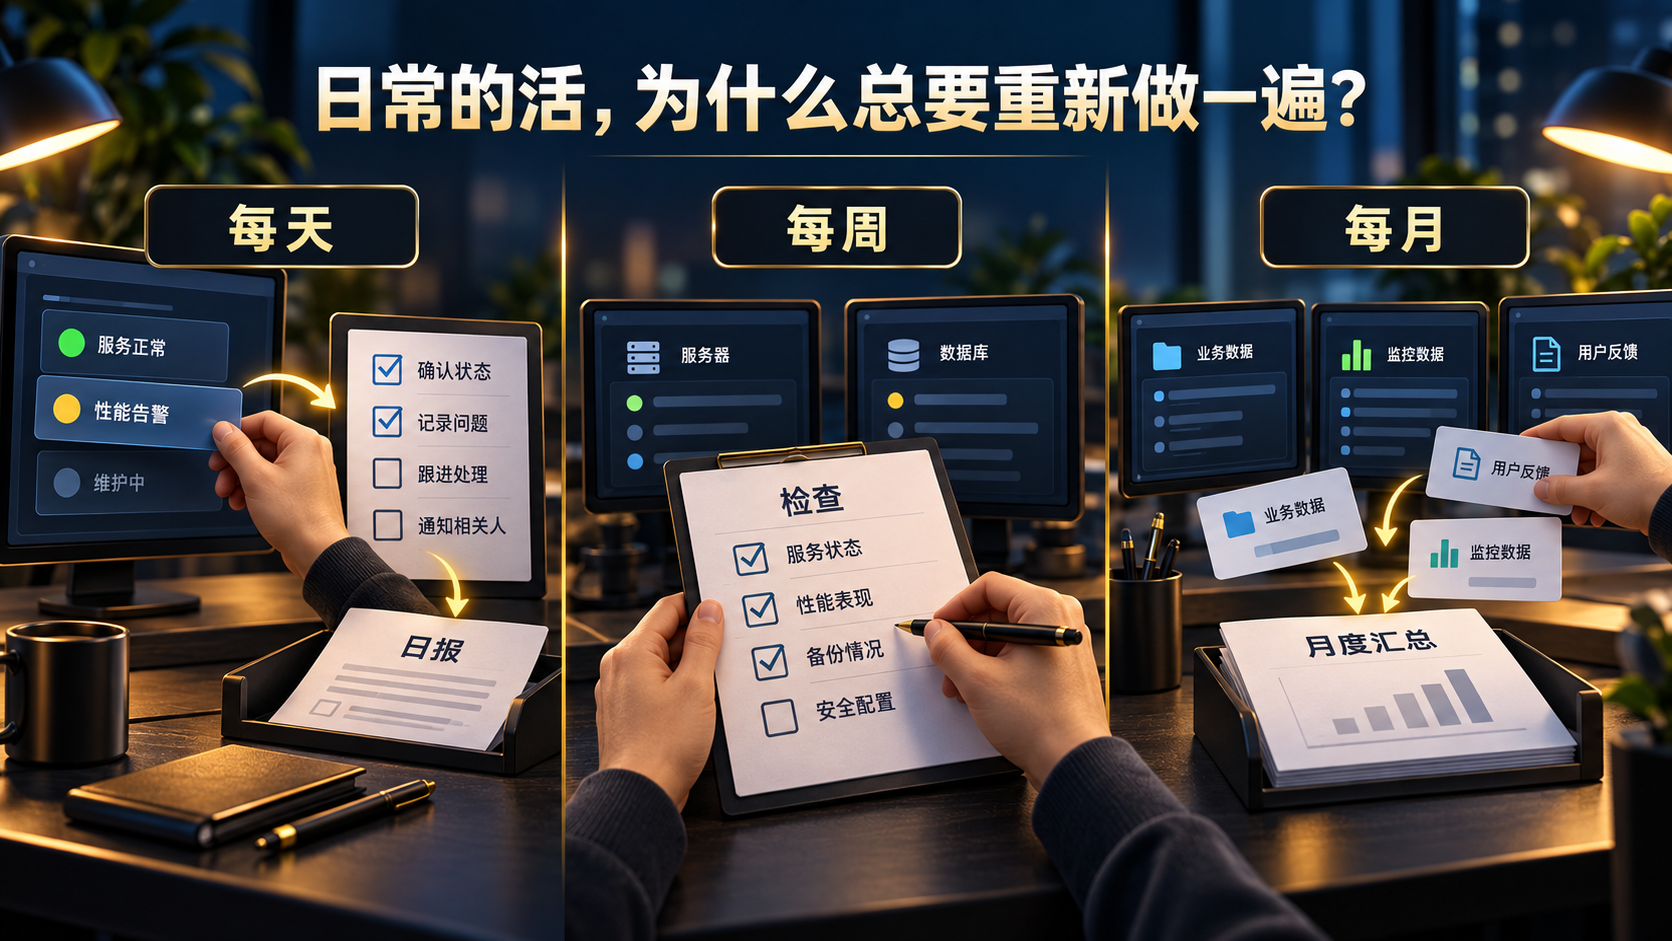
Problem illustration: check status each day, follow up on issues each week, and compile a summary each month.
Problem 4/4: A fixed dashboard may not fit the work you are doing
While on call, you want to know whether your services are healthy, which alerts need attention, and what recent checks found.
When preparing a change, you care about the affected systems and their check results. During a monthly review, you need trends over a longer period. You are the same person, but the information you need changes with the job.
A fixed dashboard often meets only part of that need. You filter and combine the remaining information yourself. Adding another service or changing a calculation may require another request for page development.

Problem illustration: when the work changes, the view needs to change too.
What if I could describe the services I own and the work I need to do, generate a suitable operations view, and keep refining it through conversation?
2. Four corresponding approaches
Approach 1/4: Connect systems and investigate one question across them
Your CMDB, Prometheus, Zabbix, APM, Elasticsearch, and your team's change management system can connect to OpenOcta through the interfaces and tools each provides.
OpenOcta supports MCP, API, and CLI integrations, allowing existing query capabilities to be used together.
Once connections, access permissions, and tool instructions are configured, you can ask:
Find out why the payment service has slowed down in the last half hour, and check whether there were any releases during that period.
Based on the question, the AI queries the CMDB for related resources, monitoring and APM for abnormal metrics and slow calls, then combines those findings with logs and recent change records to investigate possible causes.
You continue asking questions in the same conversation. It calls the systems it needs and uses the returned data to continue the investigation.
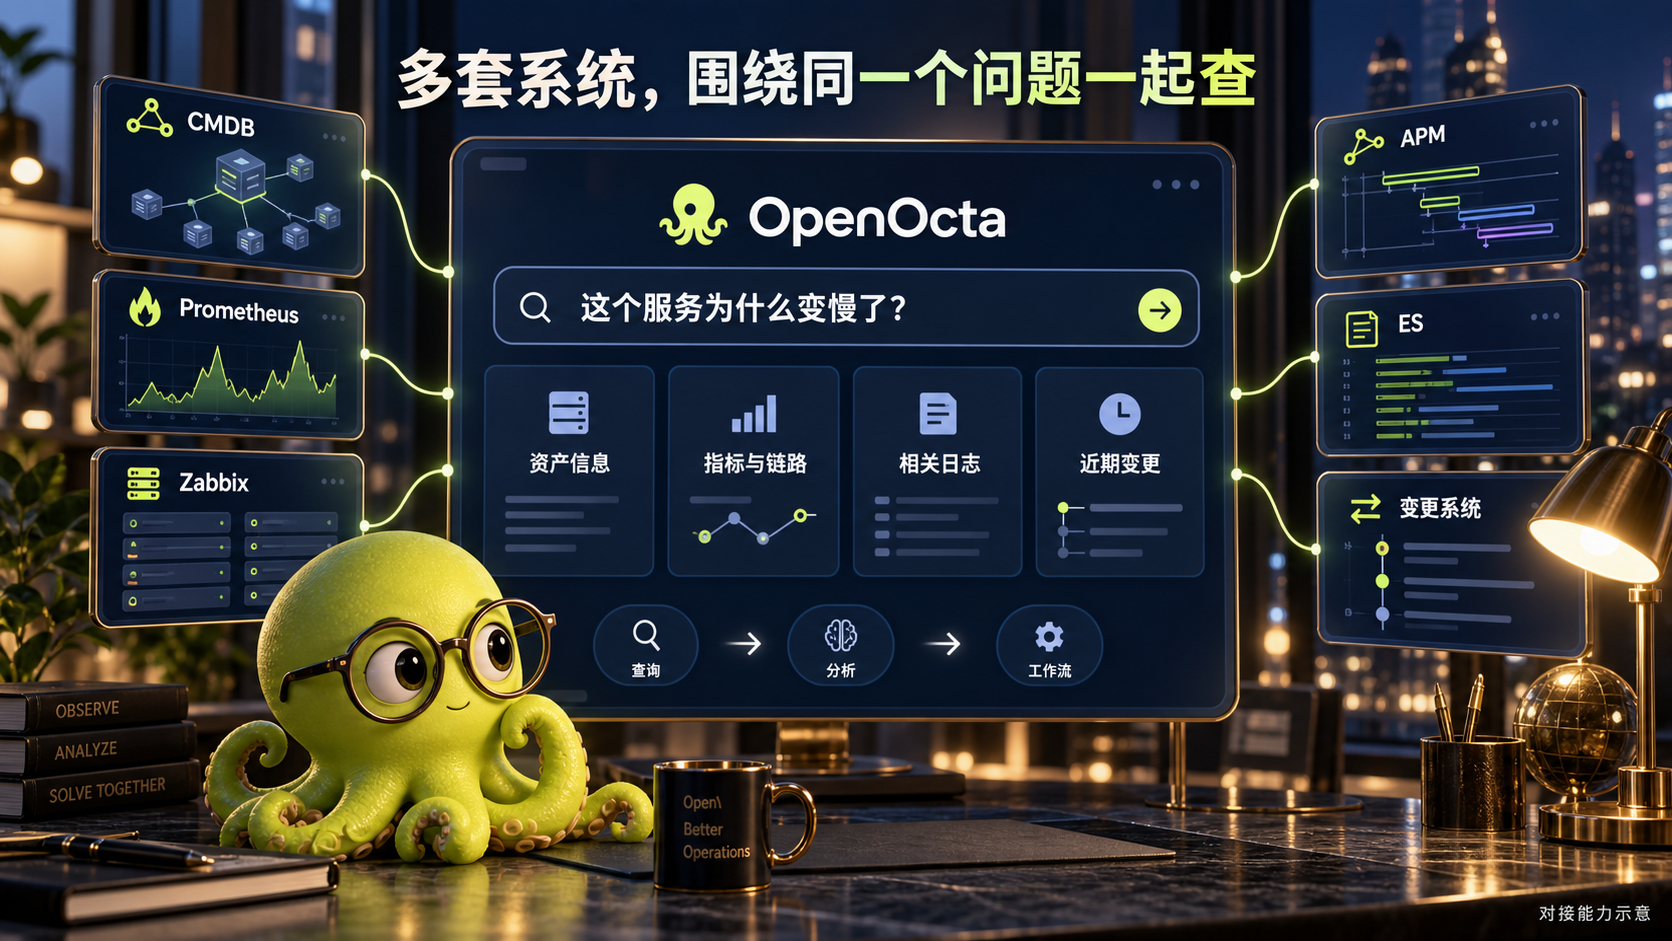
Approach illustration: connected systems provide inventory, monitoring, tracing, logs, and change information for the same question.
This can reduce copying service names, repeatedly selecting time ranges, and moving query results between systems. The same integrations can also support workflows and operations views.
Approach 2/4: Bring alerts together, group them by rules, and connect handling workflows
Alerts from systems such as Prometheus and Zabbix appear in a shared alert dashboard, with their sources, affected objects, and status visible together.
Repeated alerts of the same kind for the same object can be grouped using configured labels and time windows. Original events remain available when you need to inspect individual records.
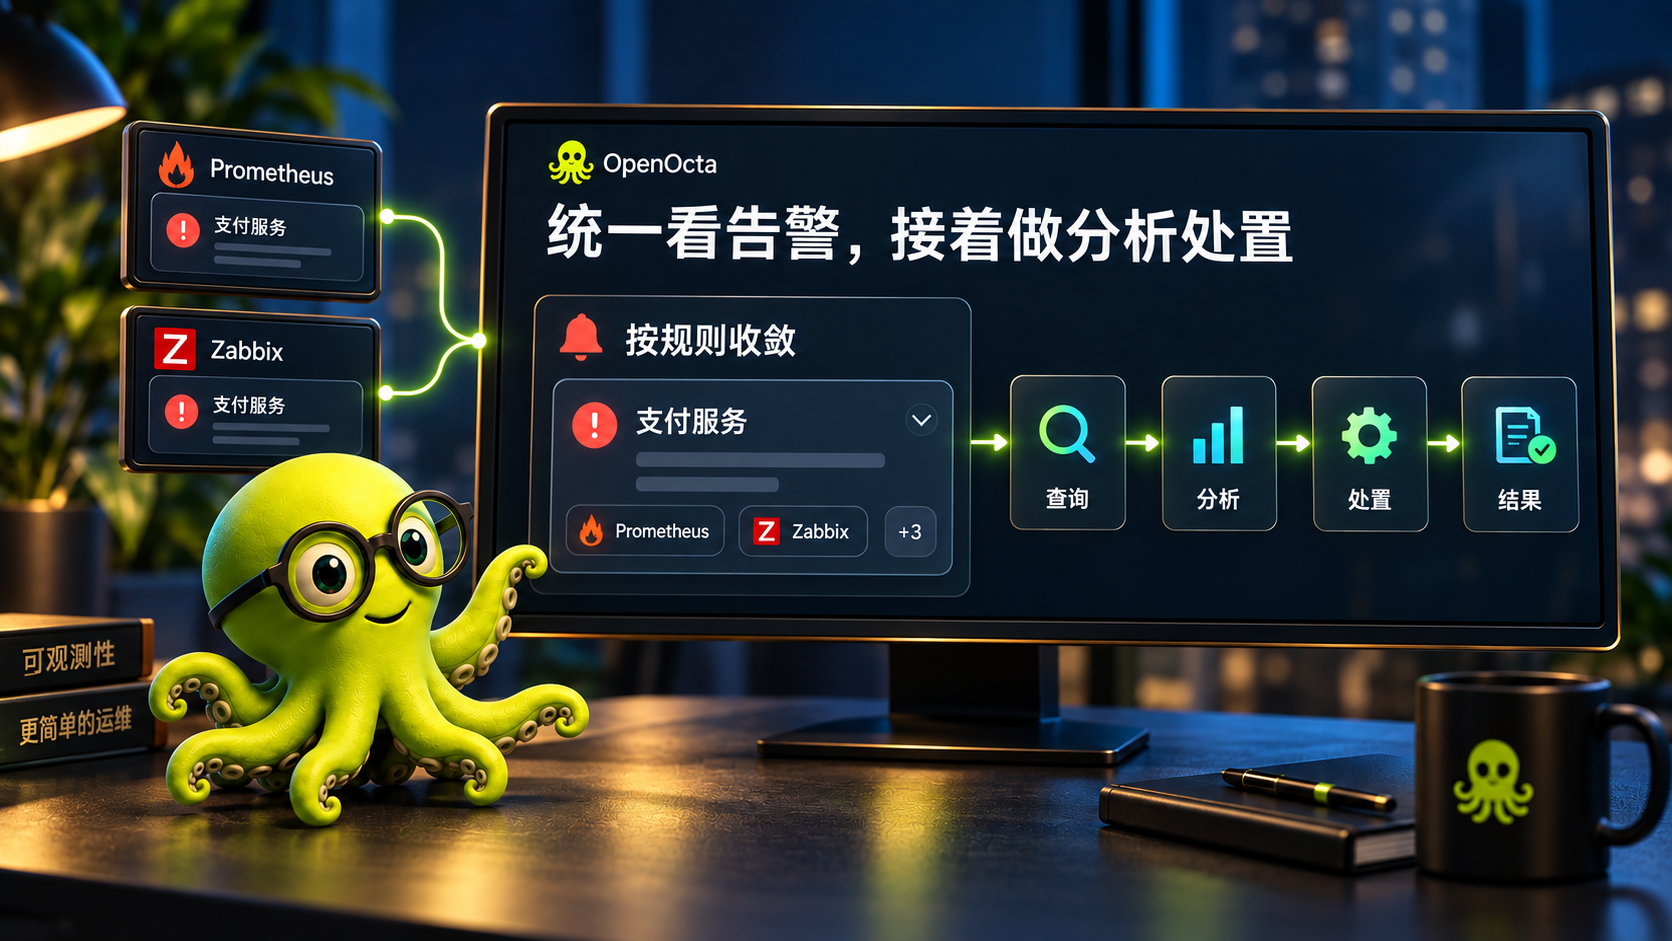
Approach illustration: view alerts together, group them by rules, then use an associated workflow to investigate and handle them.
You can then associate a handling workflow with that type of alert: query the connected monitoring, APM, and log systems, have the AI analyze the findings, and proceed through predefined handling steps.
The workflow runs with the alert's context. When another alert of that type arrives, investigation can follow the existing process.
Your configuration determines which steps run automatically and which require human confirmation. You can also see how far the process has progressed and what it found.
Approach 3/4: Generate workflows to carry out repetitive steps
Workflows can also handle daily checks, weekly reviews, and monthly summaries. Each has its own process, which can be generated from your requirements.
For example, describe a health check:
Find the services I own in the CMDB, check their operating status, query related metrics and logs if anything is abnormal, and compile a health-check report.
The AI generates a workflow from that request. You can inspect each step, adjust the scope and handling steps, and give it a trial run.
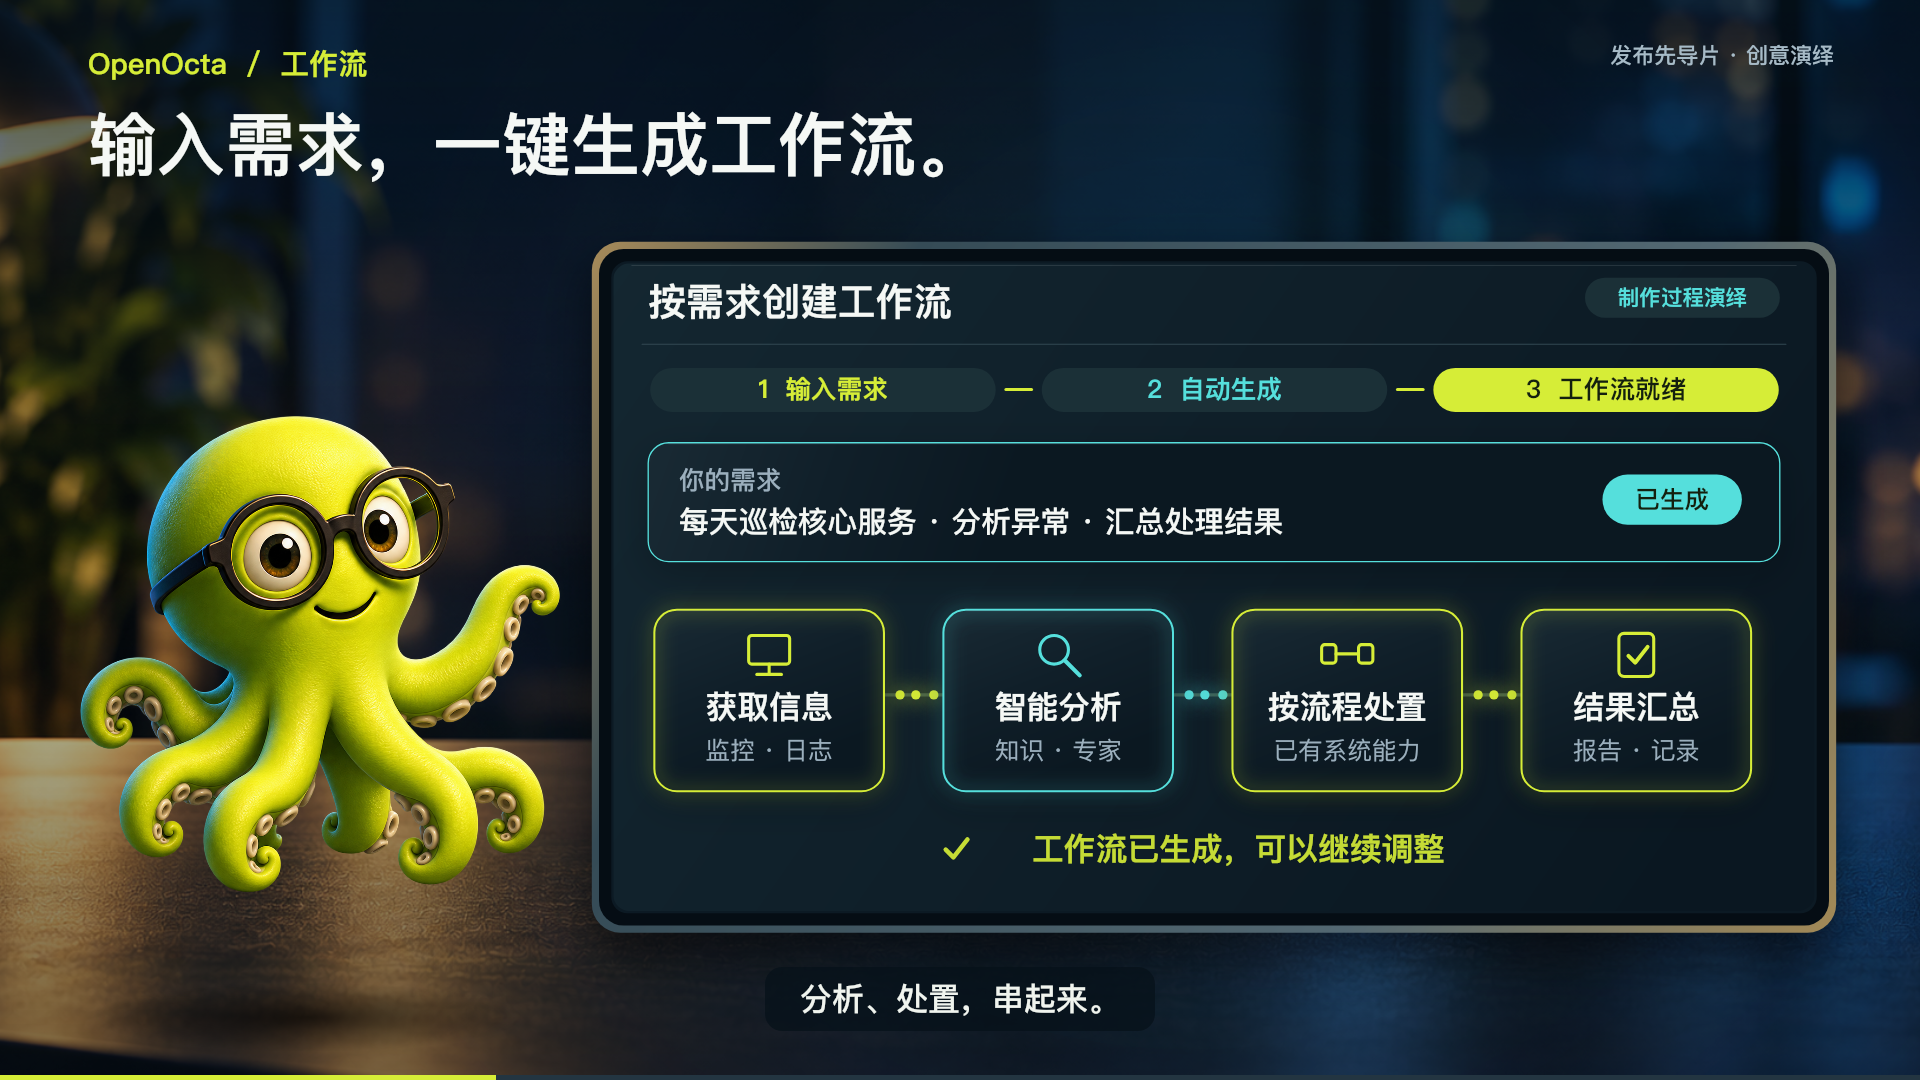
Teaser illustration: describe the work, generate a workflow, then inspect and adjust its steps.
Once the necessary systems are connected and you have confirmed the process, the workflow can use tools to query, check, analyze, and summarize.
Steps that previously required someone to pass one result to the next can run in sequence. Human confirmation can remain wherever your judgment is needed.
A weekly review can query alerts and handling records for a specified period and summarize unresolved issues. A monthly summary can collect data by business service, calculate statistics, and produce a report.
Save the workflow, and you can run the same steps again with a different time range.
Approach 4/4: Generate operations views around your work
Now consider the fixed dashboard that does not quite fit. You can describe the view you need:
Create an on-call view for the payment service, bringing together service health, priority alerts, recent changes, and the health-check workflow.
The AI generates a page from that request, drawing data from connected systems. Inventory, monitoring, alerts, and change information can appear together around the business service you care about.
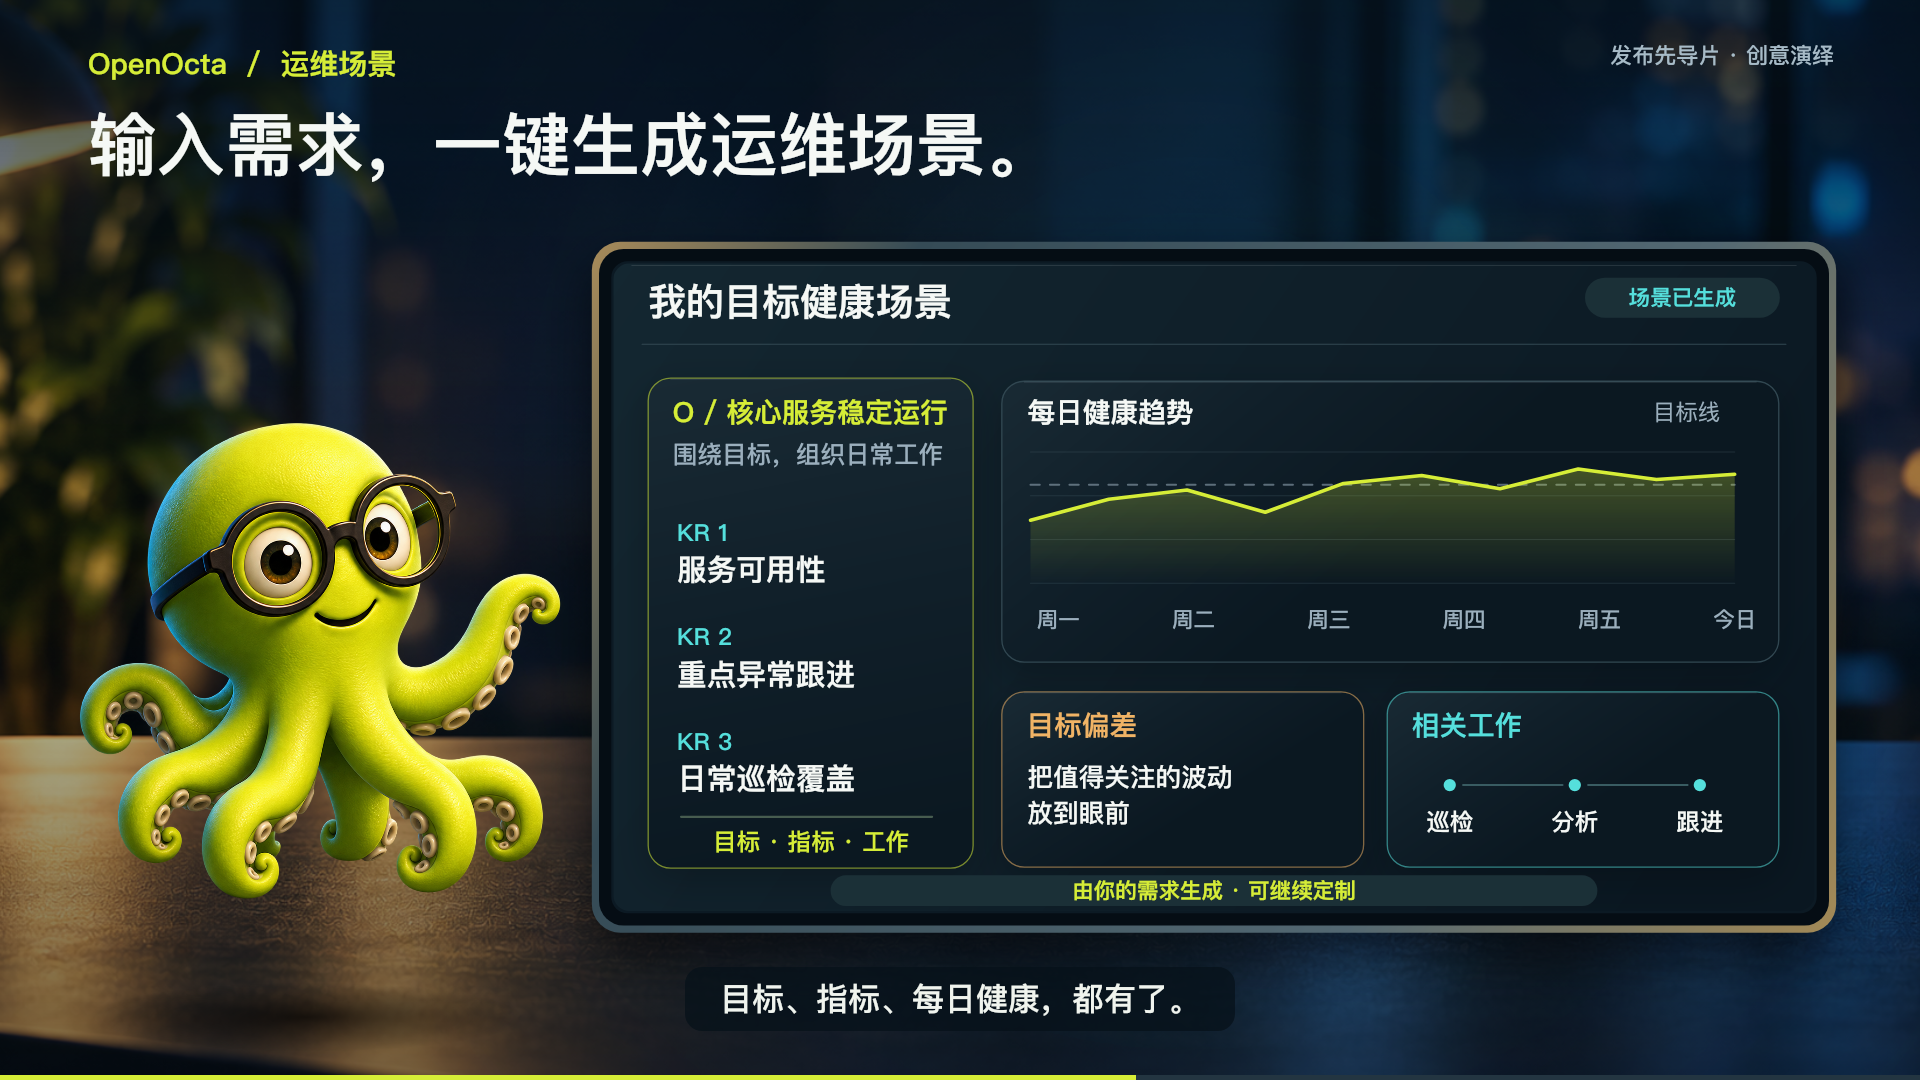
Teaser illustration: generate an operations view for the work you do each day.
The generated view supports further queries and changes to the time range. You can ask for another trend or replace information you rarely use.
For monthly reviews, you can generate a separate view focused on trends and statistics. Choose the view that suits the work you are doing.
3. OpenOcta launch preview
This is a first look at OpenOcta, ahead of its launch. These are a few glimpses; fuller demonstrations of the actual workflows will follow.
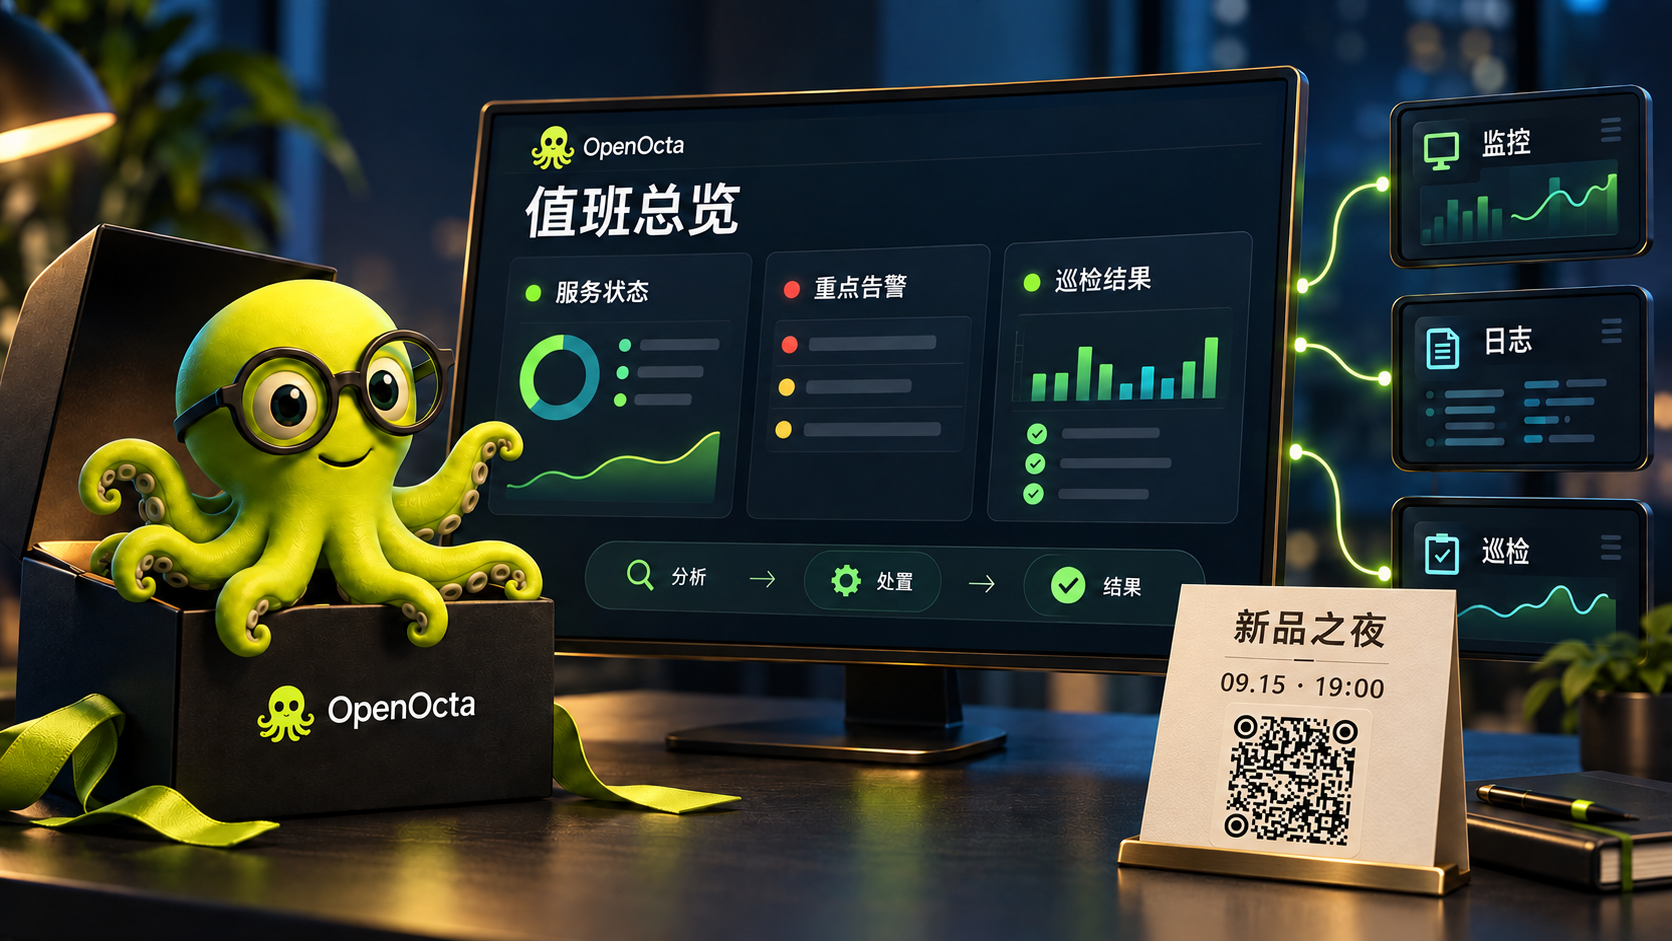
OpenOcta launches on September 15, 2026, at 7:00 p.m. China Standard Time (UTC+8).