Ops rarely lacks metrics, topology, traces, or logs. What it lacks is lining those four up when something breaks.
Take an entry service that returns 200 with a 0% error rate. It looks fine, so the investigation often stops on that page. The real problem is downstream — SQL already threw — and this page never shows it.
- Metric — who is slow, who is erroring
- Topology — which upstream/downstream node went red
- Trace — which hop ate the time
- Log — search the original line by call ID
You line up the time window yourself, copy the call ID yourself, search again on the next page — the four pages only talk through you.
- Metrics pick the target
- Topology looks downstream
- Trace splits that hop
- Logs match the original line
- → inspection report
It’s called DataBuff. Repo: https://github.com/databufflabs/databuff. Below is that chat on the official demo, watching it line the four pages up.
In the official demo, service-a / service-b are hitting GET /demo/checkout. The chat starts with:
找出最近 1 小时平均响应时间最高的服务,对它进行故障定位Find the service with the highest average response time in the last hour, then localize the fault on it.
- It splits the sentence into two steps: find the slowest service in the last hour, then localize the fault on it.
- The first cut goes to metric query, time window pinned to the last hour, pull the service list first.
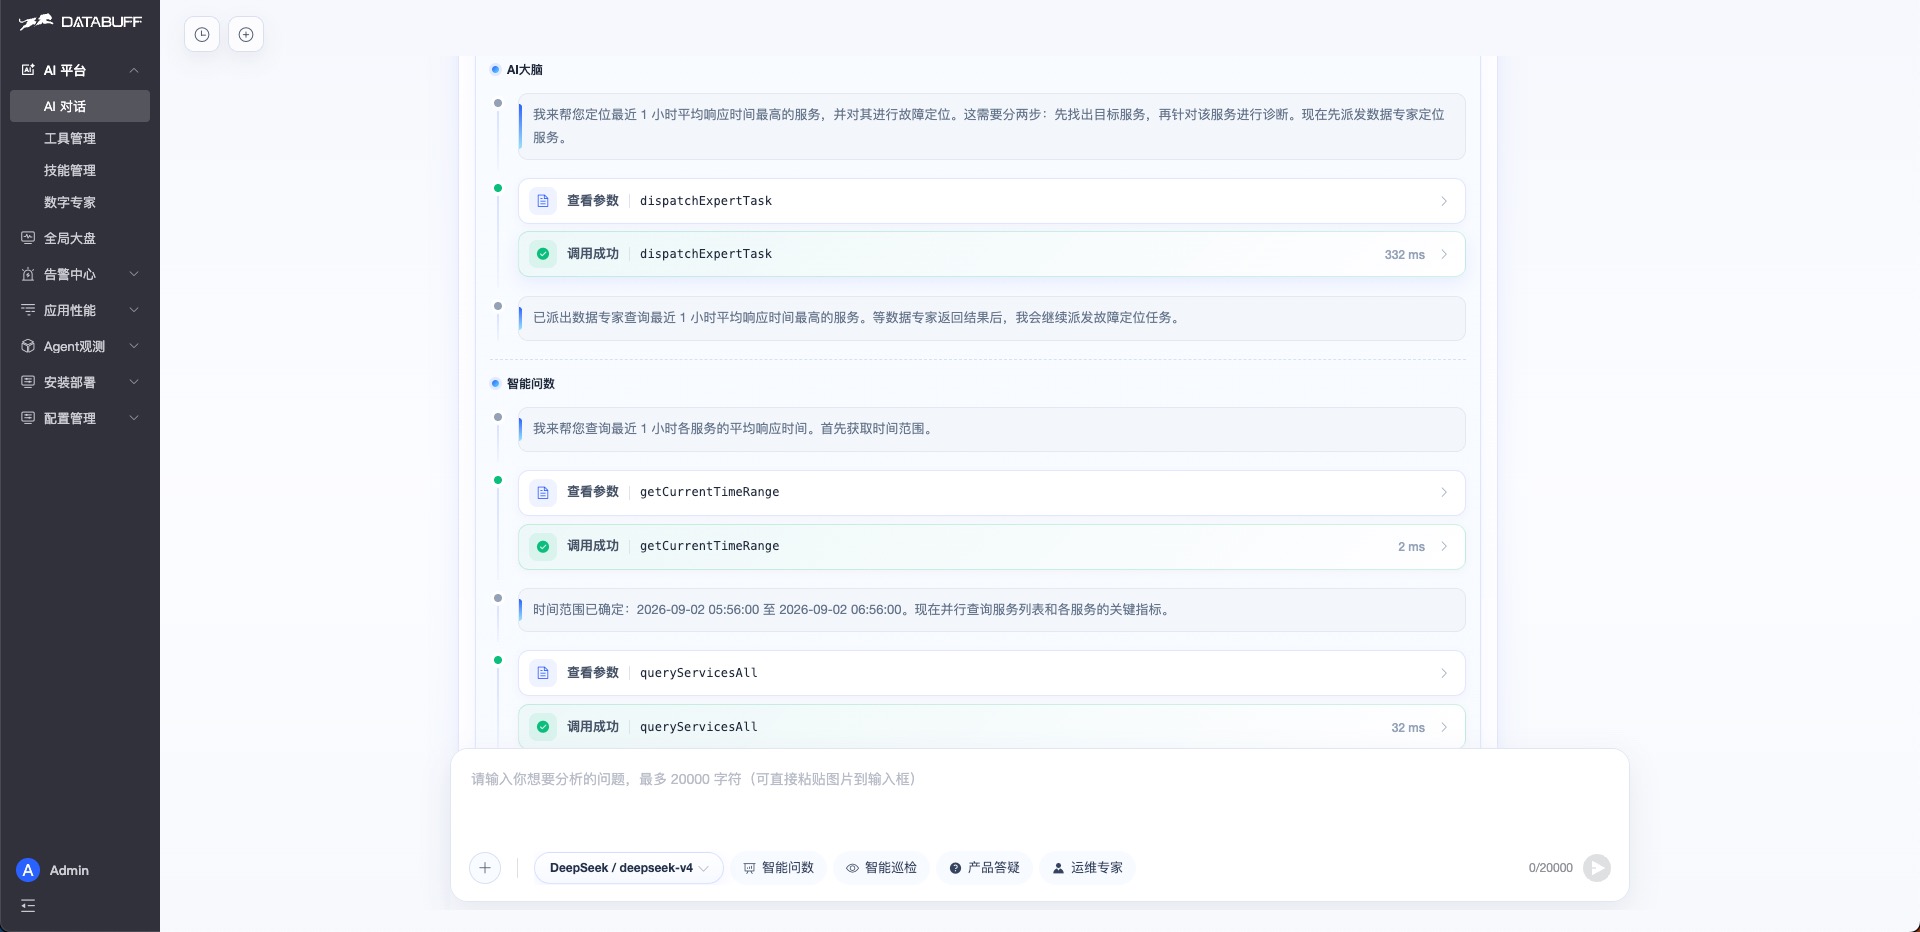
- On the table, service-a averages 240ms, the highest in this batch.
- service-b is 70ms; service-a is about 3.4× that. Fault localization stays on service-a.
- Both Java entries show 0% error rate — looks fine at a glance. MySQL error rate is 33.33%, which is high, but it isn’t the slowest, so it isn’t the main target yet.
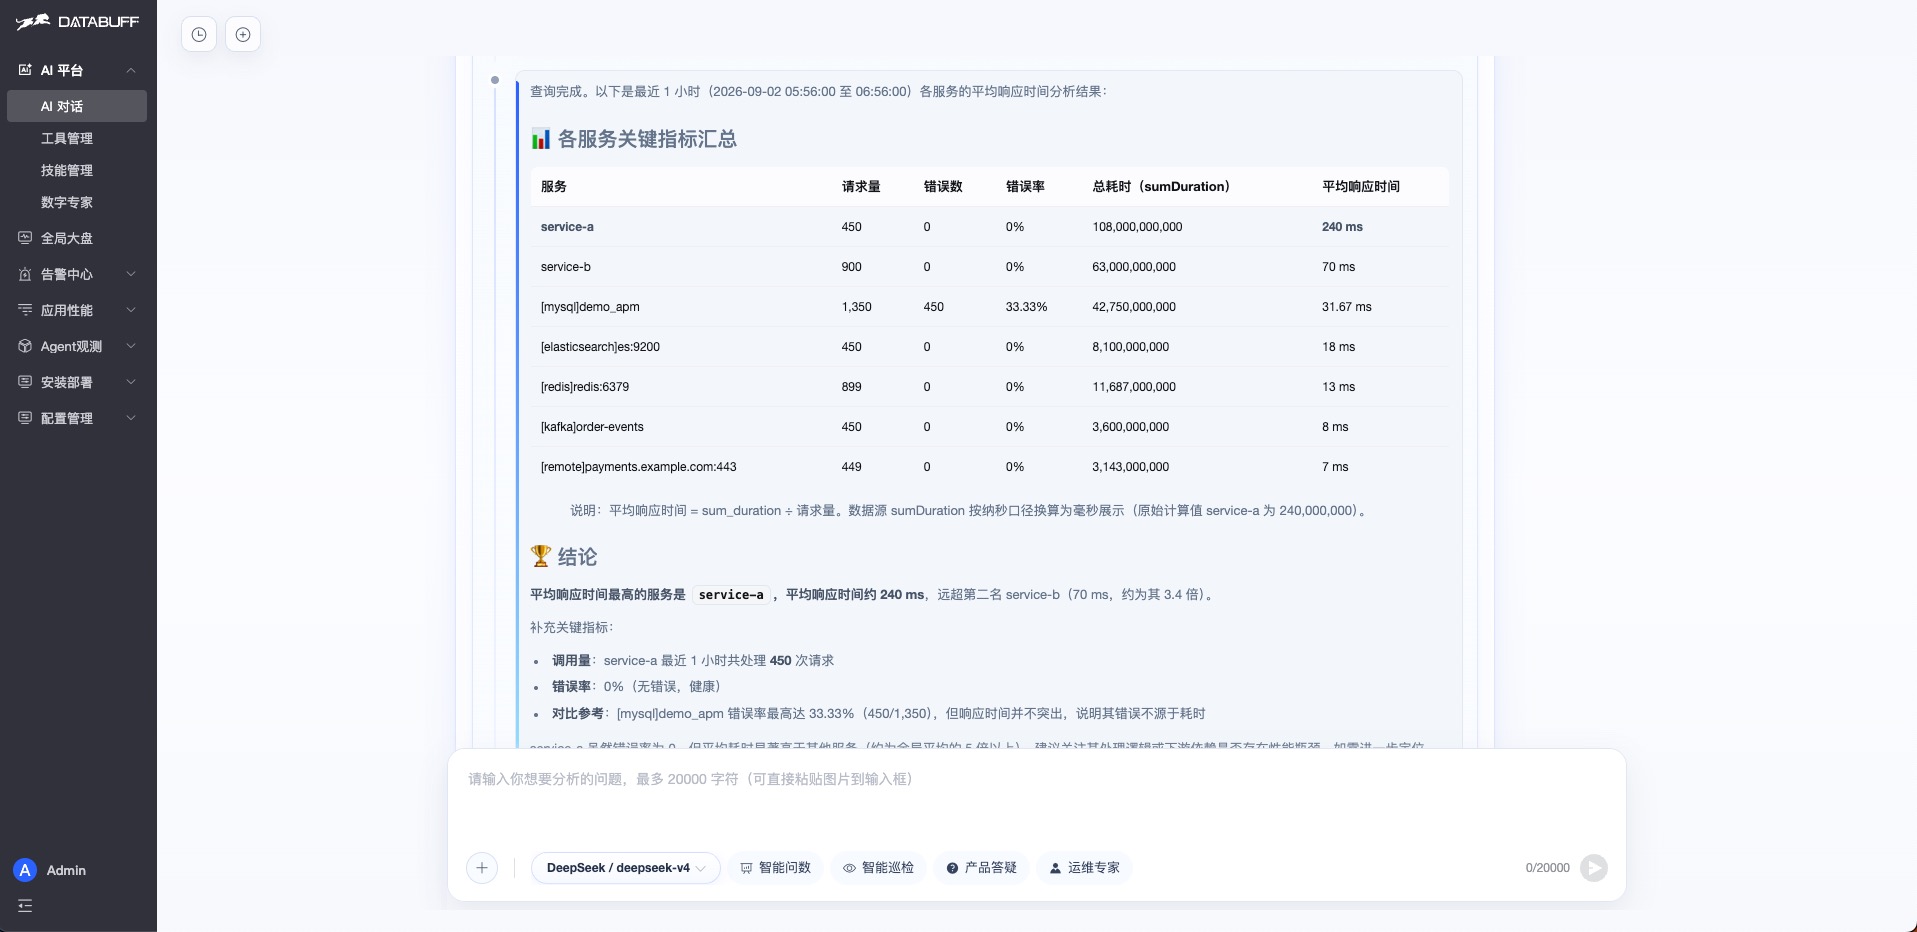
- service-a itself: entry error rate 0%, no ERROR, no failed traces, 240ms is a flat line, not a sudden blast.
- The red dot is downstream
[mysql]demo_apm, with 60 “entry error rate too high” alerts. - Itself is green, the database keeps ringing, the two pages don’t match.
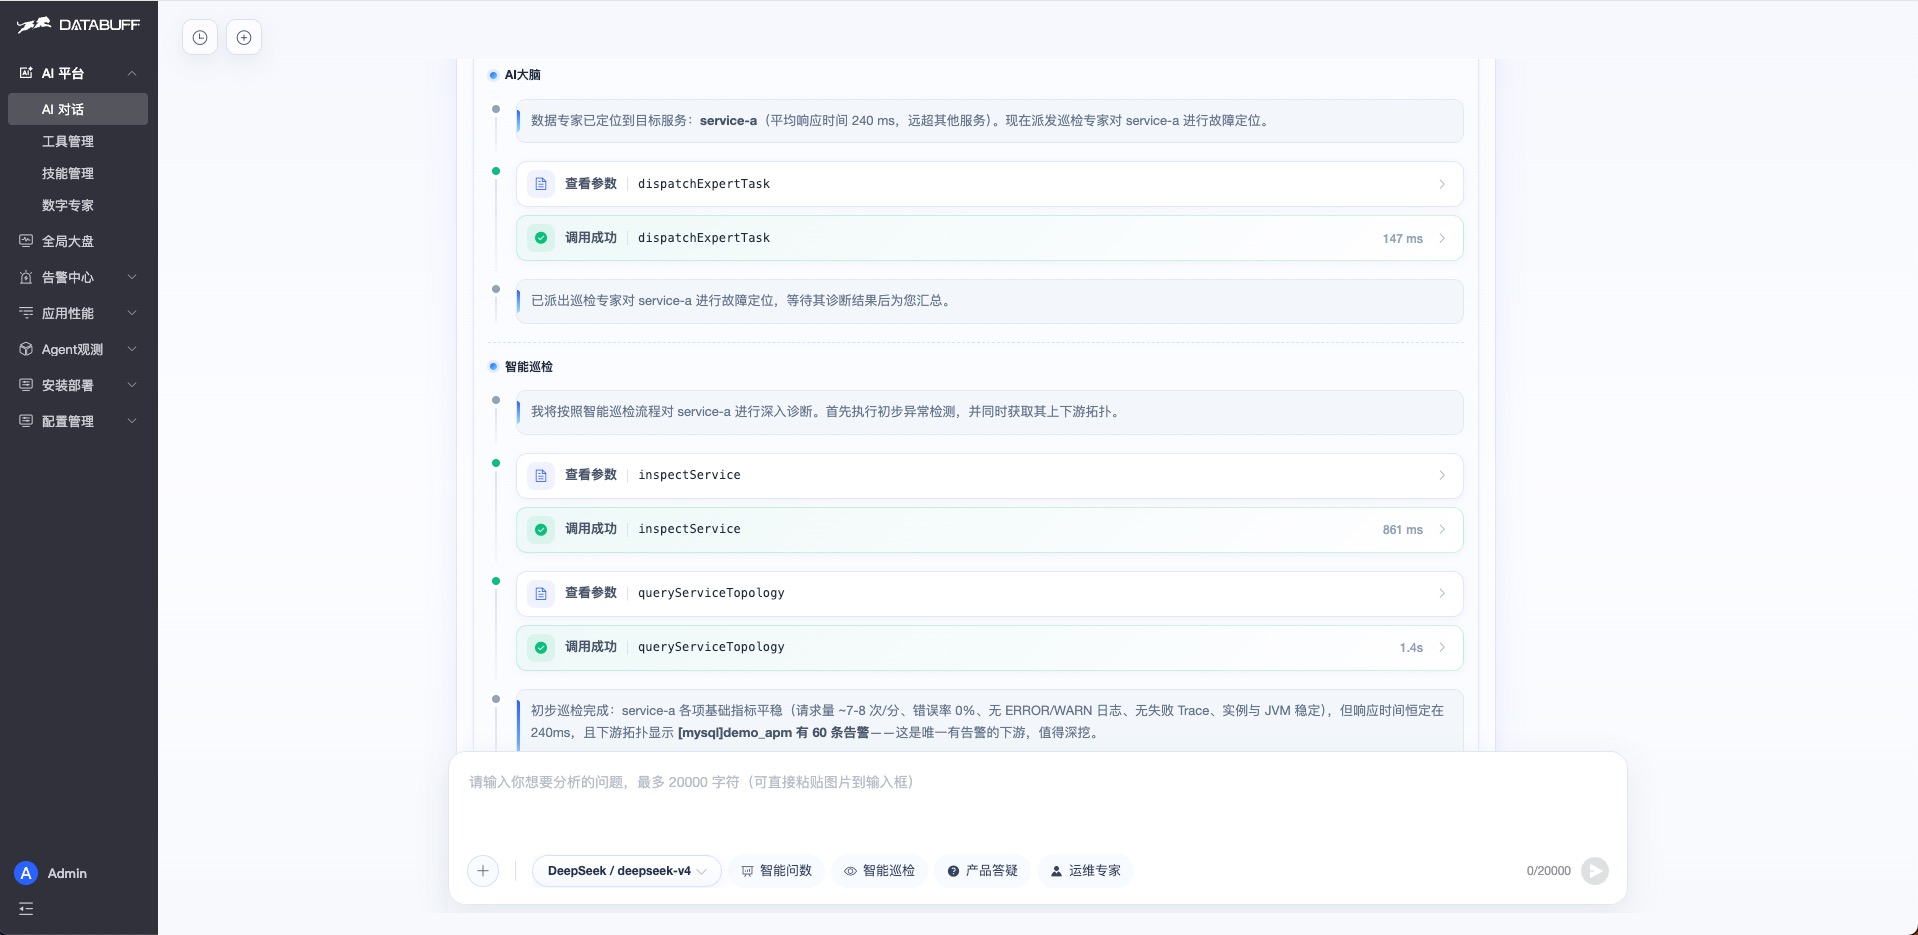
- Sampled traces are all
GET /demo/checkout, status 200, duration pinned at 240ms. The entry hop shows nothing wrong. - The database still has 60 alerts, but dependency stats write MySQL errors as 0.
- The two sentences don’t match. The only move left is to split one chain.
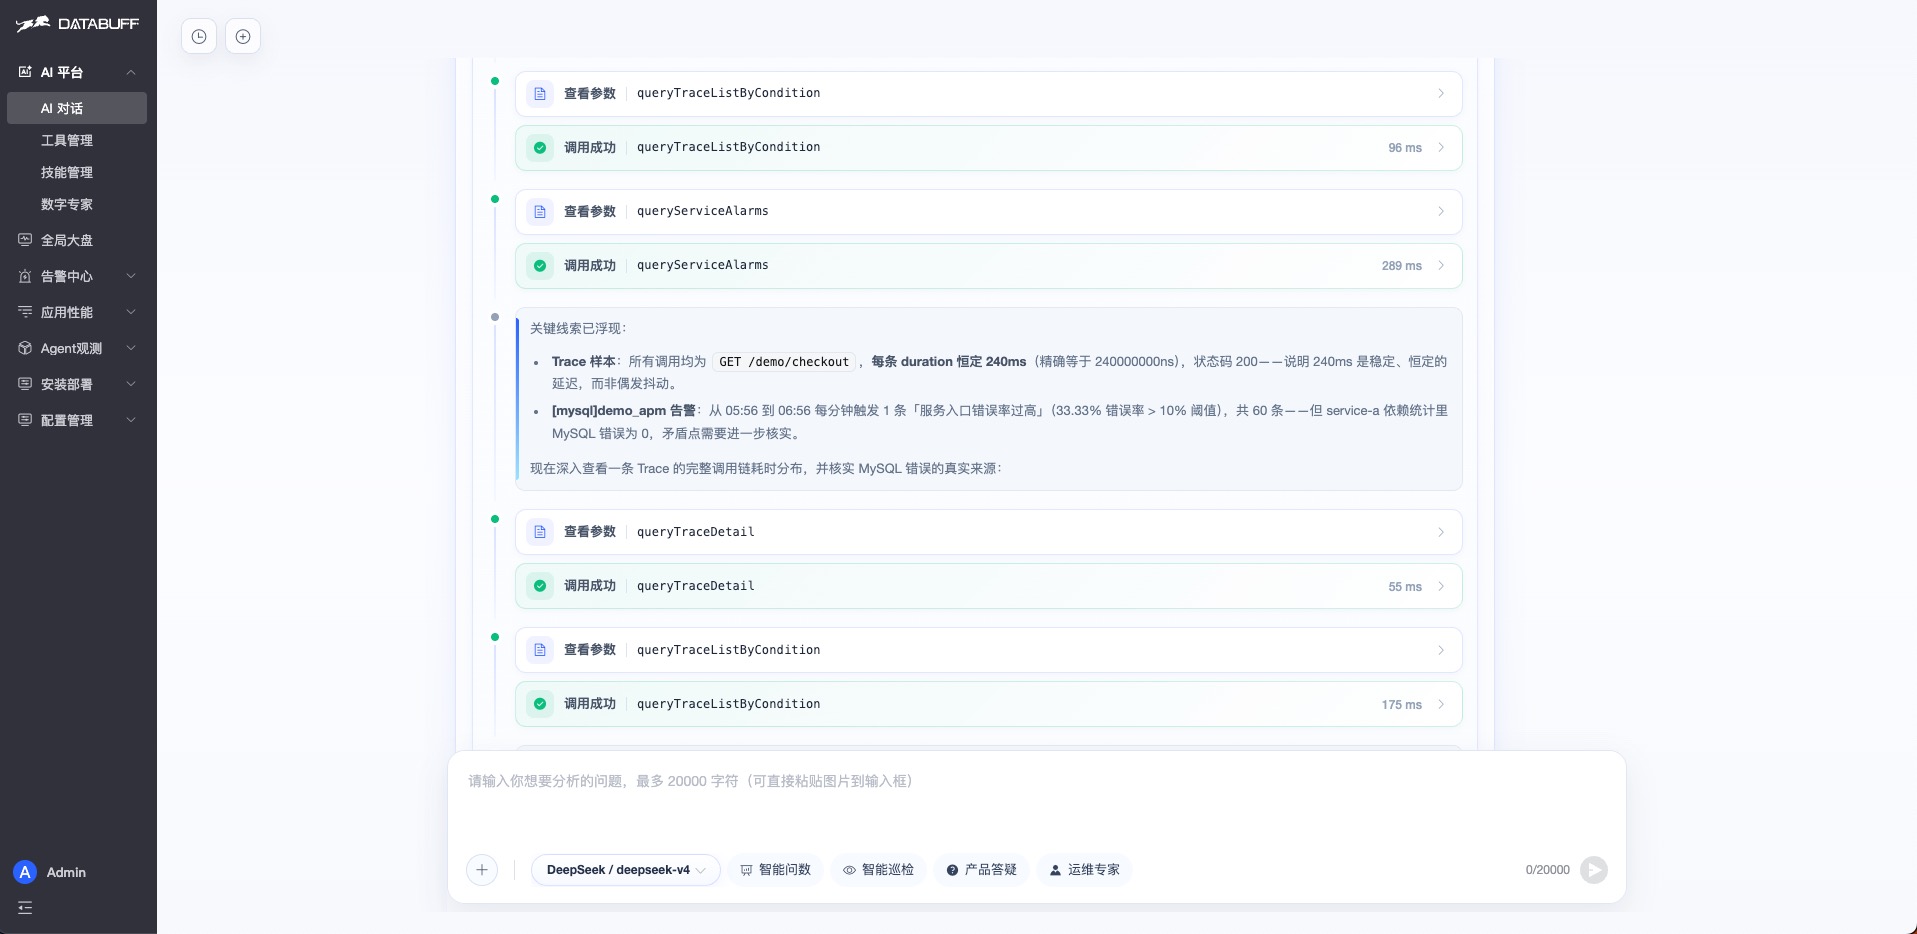
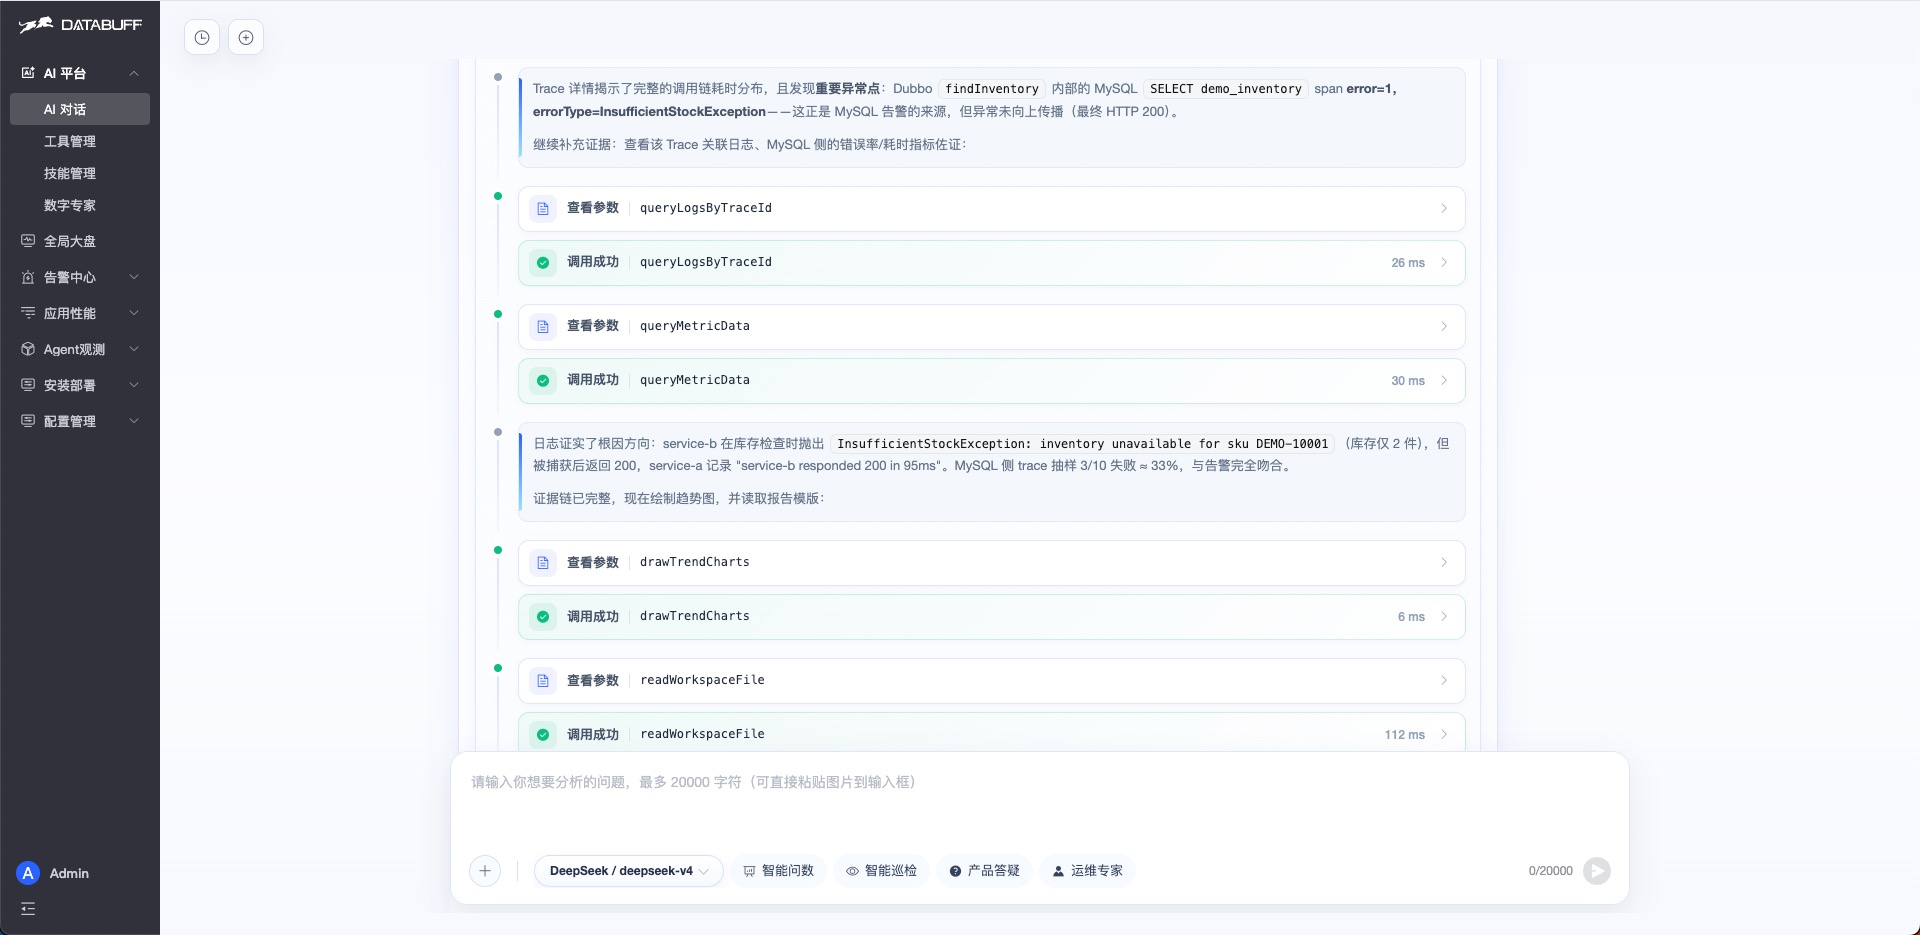
- The hop that blew up is
SELECT demo_inventory, throwingInsufficientStockException. - The entry still returns 200. The same log line matches SKU
DEMO-10001, inventory left at 2. - service-a recorded that service-b returned 200, so the entry stayed green and never went red.
- The chat ends with an HTML inspection report, not just “done.”
- Verdict, trends, call tree, advice — the next section reads the report’s own chapters. This step doesn’t copy them first.
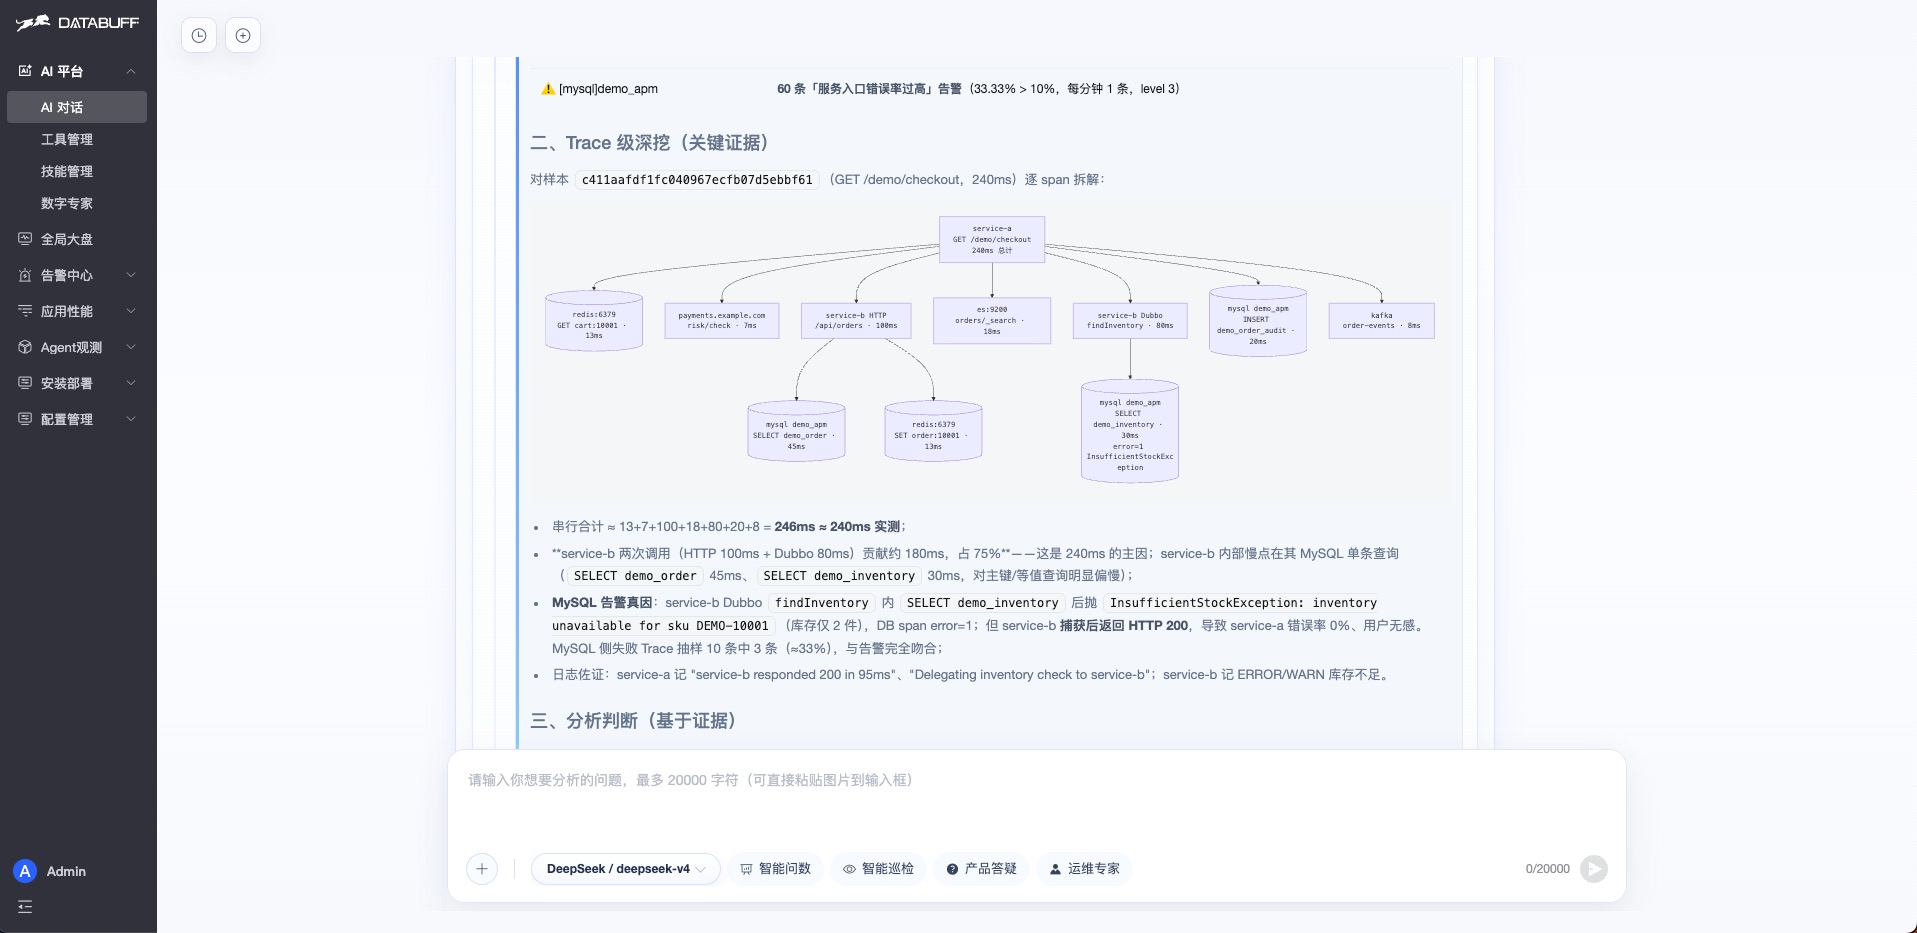
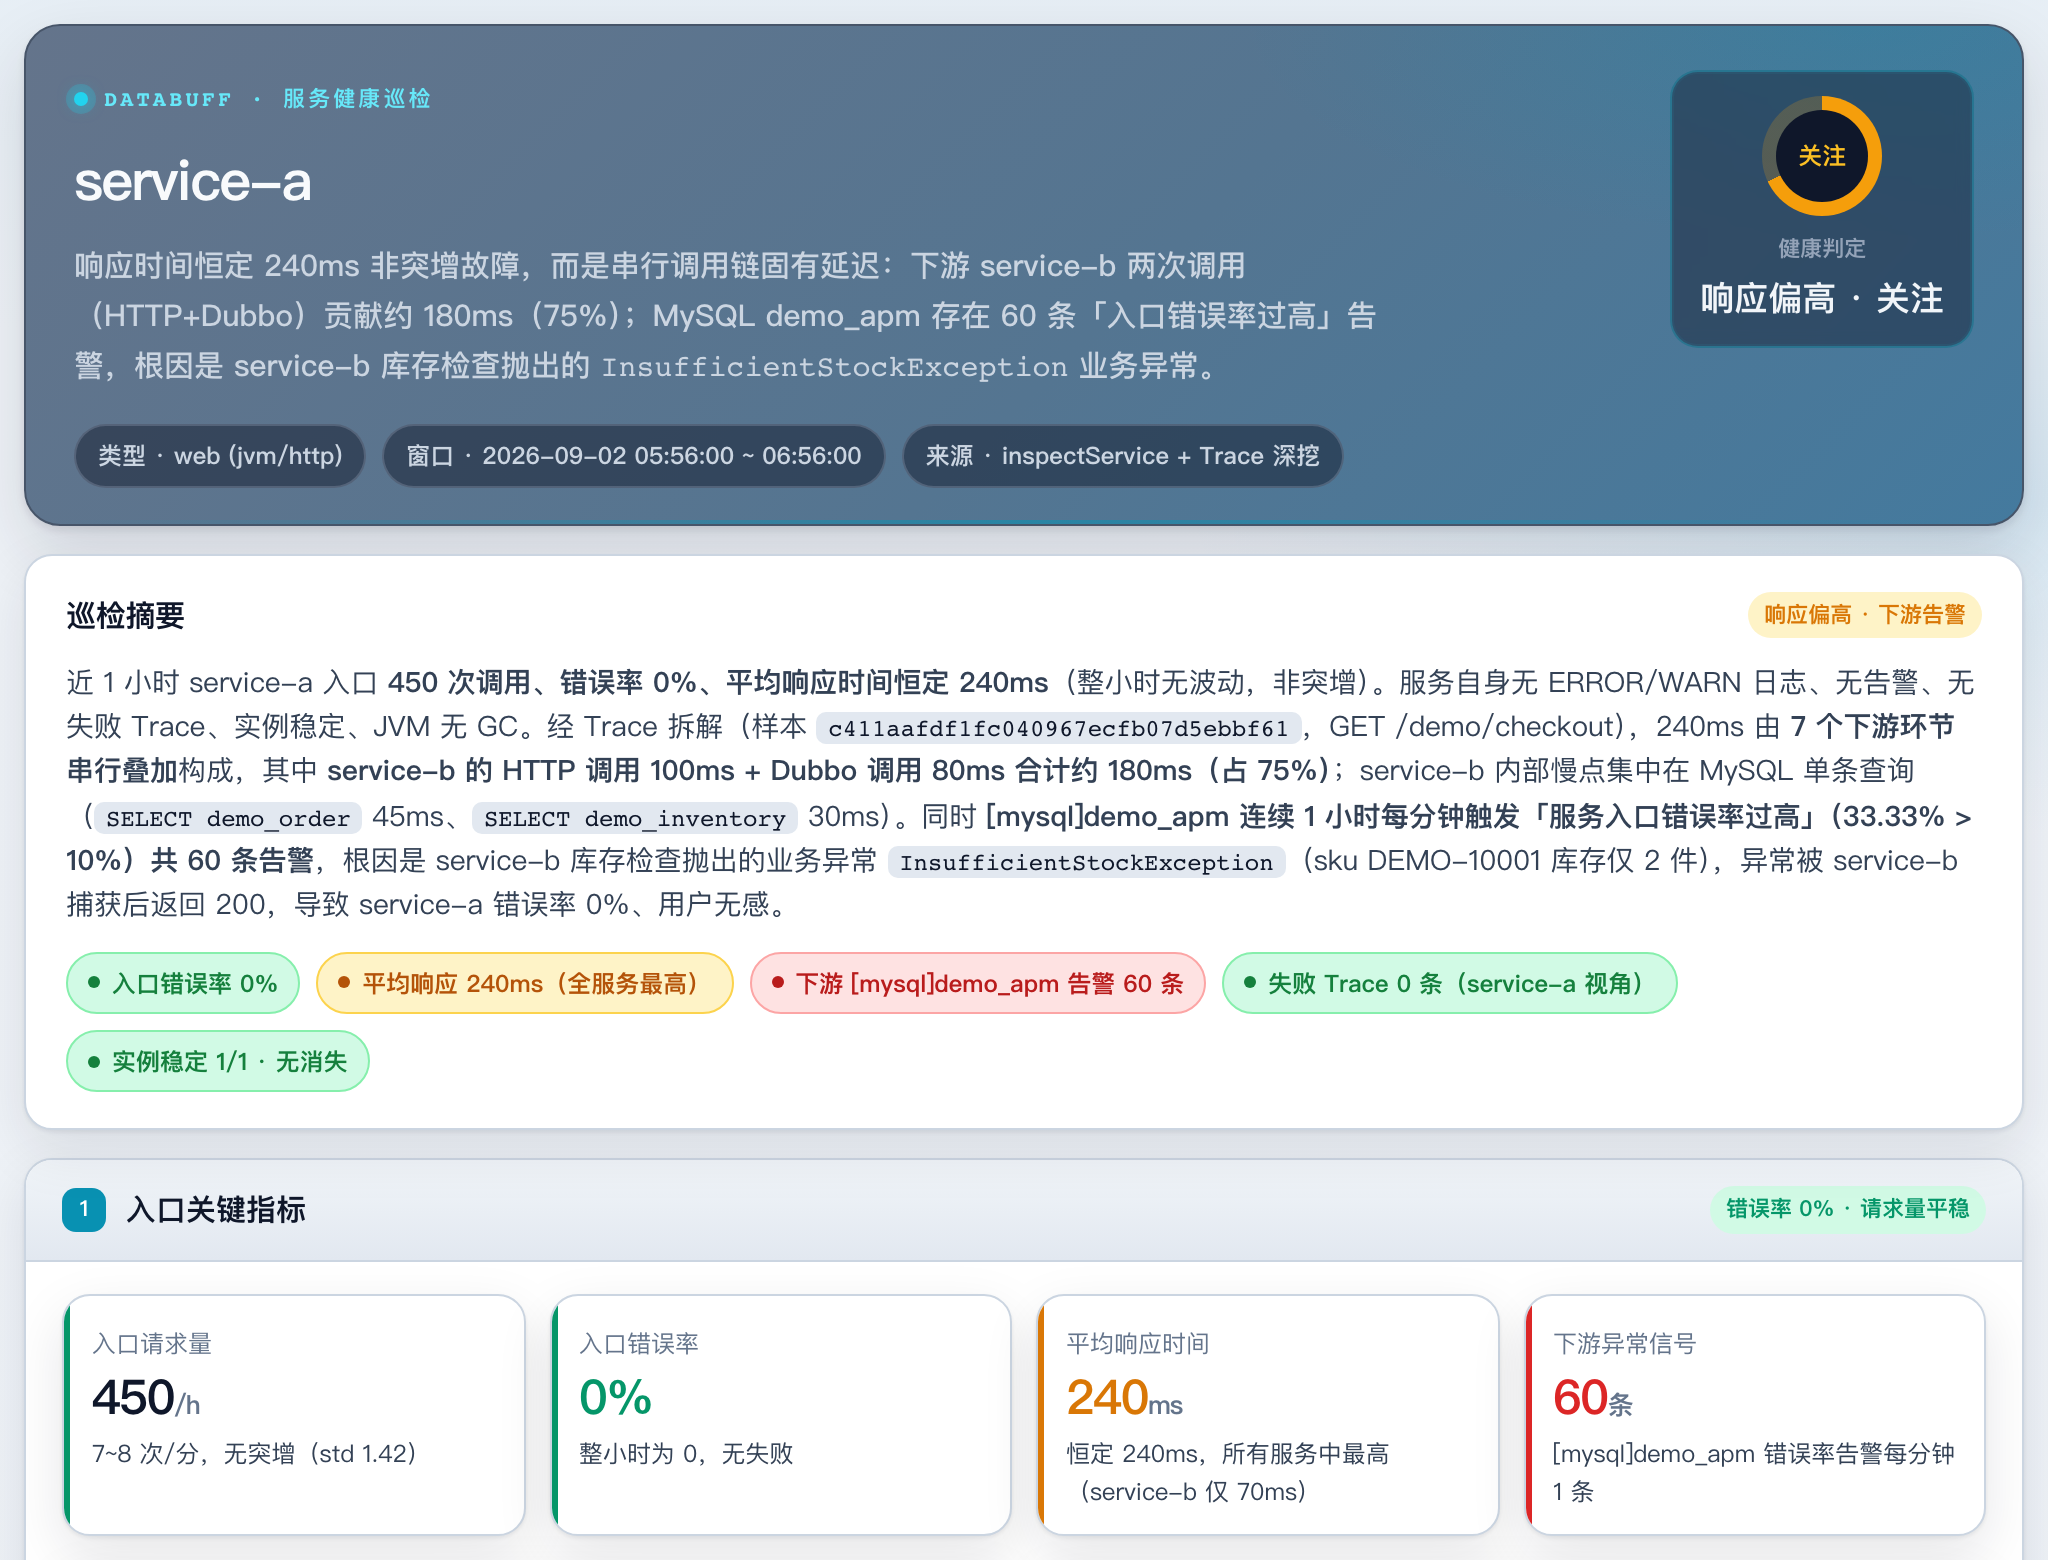
Start with the verdict. The report says “watch,” meaning this chain is worth looking at, not that the service is already down. 240ms is written as serial inherent latency, not a sudden spike.
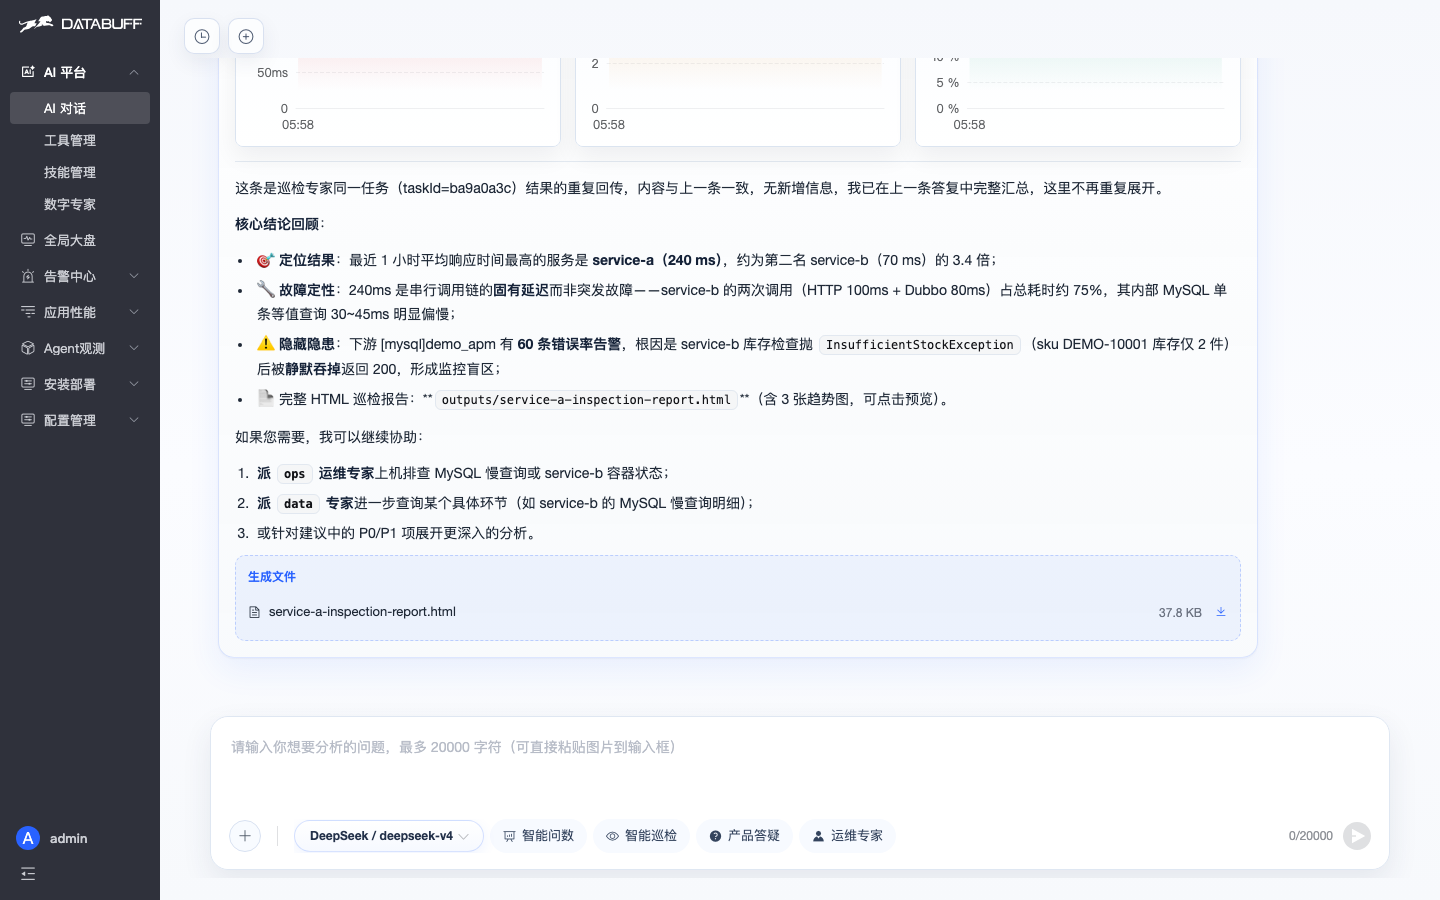
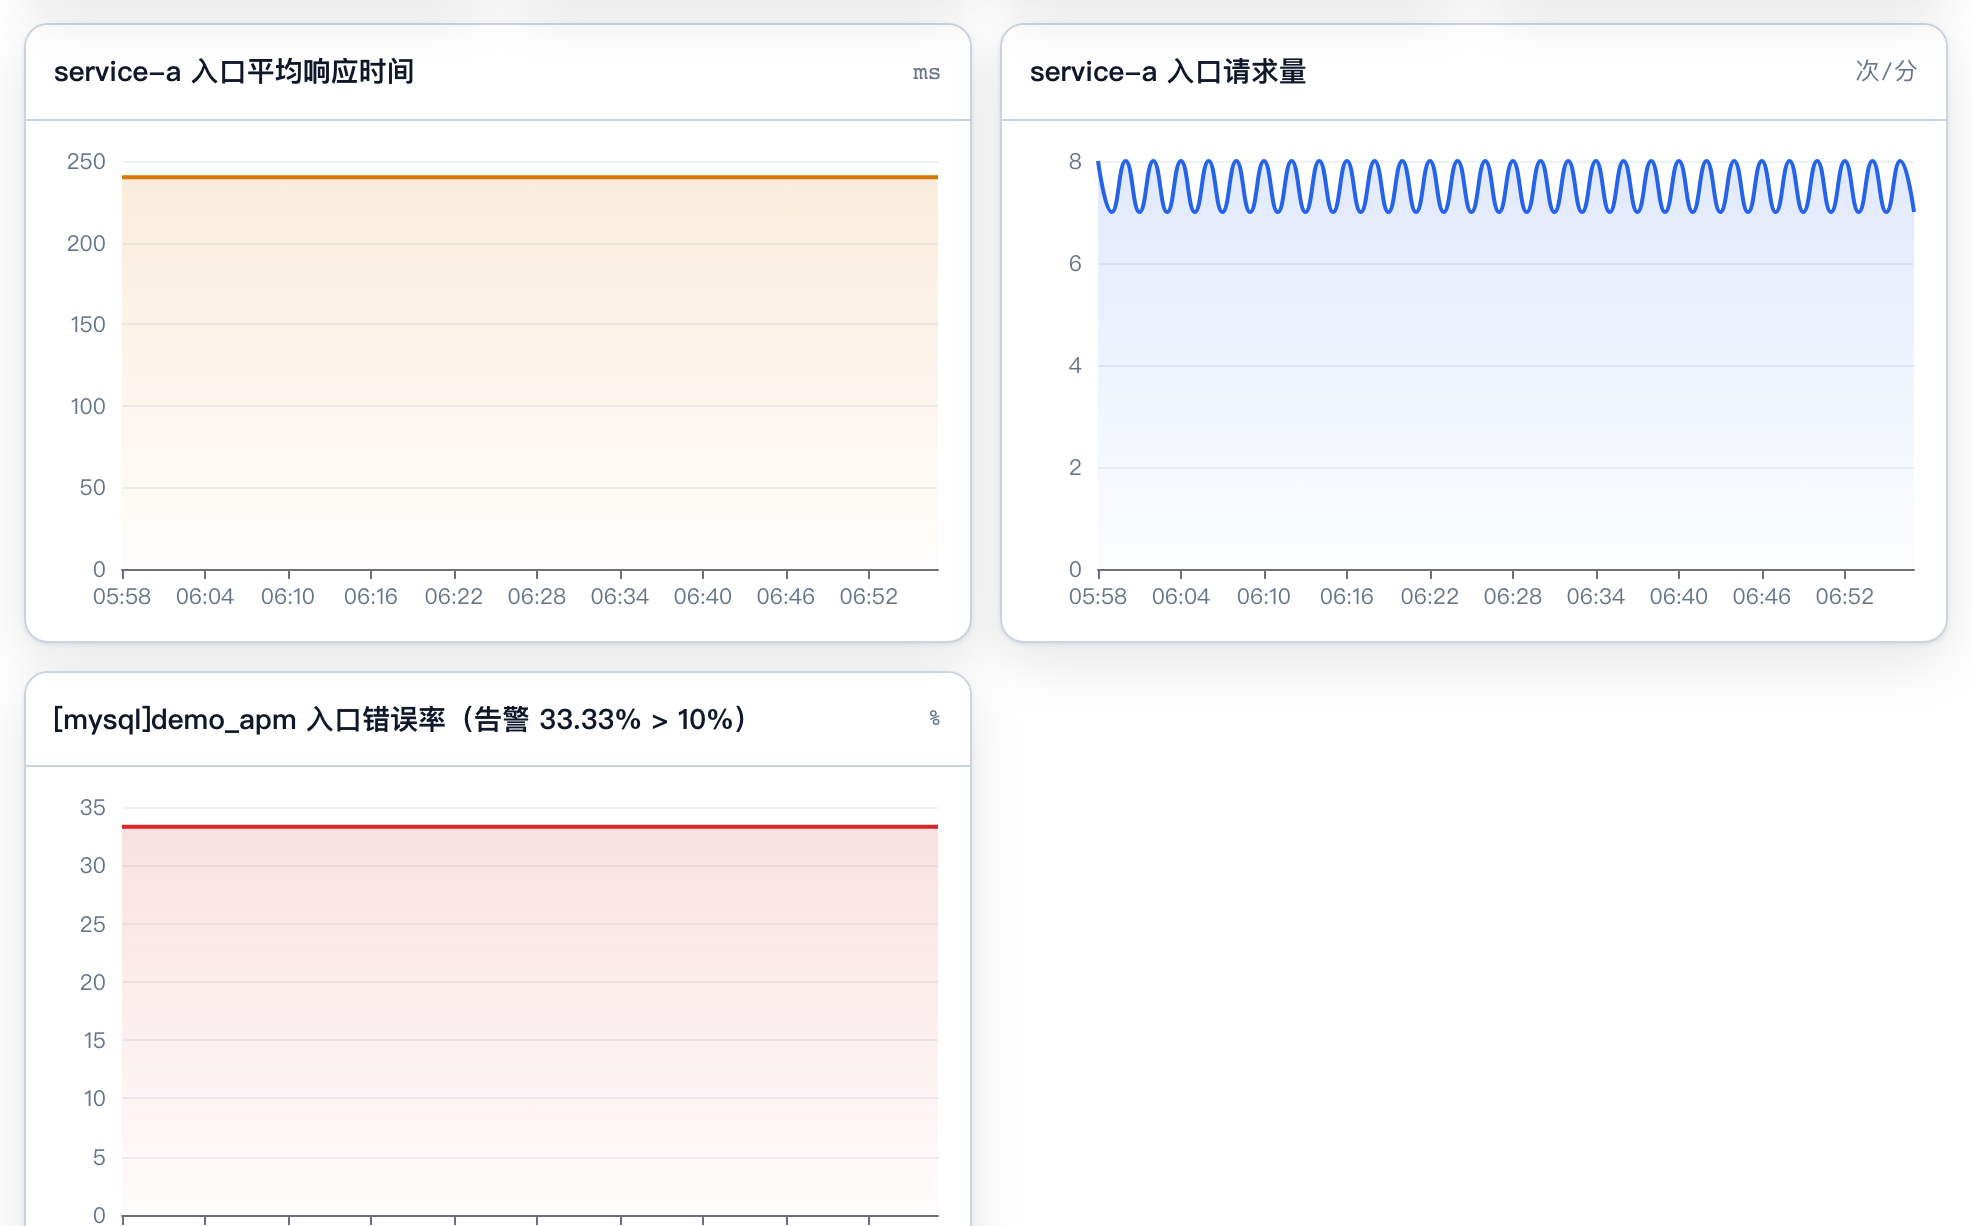
Then the trends. All three charts are flat lines. Response time is pinned at 240ms; request rate is about 7–8/min, also flat; MySQL error rate 33.33%, also flat. This is not a one-off jitter — it was slow for the whole hour, and the alerts kept firing.
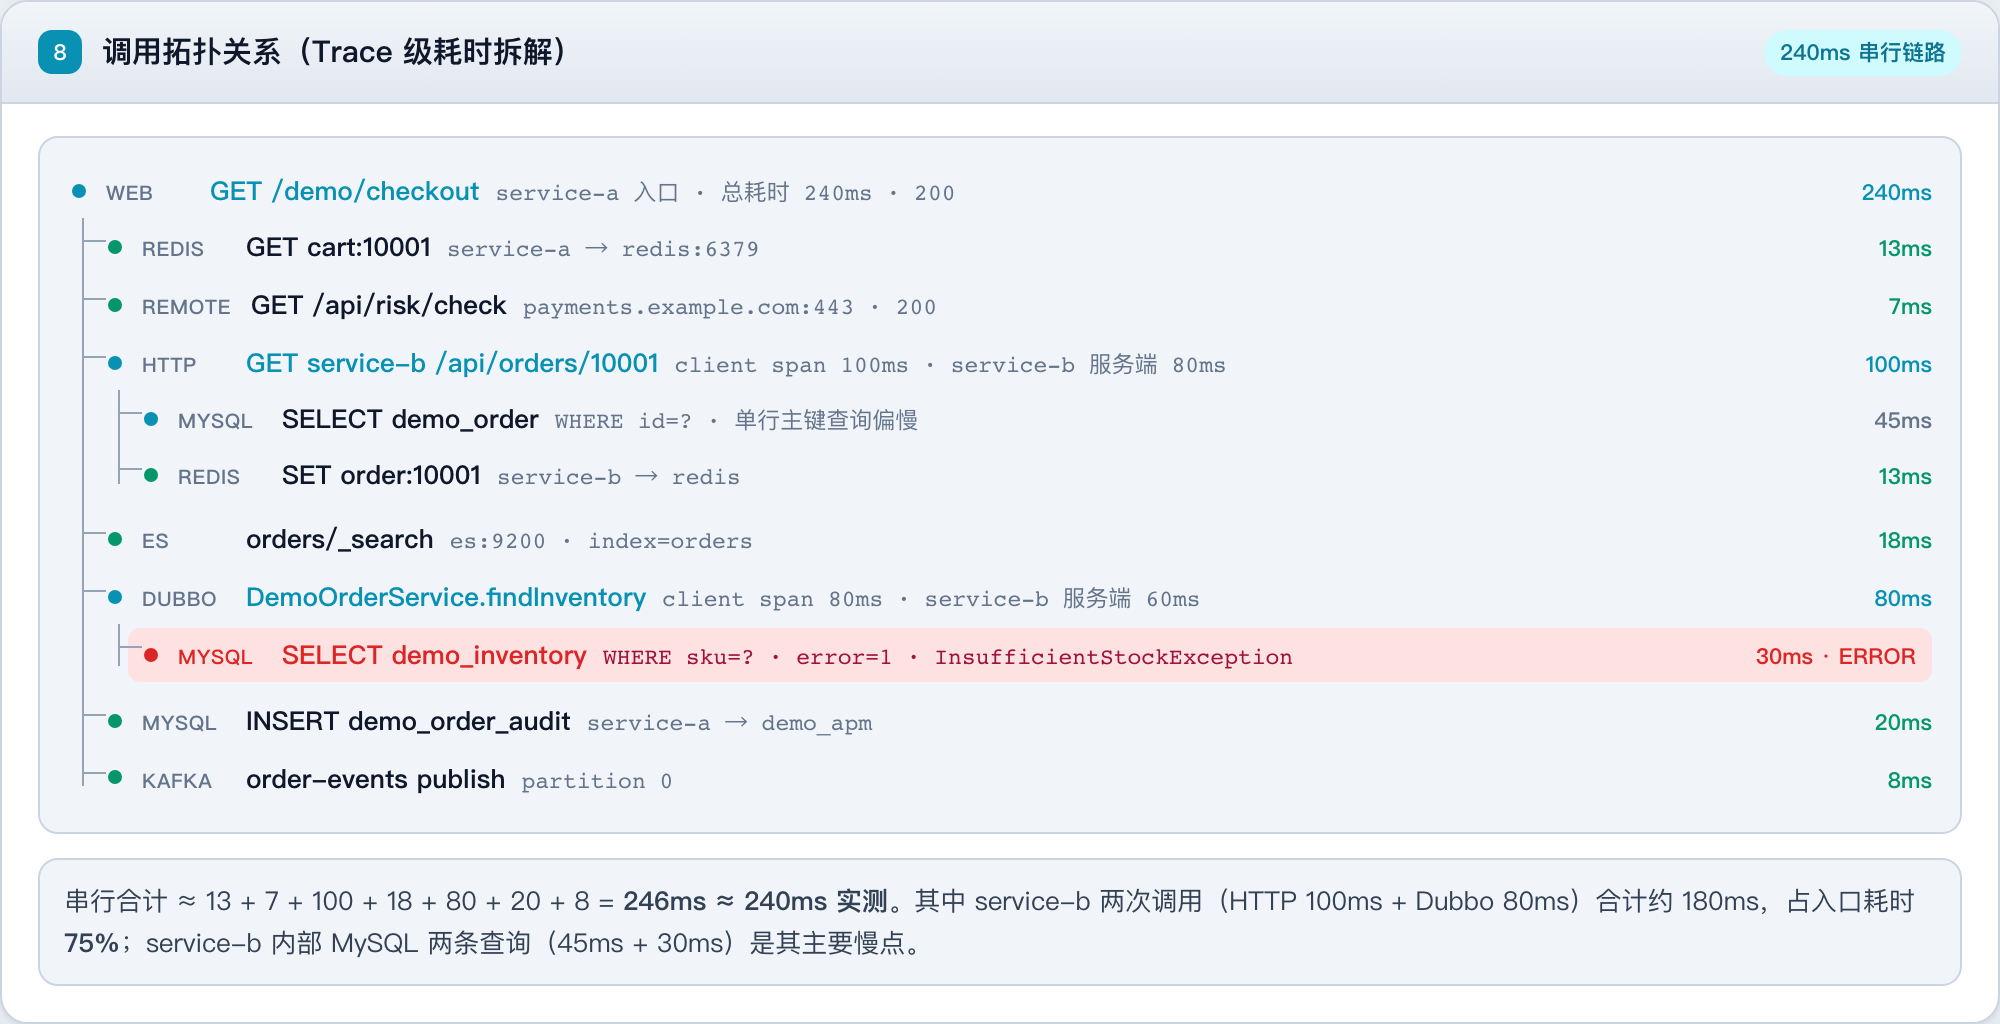
Then the call tree. HTTP to service-b is about 100ms, the Dubbo hop about 80ms; together they are about 75% of the 240ms. The red dot lands on SELECT demo_inventory. Sum the hops and you get about 246ms, which matches the 240ms at the entry — nothing else is missing from the picture.
Then the advice. On latency, the bottleneck is two calls to service-b plus two slow SELECTs, 45ms and 30ms. On alerts, the cause is insufficient stock swallowed: SKU DEMO-10001, inventory 2. The entry returned 200 and hid it.
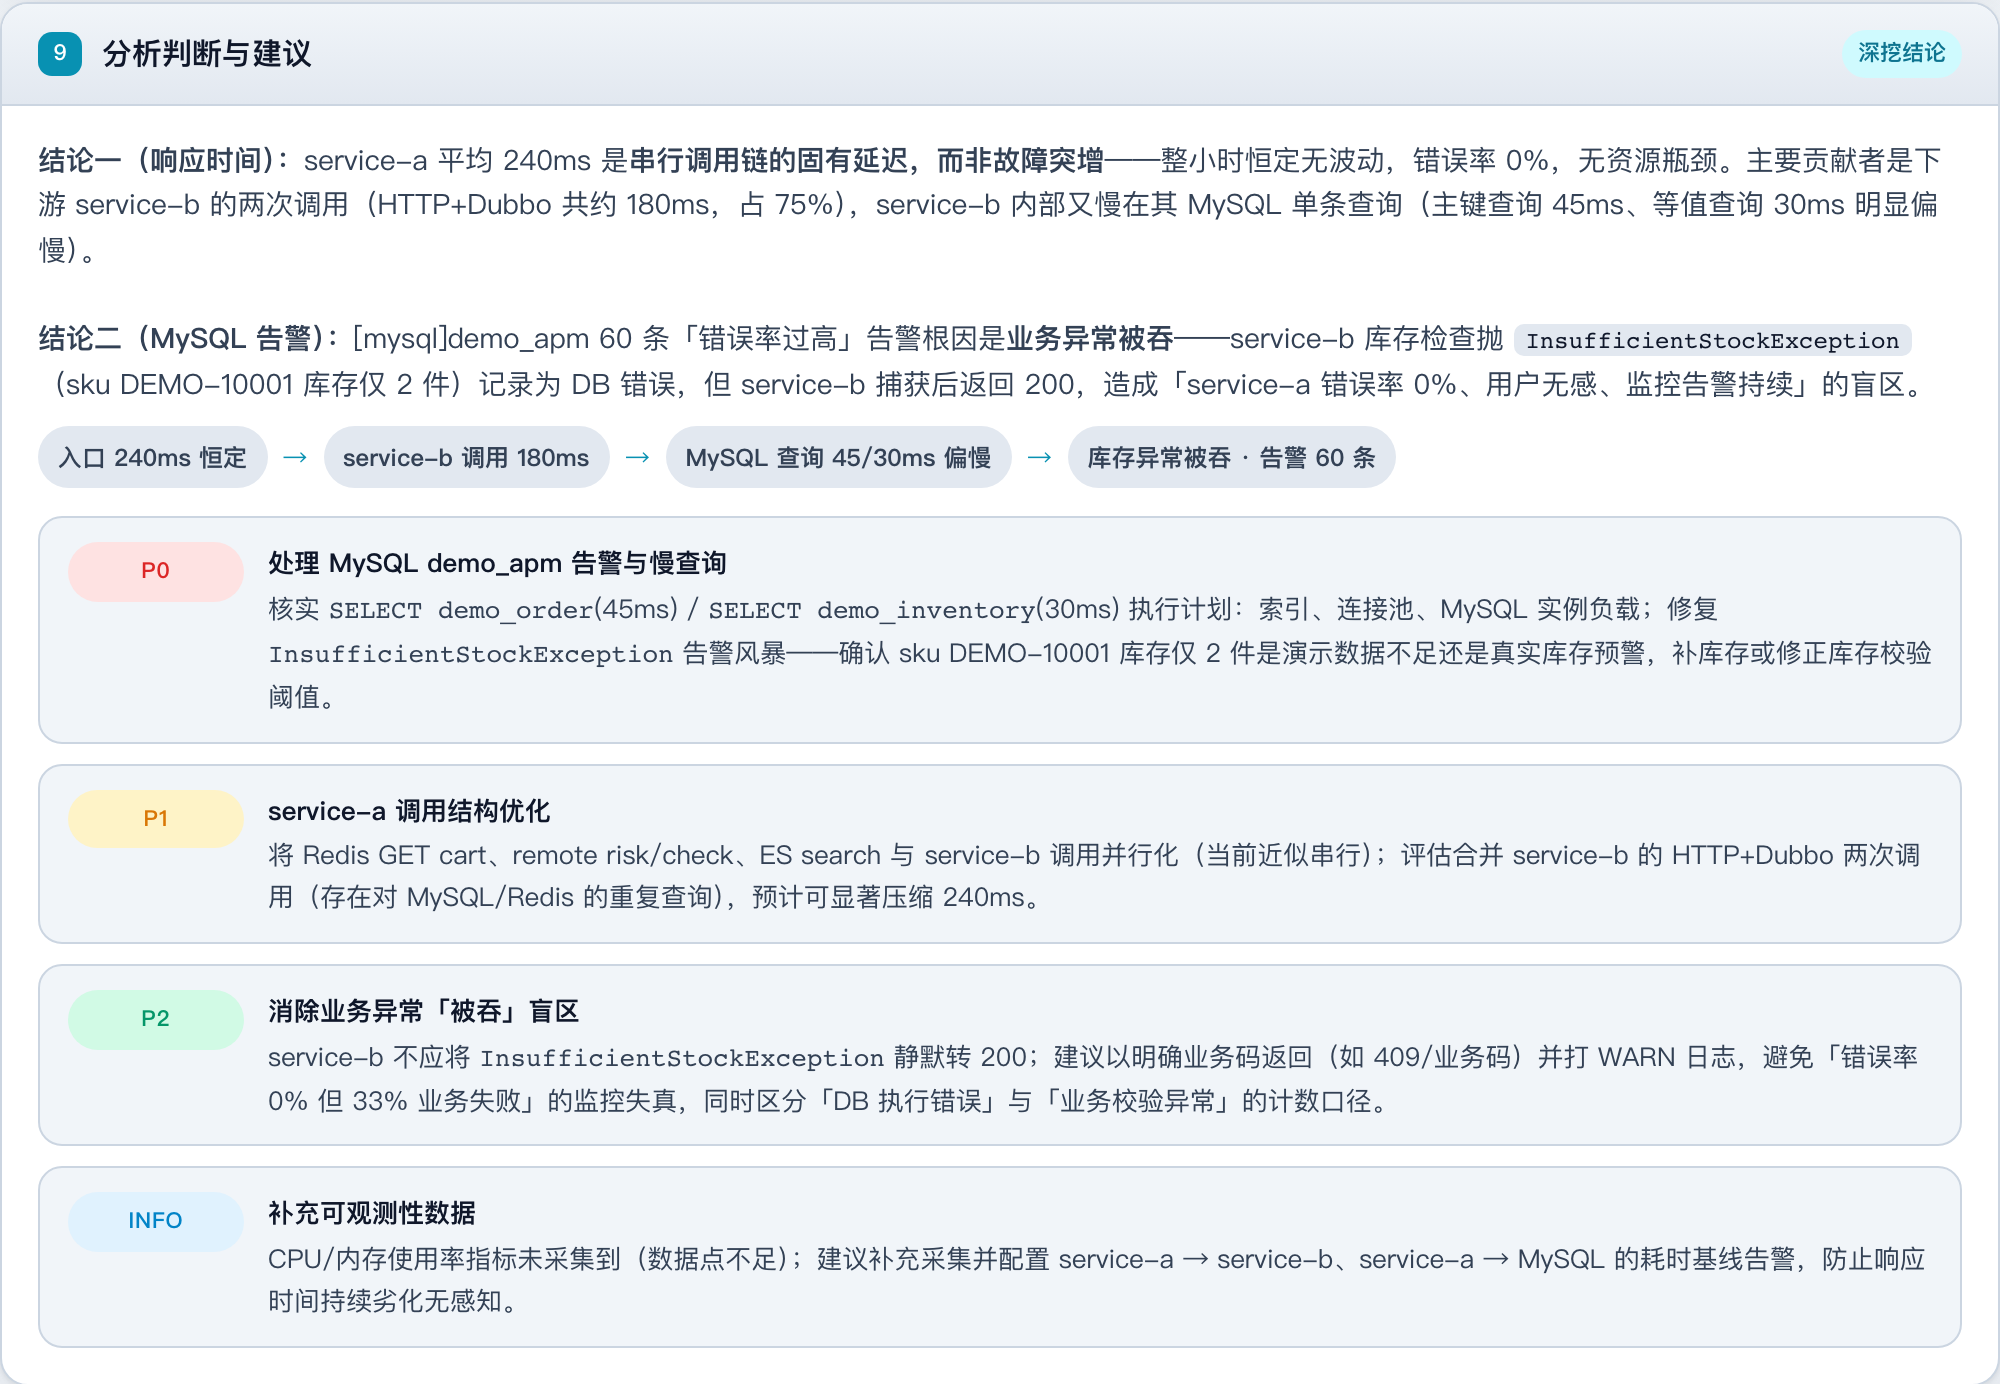
| Priority | What the report wrote |
|---|---|
| P0 | Check why two SELECTs take 45ms / 30ms; whether inventory 2 is demo data or a real stockout |
| P1 | Consider parallelizing or merging the two calls to service-b. This is advice; nothing was measured on how much faster it would be |
| P2 | Don’t silently turn insufficient stock into a 200 |
The comparison is the same job: find the slowest service in the last hour, then localize the insufficient stock swallowed into a 200. Not two different incidents — one job, done twice.
The “about 3 minutes” on the right is wall-clock from this chat’s question to the report, measured. The “about 40 minutes” on the left is an estimate for a practiced human chaining the five items. There was no second stopwatch on a human run.
| Item | What a human does | Practiced estimate | This AI chat |
|---|---|---|---|
| Metric | Open the service list, sort by latency, pick the slowest | ~5 min | ~30 sec |
| Topology | Open the relationship map, line downstream alerts to this service | ~5 min | ~30 sec |
| Call chain | Entry is already 200; open the waterfall and find the stuck hop | ~10 min | ~1 min |
| Logs | Copy the call ID, search the original line on another page | ~8 min | ~30 sec |
| Write the report | Turn what the four pages lined up into a conclusion | ~12 min | ~20 sec |
| Total | Chain the five, still lining up the time window | ~40 min | ~3 min |
About 40 minutes vs about 3 minutes — roughly 13× faster.
This chat took about 3 minutes. The slowest service is service-a, the red dot is on the database, insufficient stock was swallowed into a 200. Metrics, topology, traces, and logs lined up. Nobody had to copy a call ID across four pages.
Lined up is not closed. Whether to restock the 2 units, whether that 200 should keep swallowing this, whether those two SELECTs need a change — the report wrote advice. The call is still a human’s.