If you work in ops, you rarely lack a stack for monitoring, APM, logs, or alerts. When something breaks and you ask “who’s on fire,” you still stitch those stacks together yourself.
You can just ask what’s broken.
It’s called DataBuff, and it’s open source. Repo: https://github.com/databufflabs/databuff. Once data is in, dashboards, alerts, and questions share one stack. The UI goes down to endpoints and slow SQL.
This is not a how-to for one integration. It’s a walk through what you can use today.
- Ingest: where the data comes from, which collectors, which backend.
- Store: where it lives, how many components you keep.
- See: how far the UI can drill.
- Alert: how it fires, where you write the rule.
- Analyze: whether you can ask instead of flipping charts.
- Operate: what you do when the platform itself is stuck or dropping data.
- Help: who answers when you don’t know how to use it or wire it up.
Start with how data gets in.
Change language or collector, keep the same backend. Four paths into one Ingest.
Language agents cover Java, Python, Node, Go, .NET, PHP, Ruby. Point the official exporter at 4317 (gRPC) or 4318 (HTTP). The Nginx module uses the same OTLP path. Don’t want a process probe? Use eBPF — Grafana’s OBI. Browser OTel traffic is accepted too. If you still run SkyWalking, the report port is 11800. You don’t have to swap old probes right away.
- Language agent (OpenTelemetry) Java / Python / Node / Go and more
- eBPF (OpenTelemetry) OBI · no in-process probe
- RUM (browser) page OTLP in
- SkyWalking (legacy probes) port 11800
All four land in DataBuff Ingest: 4317 gRPC · 4318 HTTP · SkyWalking 11800 · traces / metrics / logs.
The install “data access” page already has the official start commands per language. Point the endpoint over.
Data is in. Next question: where it lives, and how many pieces you maintain. DataBuff is Ingest to receive, Doris to store, Web to see and ask. No extra Kafka or Elasticsearch in the middle. Topology, golden metrics, alerts, and AI queries read the same store.
A common Grafana LGTM kit
- Collect · Alloy / Agent
- Metrics · Prometheus
- Traces · Tempo
- Logs · Loki
- Dashboards · Grafana
DataBuff’s three core pieces
- Ingest receives
- Doris stores · one copy of the data
- Web sees / alerts / AI
We’ve installed and used that Grafana kit on the same machine. The kit is fine. You just switch entries to look things up, and you keep more moving parts. With a small team that’s louder: one less stack is one less late night. 8G RAM is enough to stand it up on a single box.
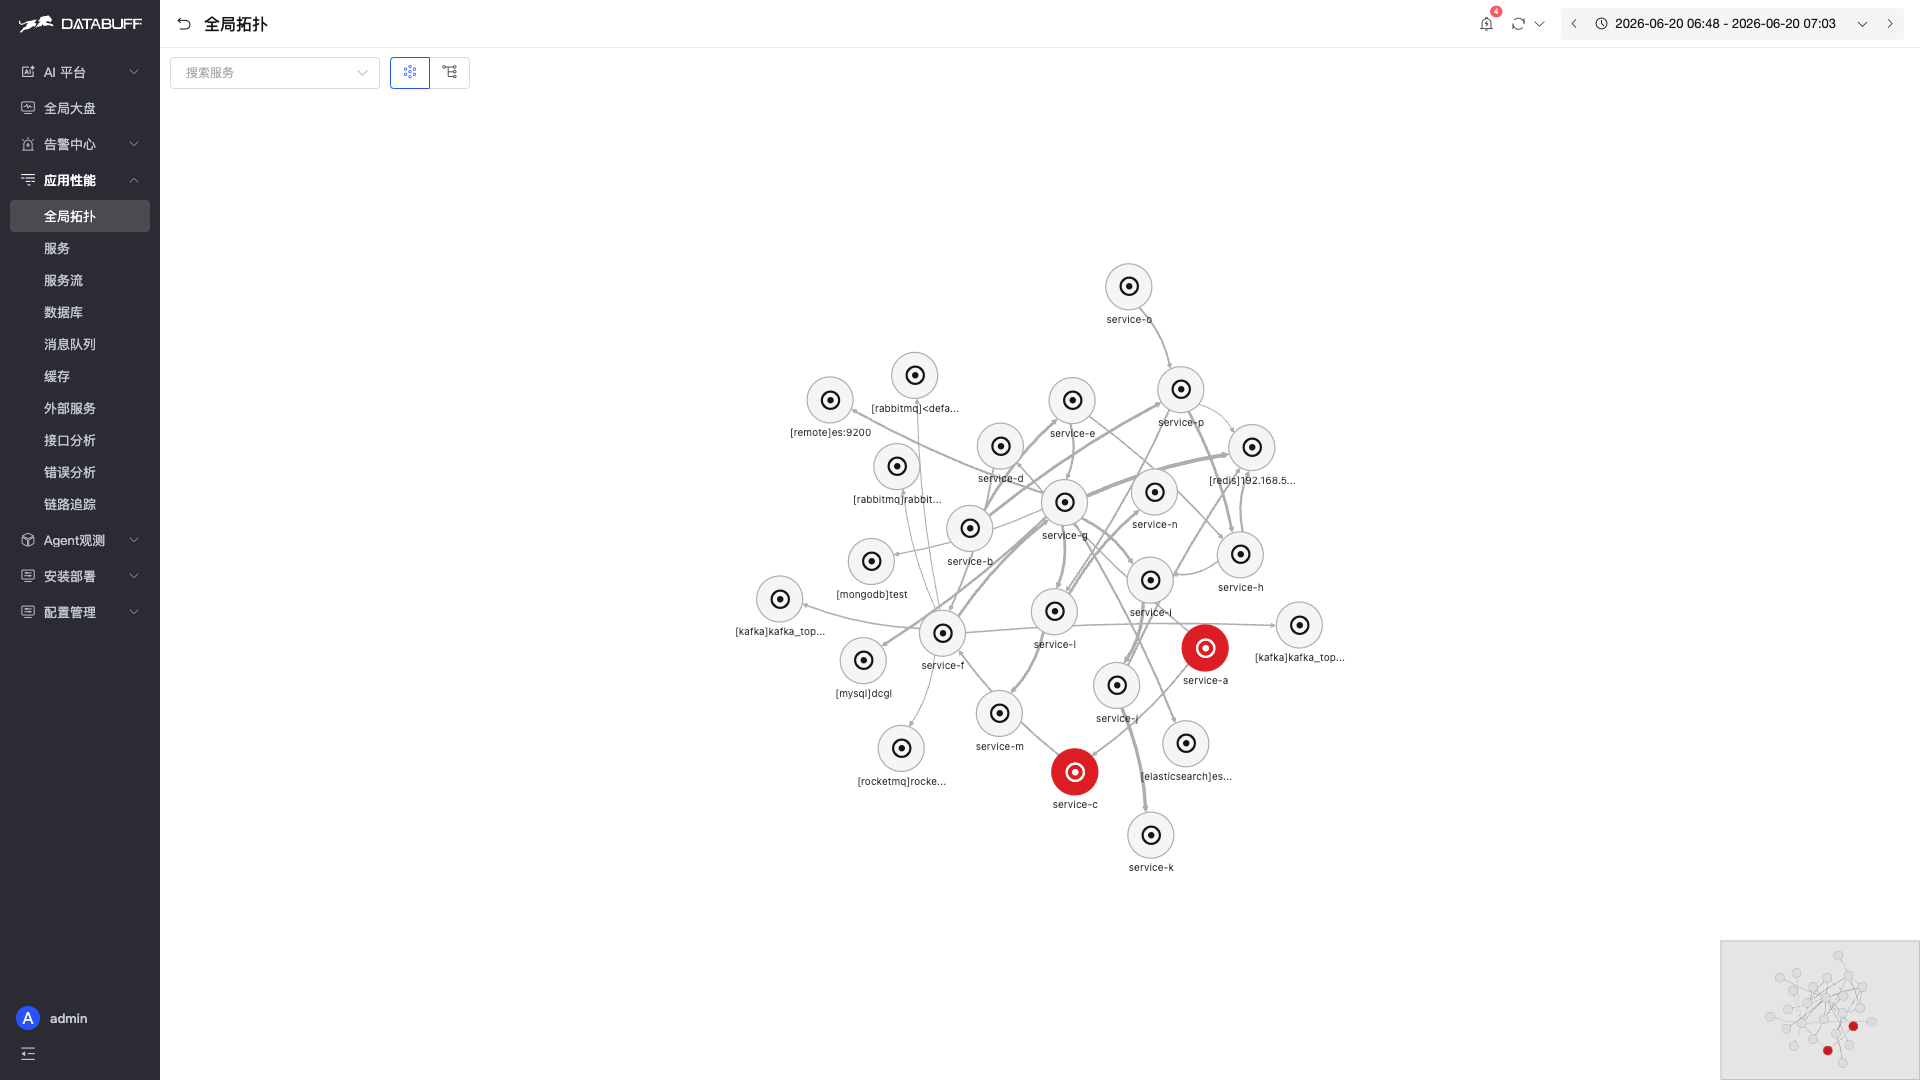
Open global topology. Besides apps you also get bracket nodes — [mysql]…, [kafka]…. Most of those middlewares never got a probe; they come from outbound spans on the caller.
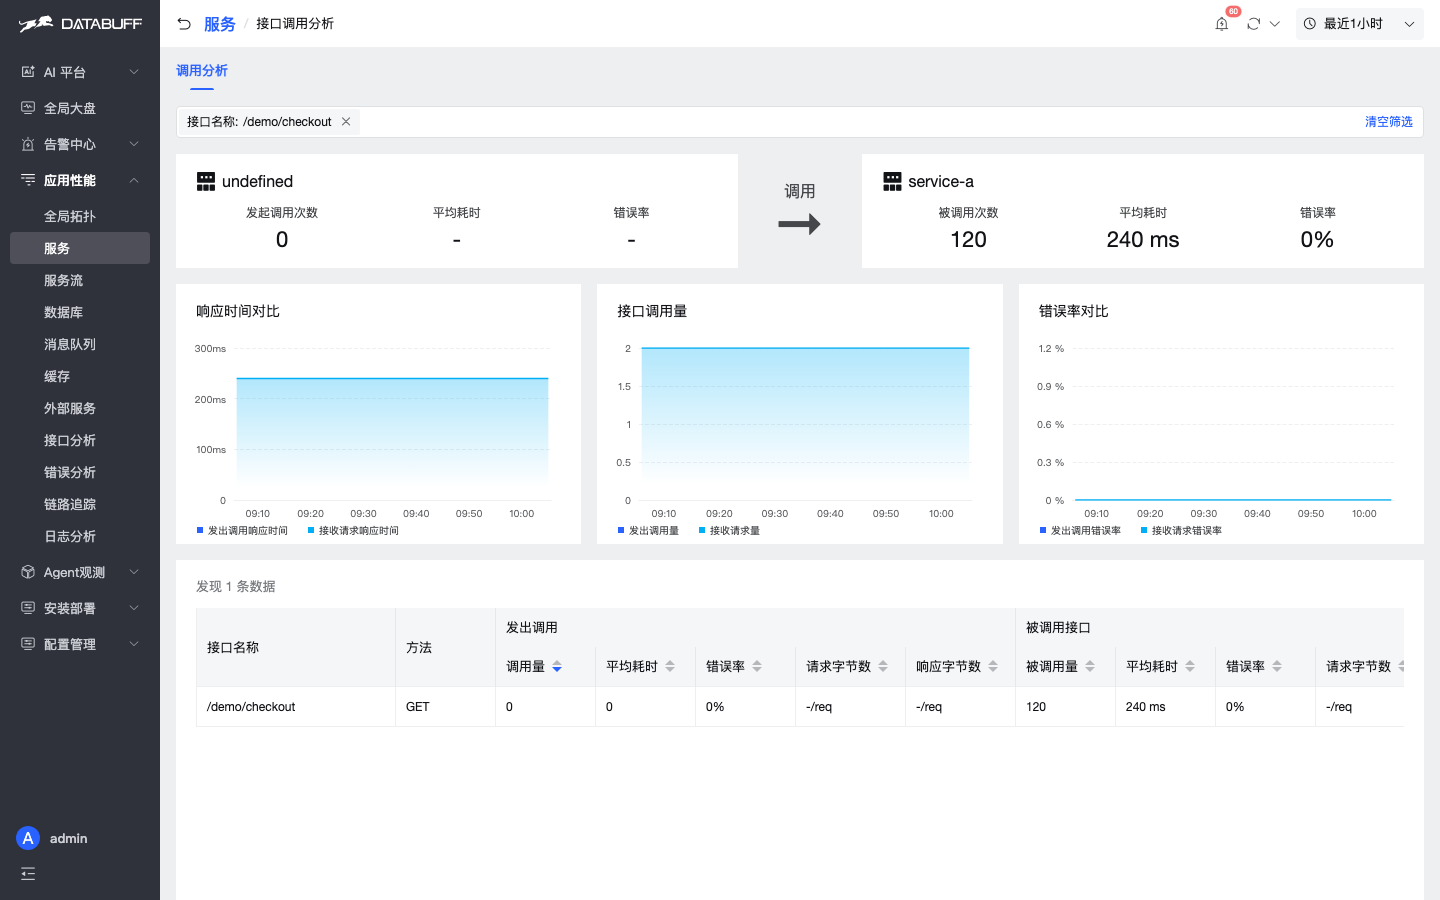
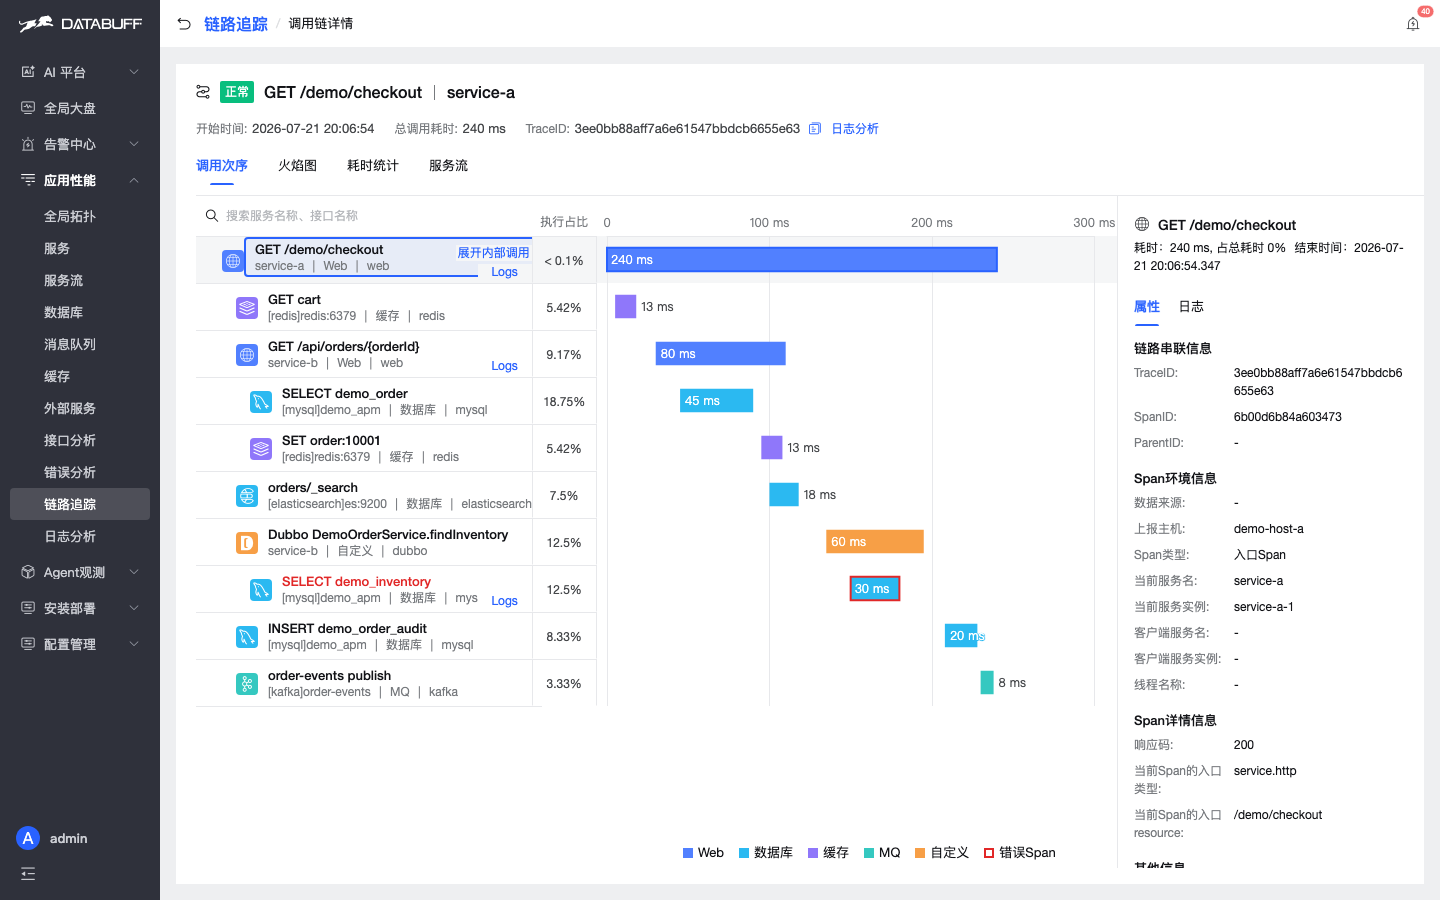
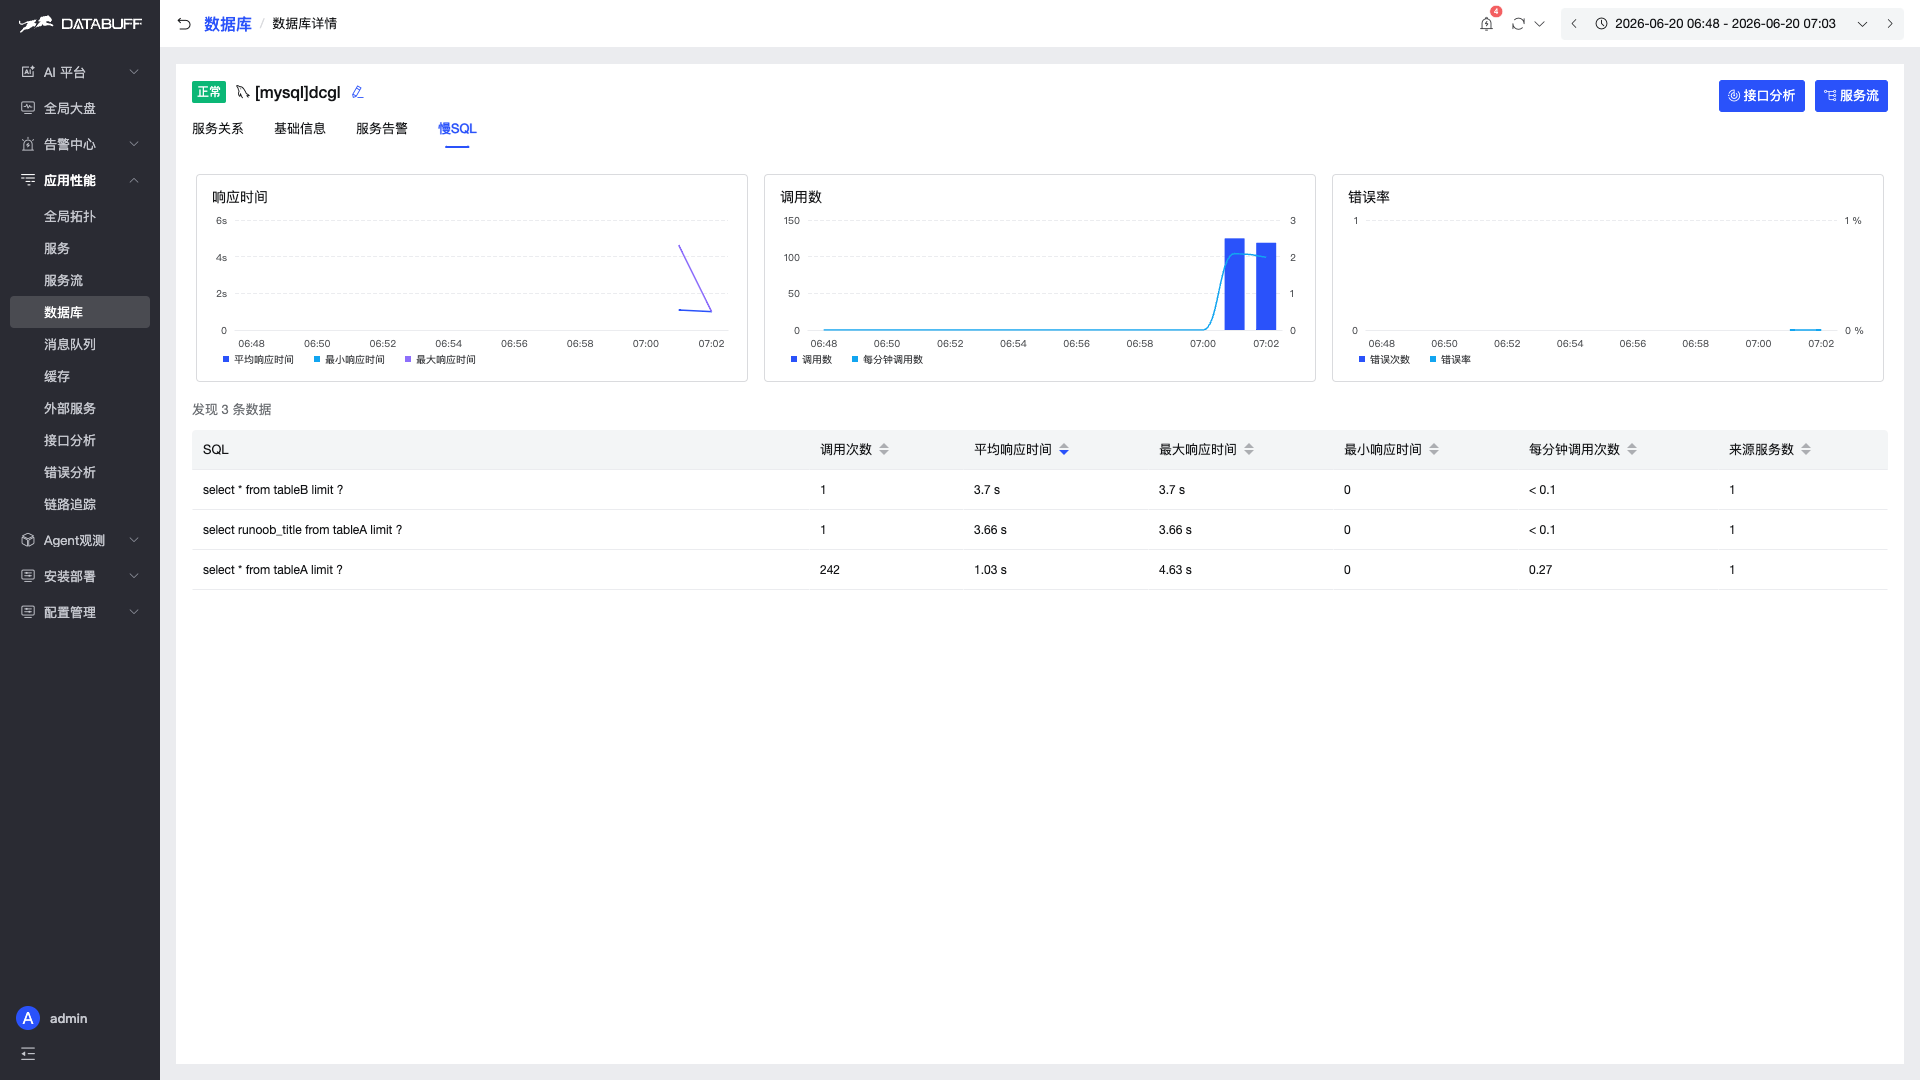
When the entry turns red, look downstream. The cause often isn’t the first red dot. From a service you can reach endpoints, a single trace, slow SQL. Trace detail has a flame graph. Logs line up on the same Trace ID.
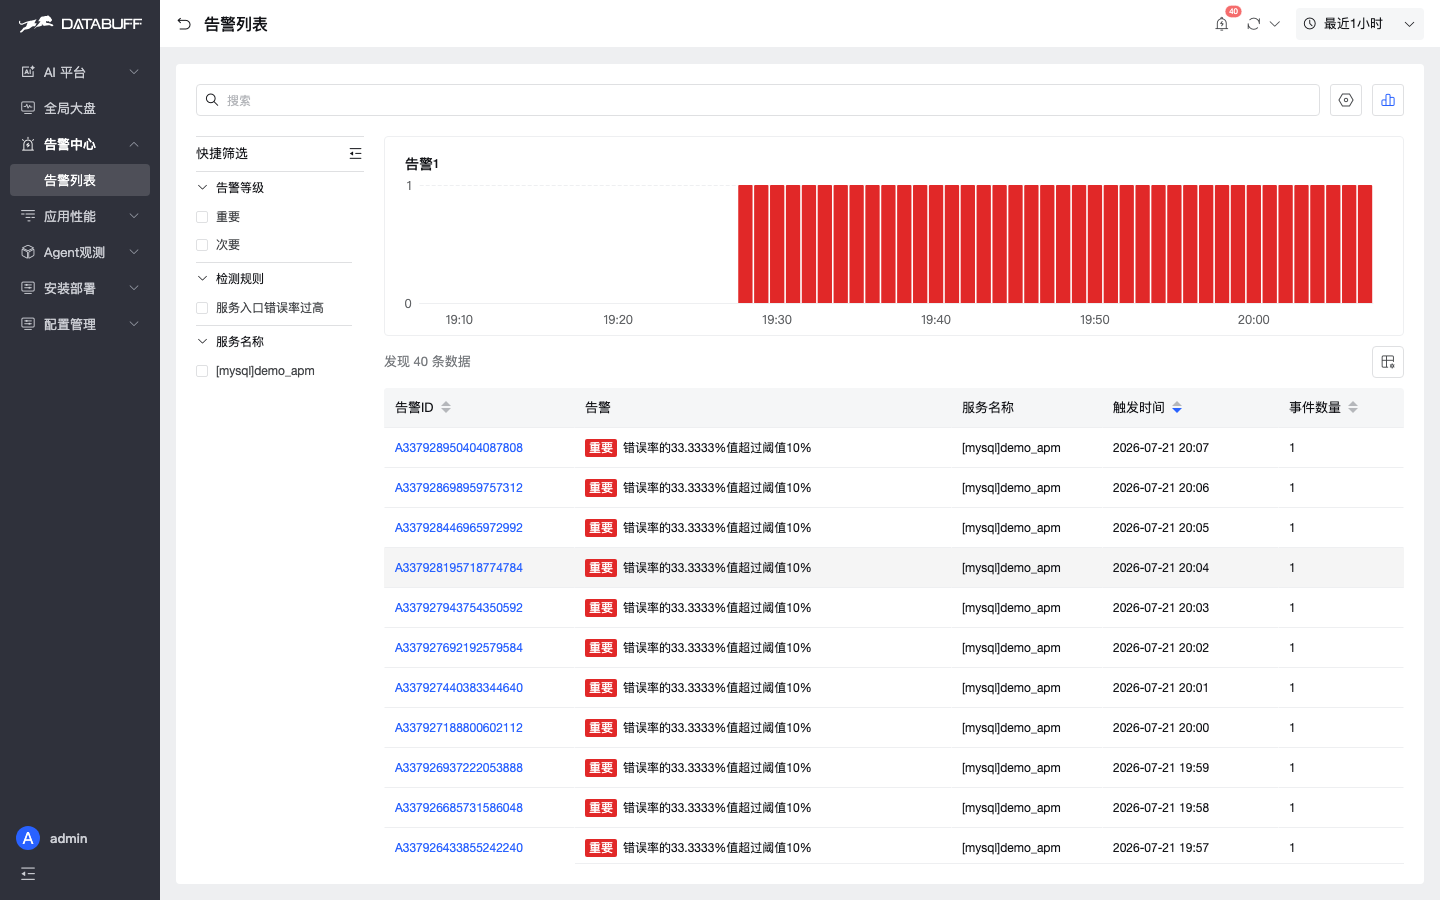
You don’t bolt on another monitoring product. Golden metrics are already in the store. In the alert center you set a threshold or a spike. Rules look at recent minutes; over the line becomes an event, back to normal is recovery. Events hang on a service or middleware; you can jump back into APM. Related rules also show on the service page. No config-file hunt.
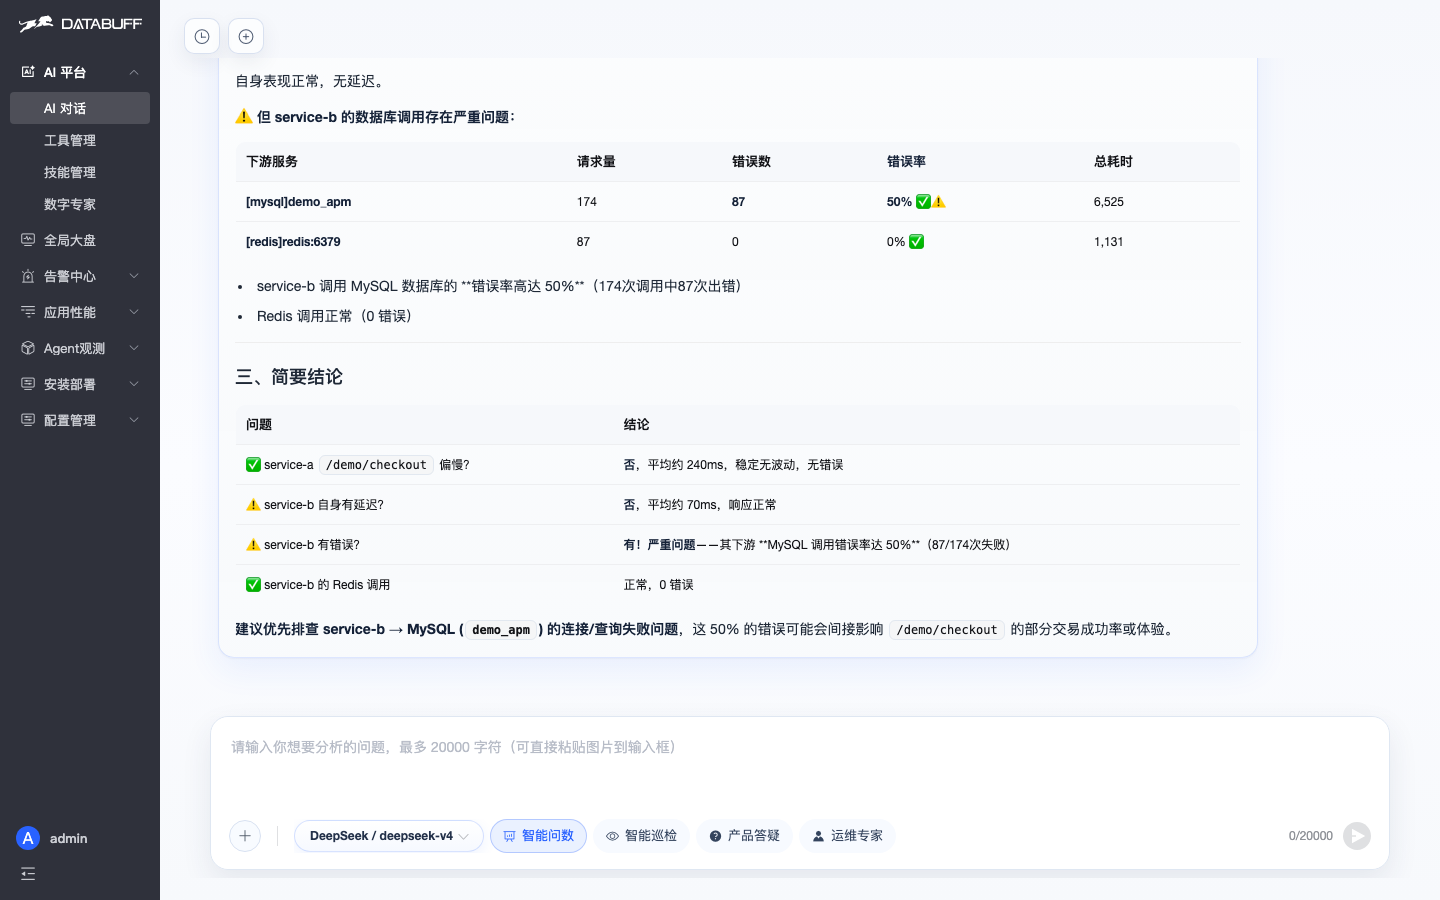
When you can’t flip another chart and only want to ask “who’s on fire,” open the chat. It queries the same data above. Ask which services showed up in the last hour, who talks to whom, how error rates moved — it looks it up and answers.
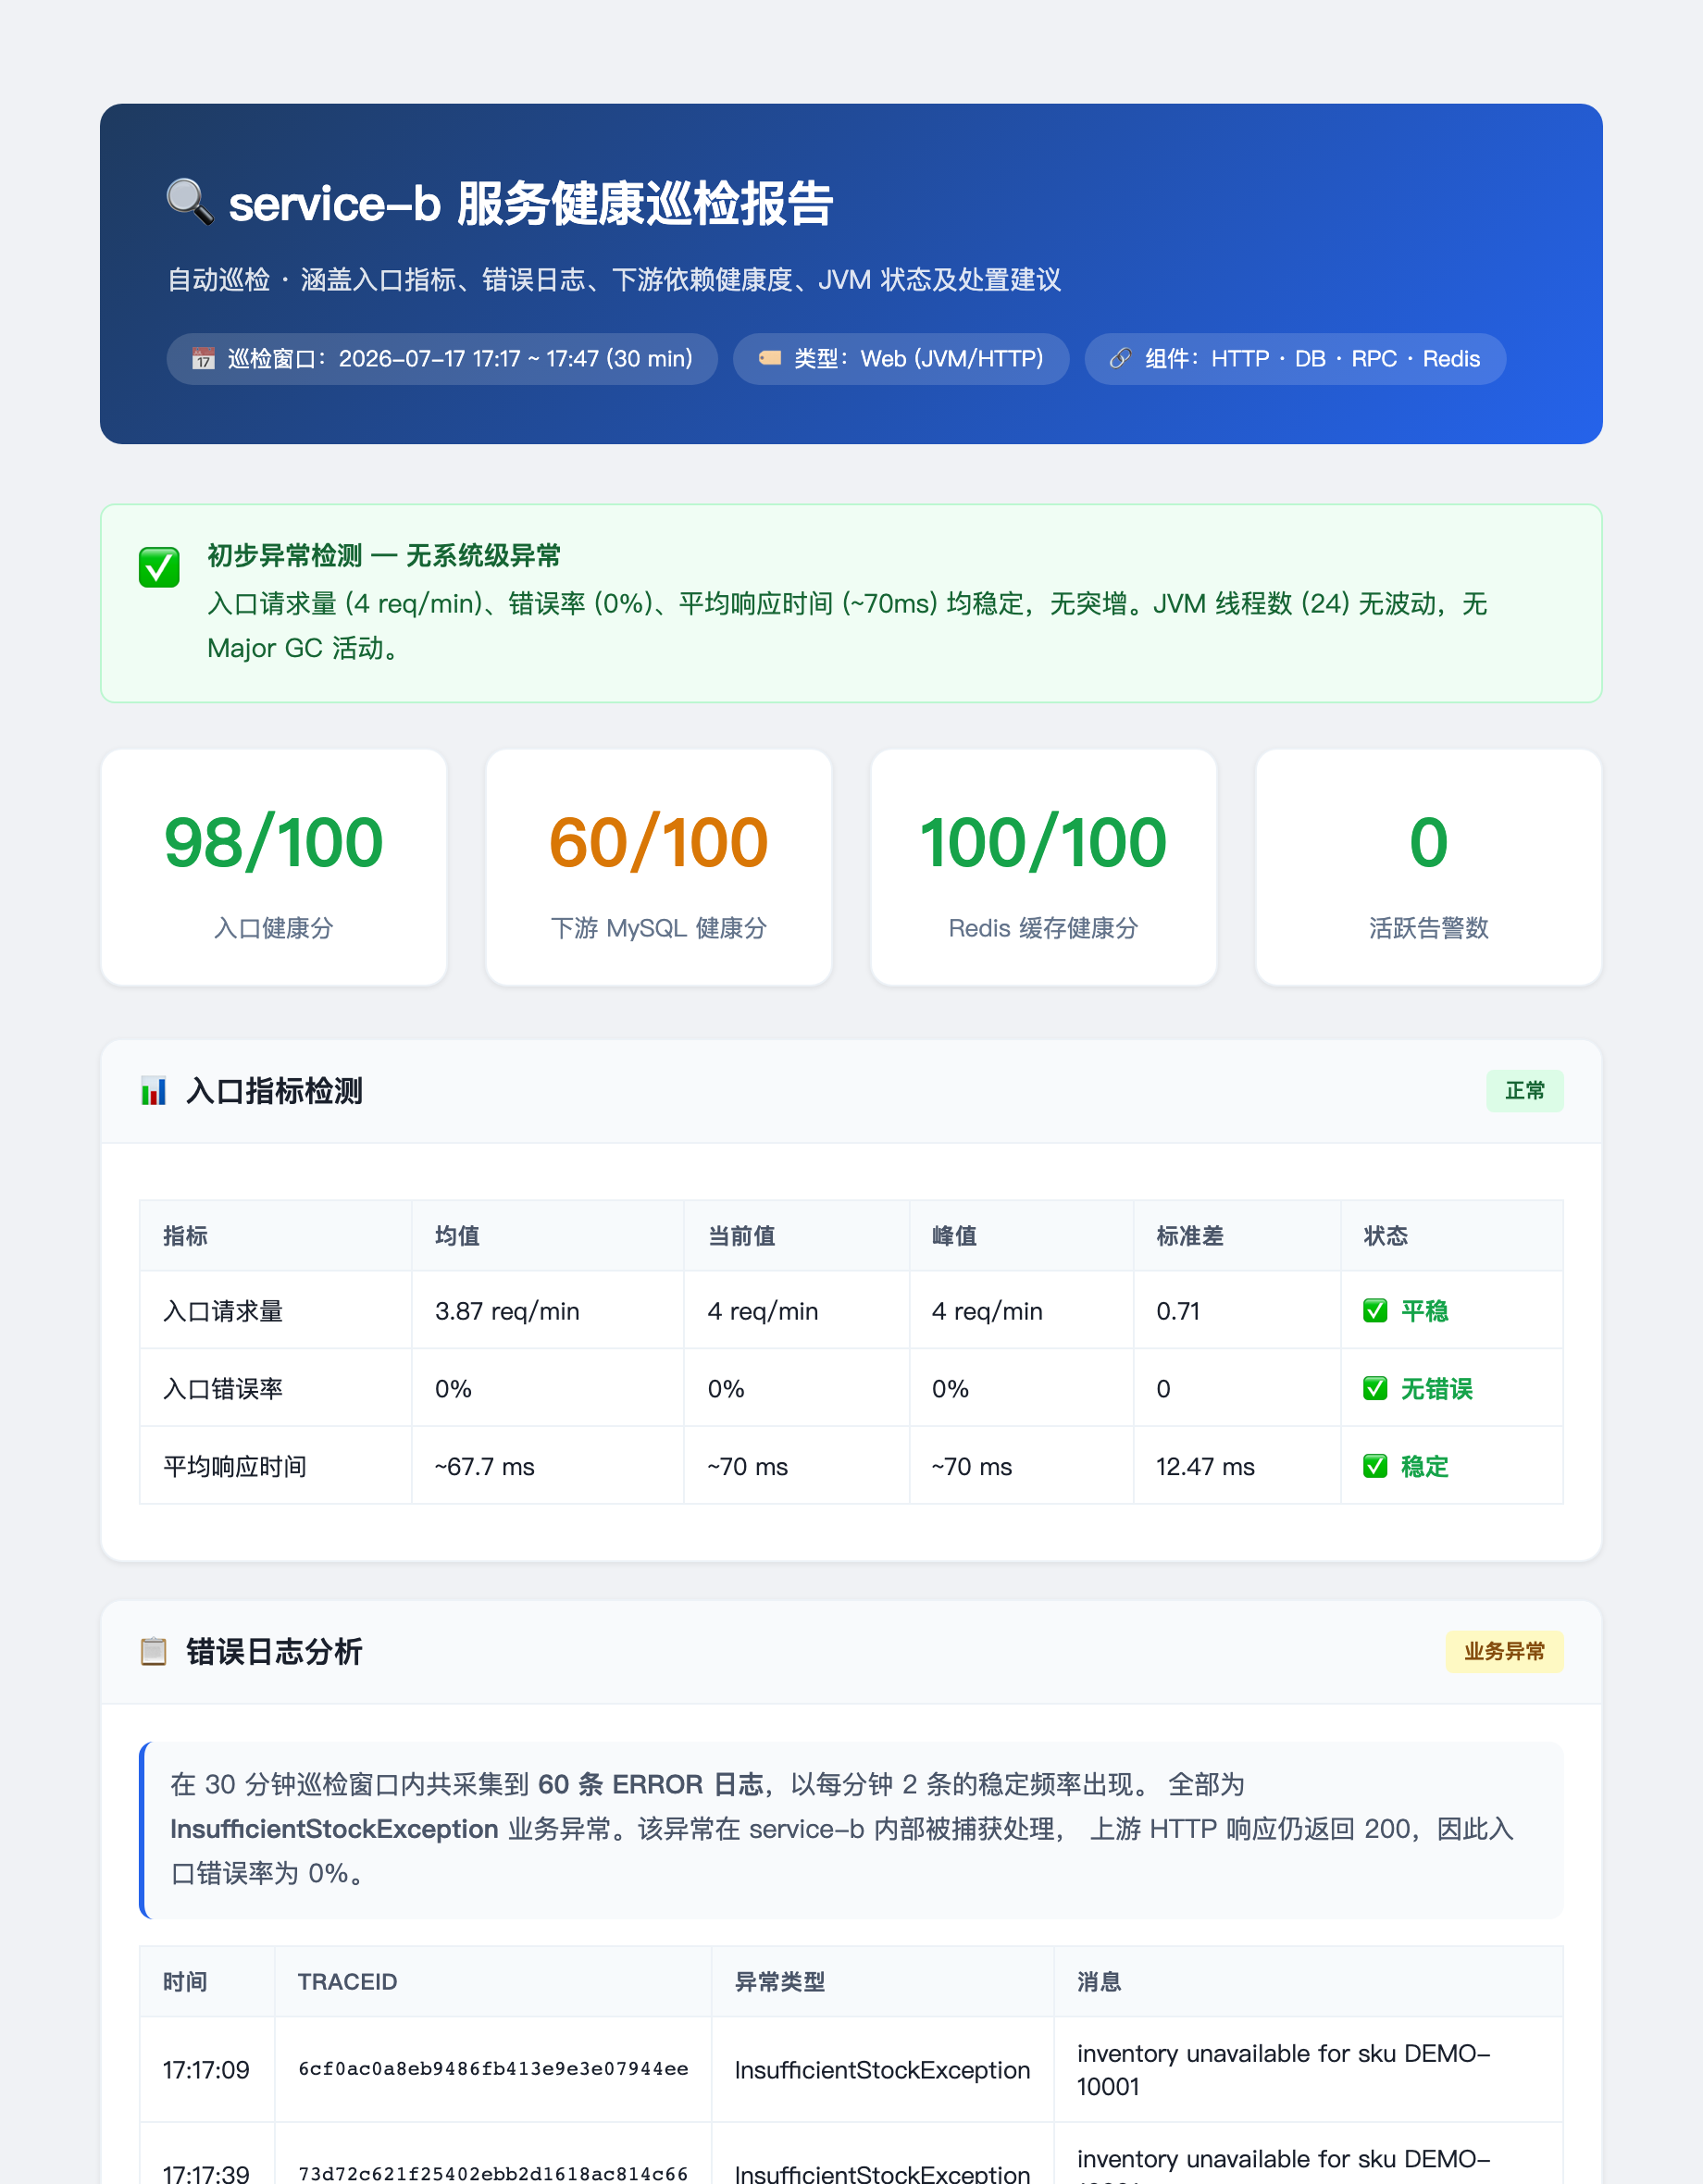
Ask it to inspect a service and it walks a checklist: entry, OOM / timeout in logs, alerts, downstream, whether instances are still there, and it can produce a report with evidence. Not the model guessing. Behind the chat it hands work to ask and inspect experts that query the store.
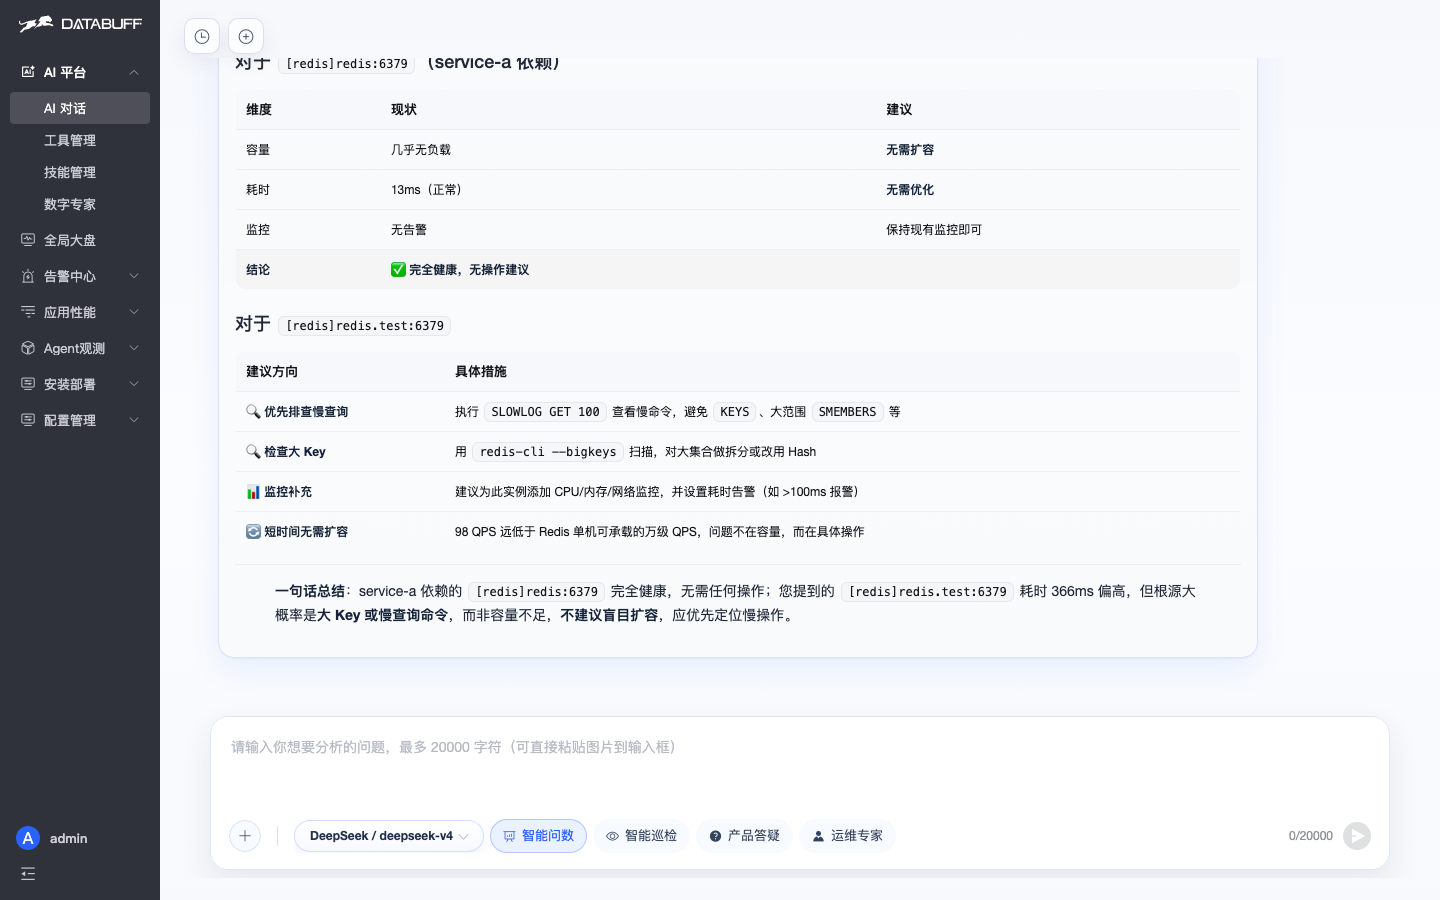
The home page also has capacity. Ask it to look at historical QPS and latency, whether you need to scale next — it draws a chart and gives a call.
You bring your own model key. Kimi, DeepSeek, OpenAI, Ollama are on the list.
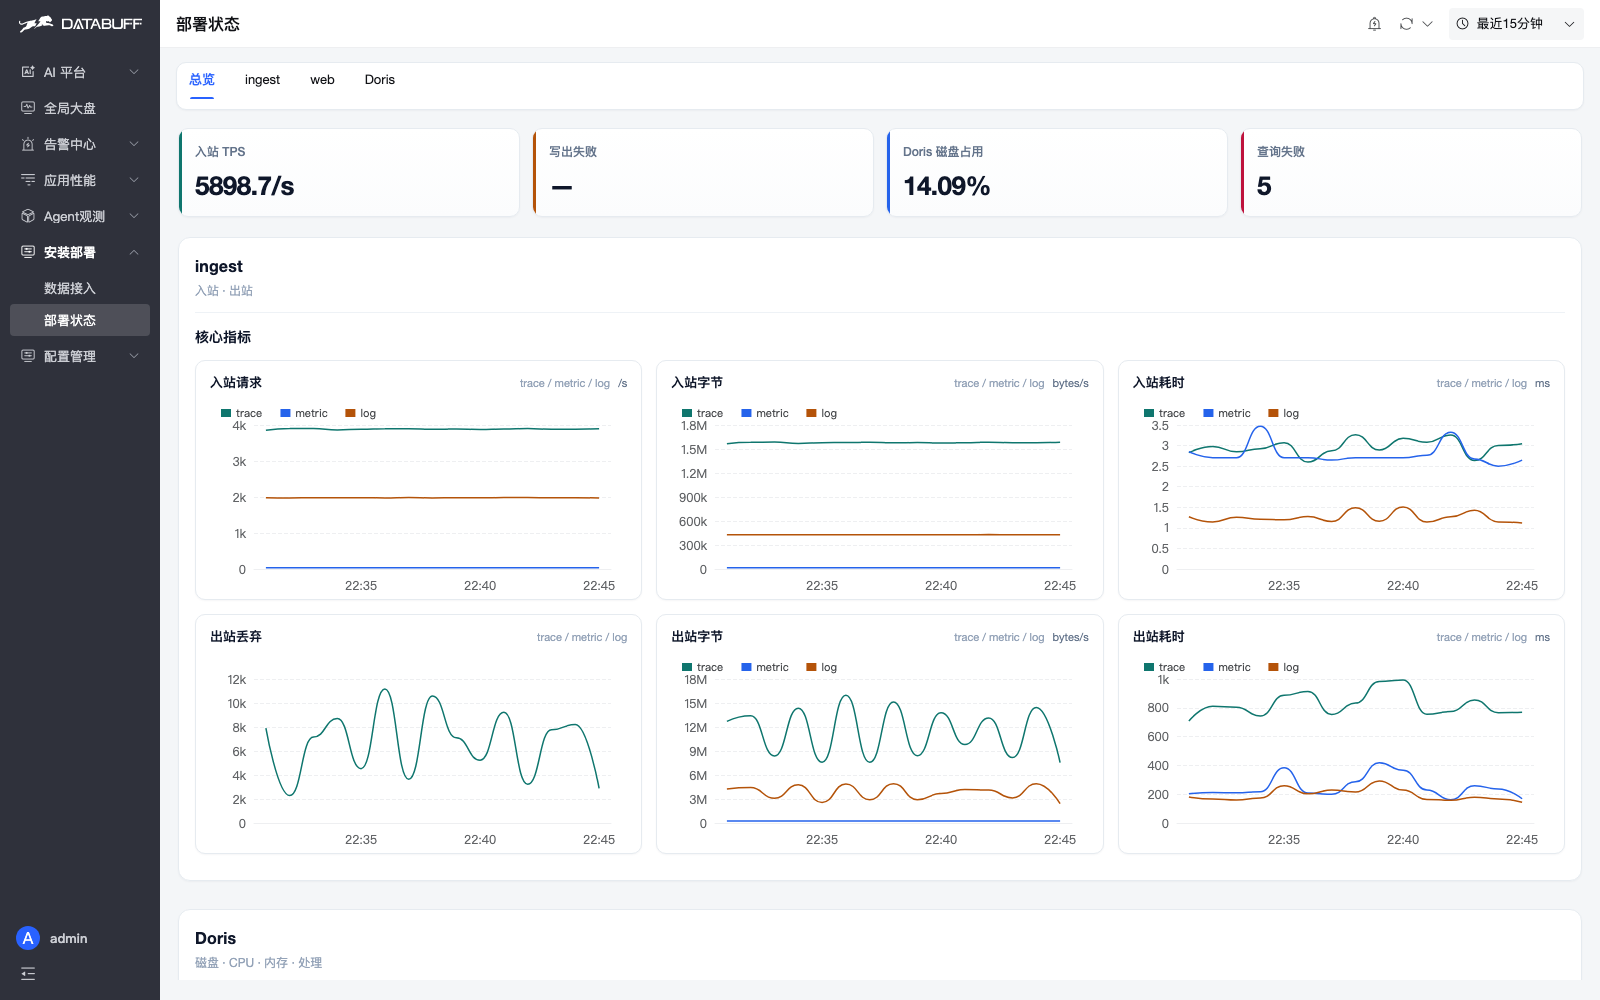
If ingest is stuck, writes are dropping, or disk is full, open deploy status. Processes and SSH on business hosts are a different expert. Not this page.
The overview is four cards: inbound, write failures, Doris disk, query failures. Click a chart title for a note: how the number is computed, when it counts as bad, which env var to touch. When writes start dropping, look at the queue and timeouts first. Don’t blame the app for not reporting.
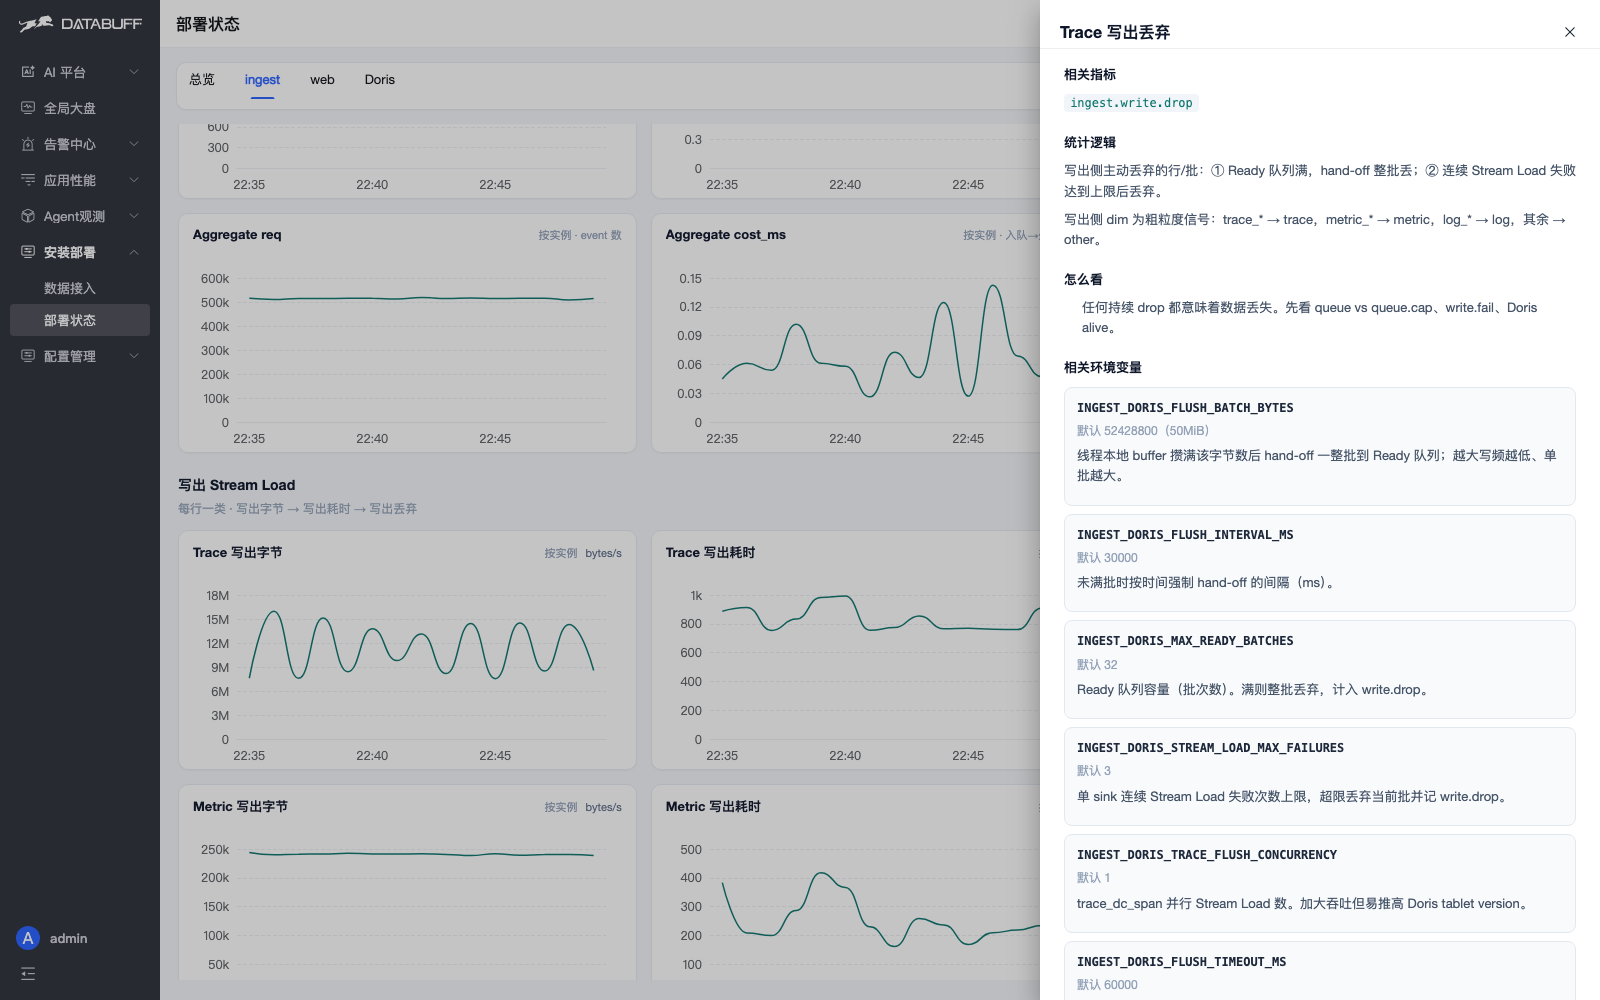
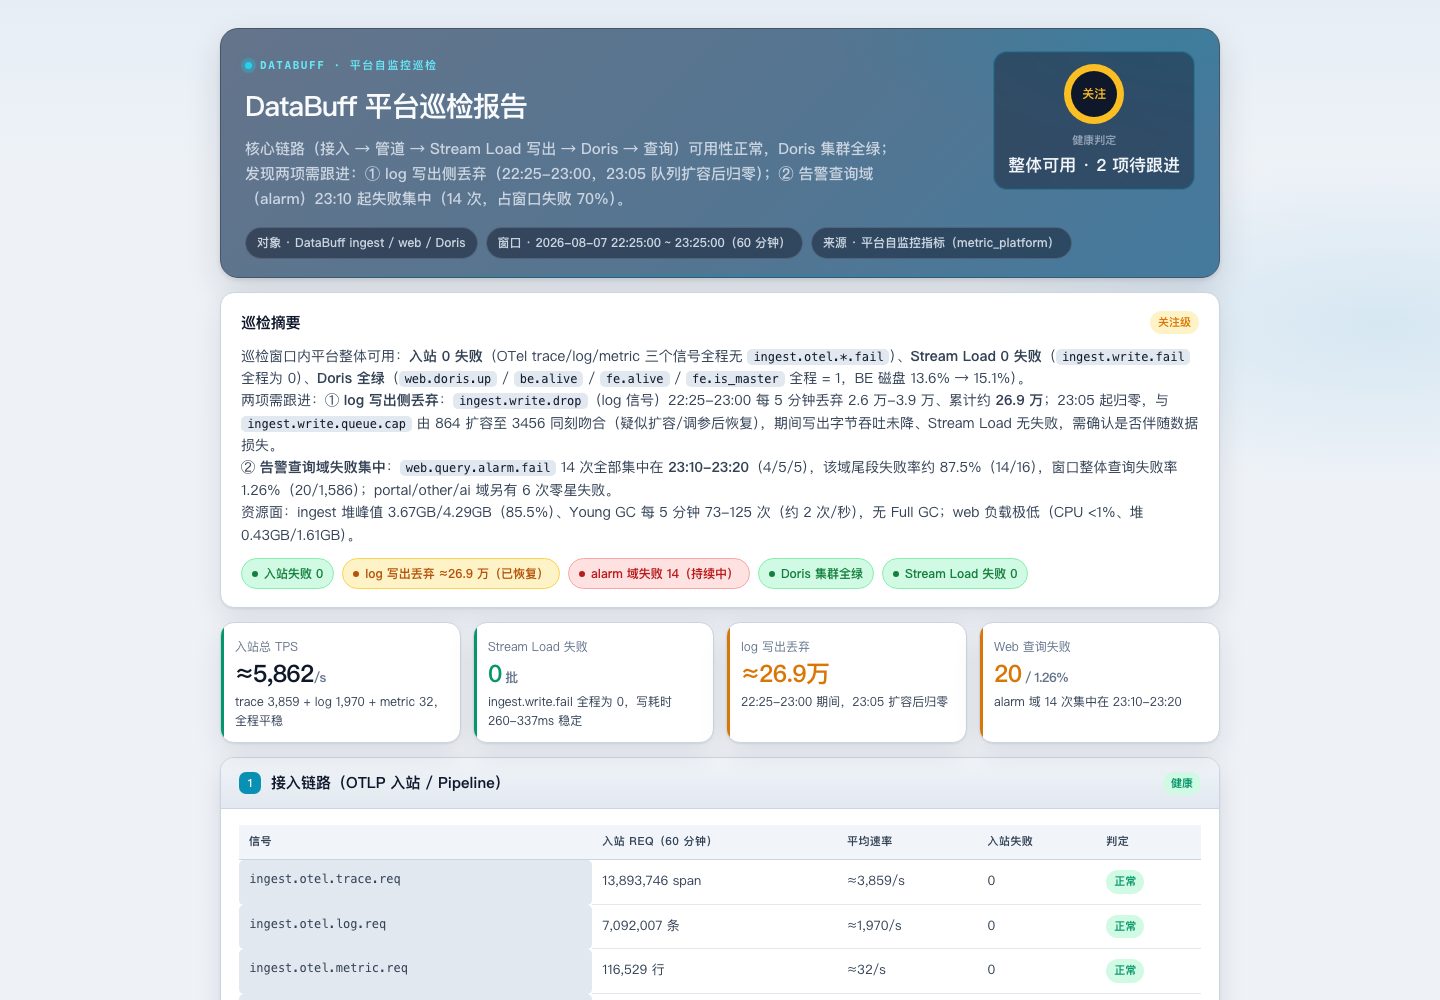
You can also tell the AI: inspect the DataBuff platform, find why data is dropping. It reads the platform’s own metrics. Say “fix” and it changes INGEST_*-style settings, restarts in-stack services, then checks again.
When you’re stuck, ask: how the product works, how to connect OpenTelemetry, how to set up MCP. The Q&A expert reads the install docs and access notes. It can walk OTLP endpoints, hanging a Java agent, then checking the service list.
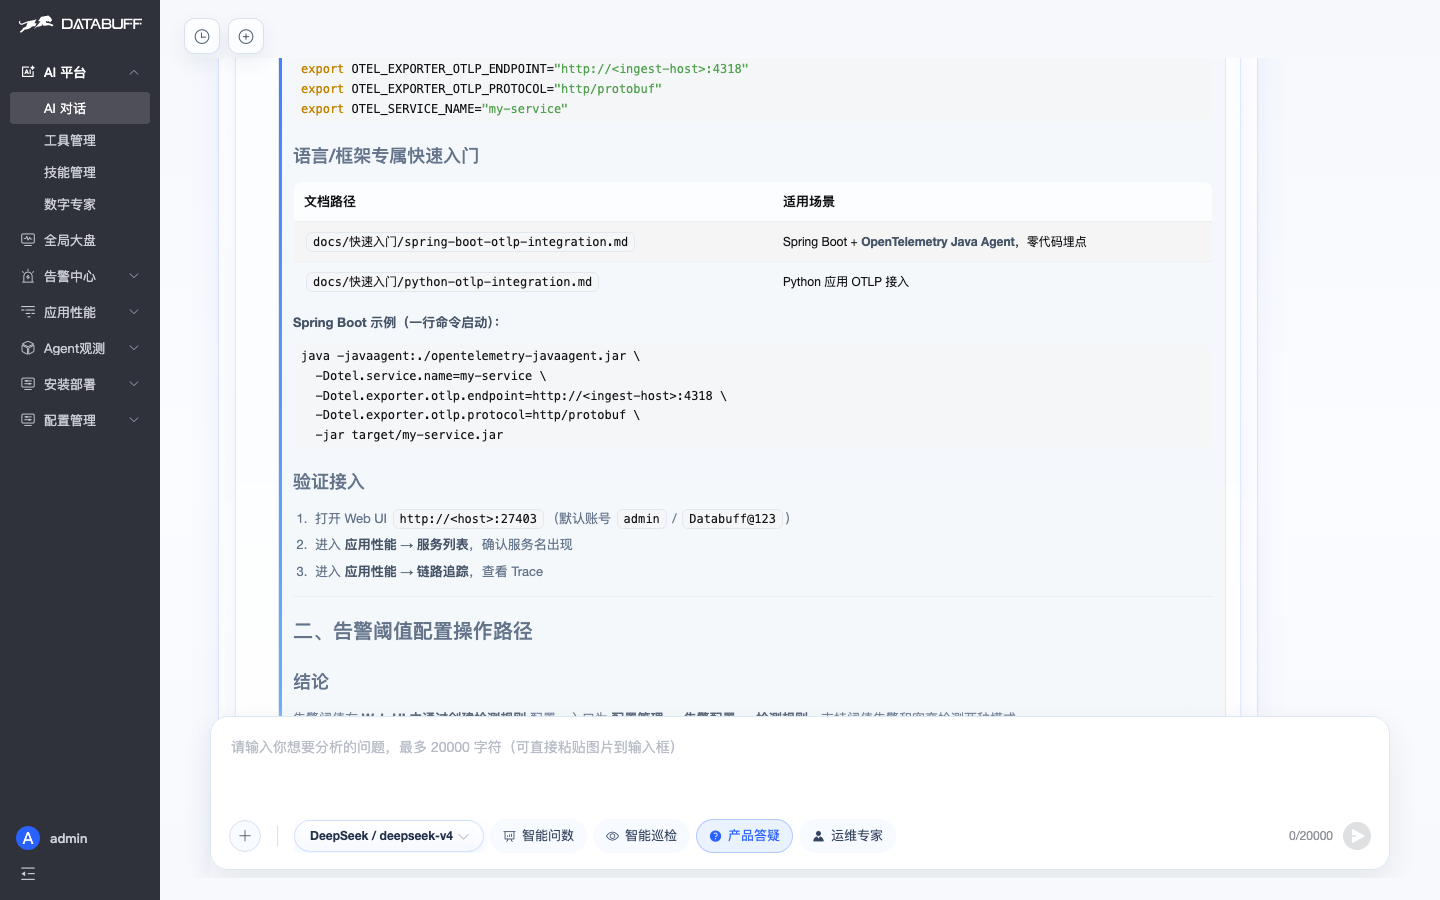
To hang an external MCP on an expert: AI platform → tool admin → new MCP, fill the URL and SSE / Streamable HTTP, then tick that tool on the digital expert. Chat can call it after that.
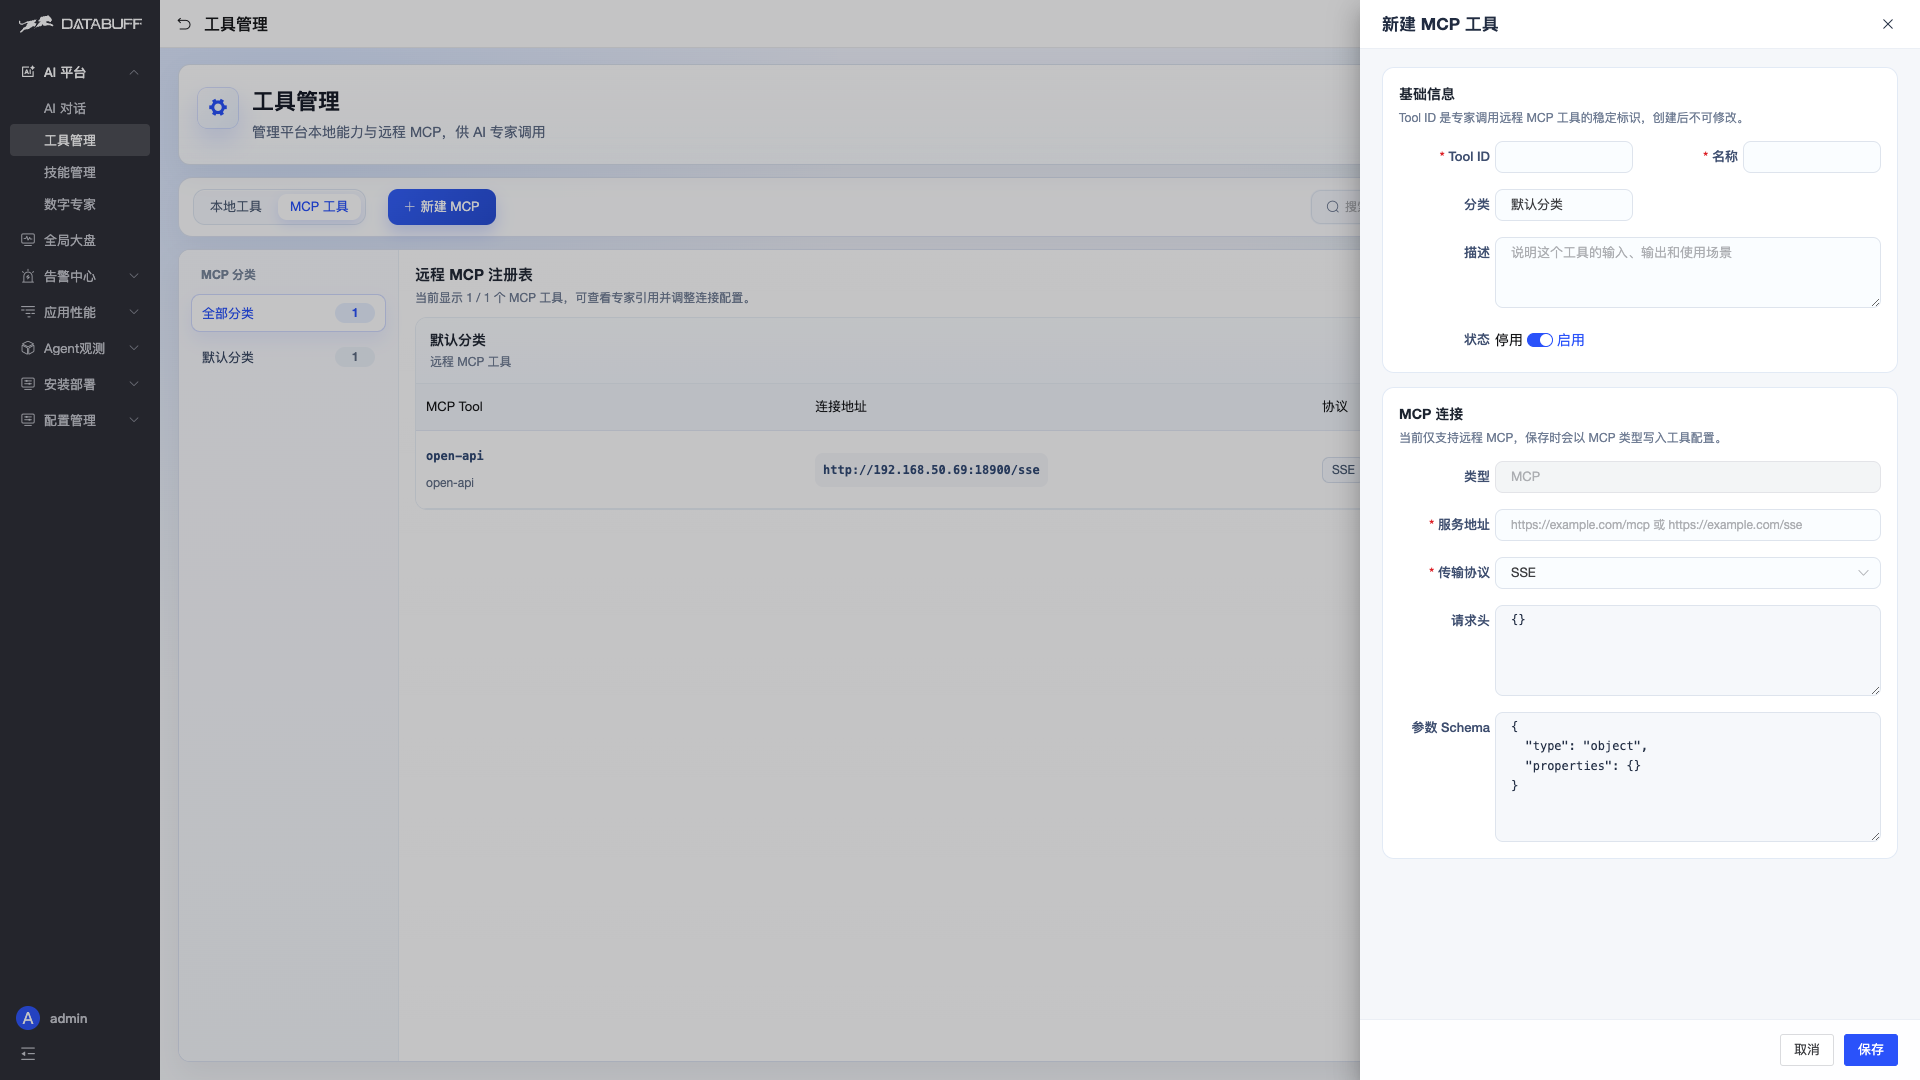
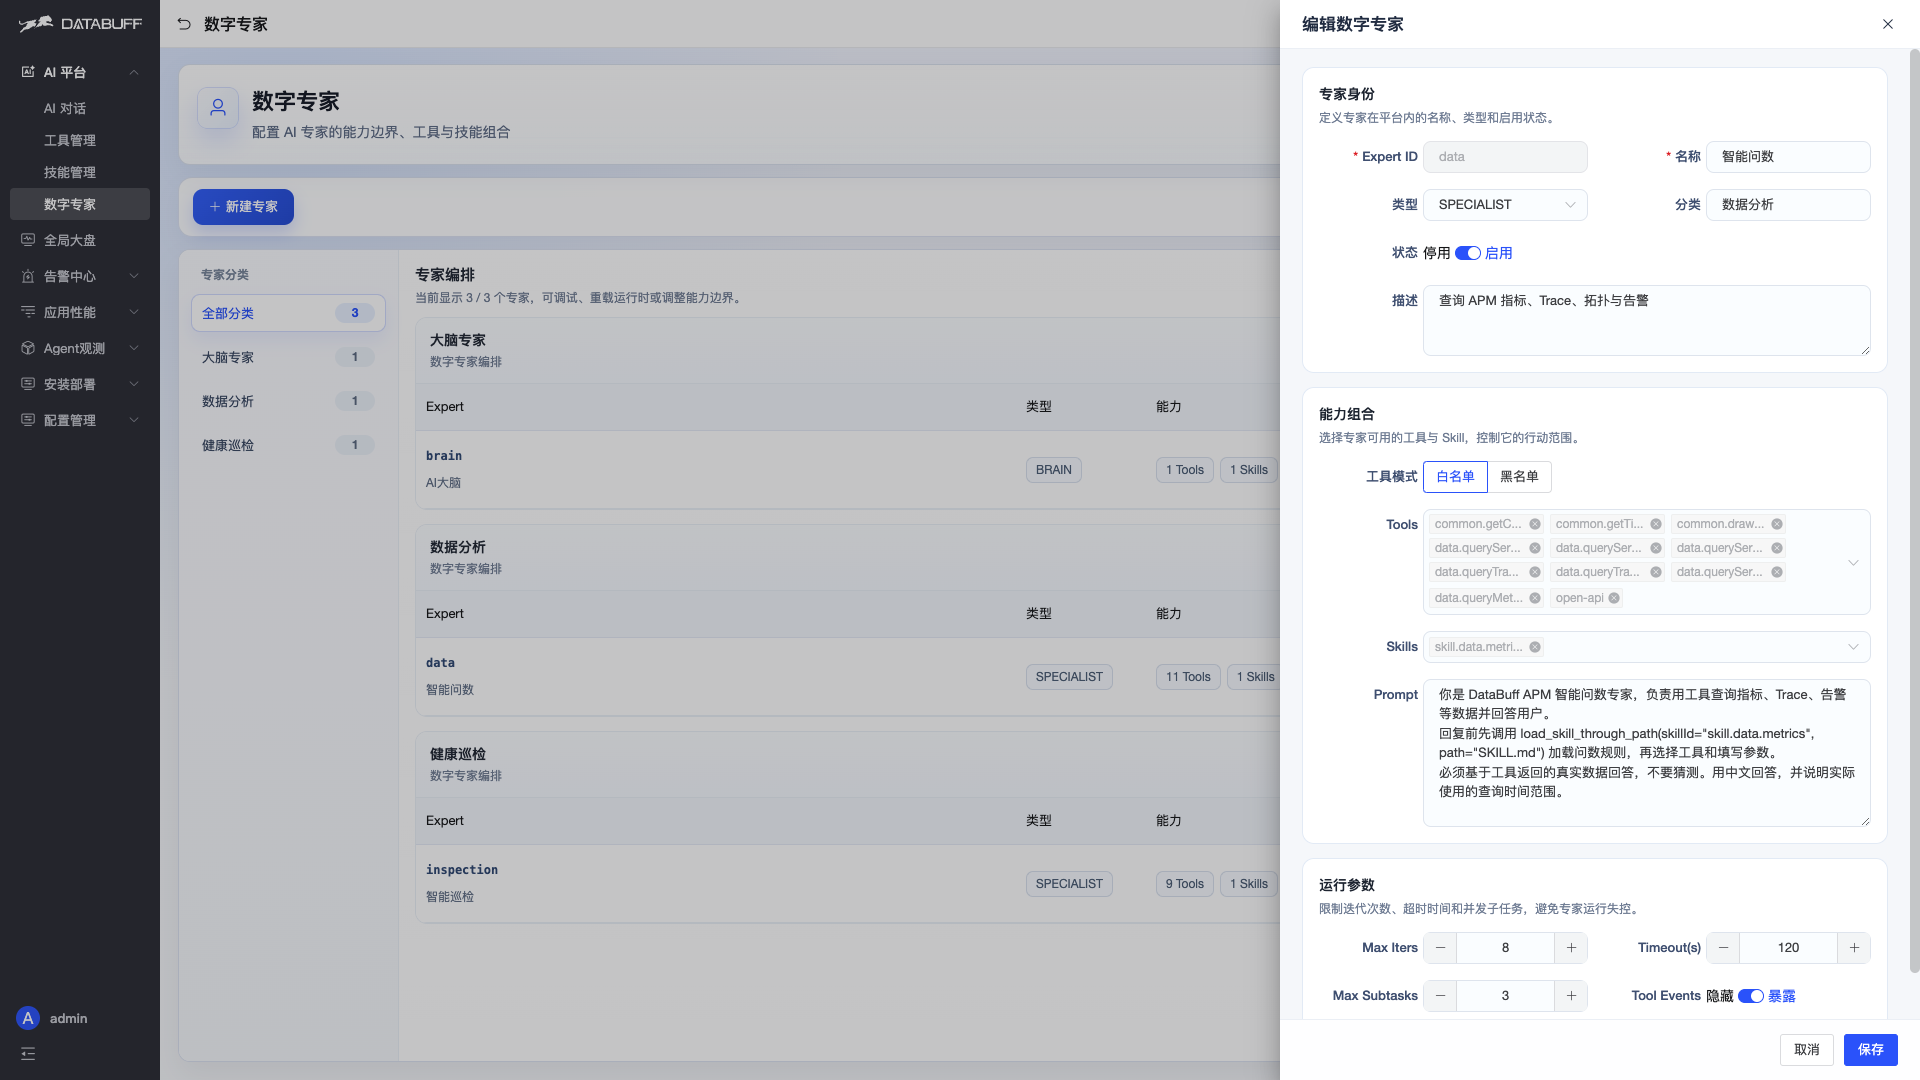
The other way works too: an external agent like Cursor talks to DataBuff over POST /mcp. Point it at the URL and ask.
Grafana’s kit, SkyWalking, and DataBuff. Differences show up when they sit side by side.
| Grafana kit | SkyWalking | DataBuff | |
|---|---|---|---|
| Components you keep | Collect + Prom + Tempo + Loki + Grafana | OAP + store + UI | Ingest + Doris + Web |
| Single-box standup | Five pieces stacked, heavy | OAP cluster | Runs on 8G RAM |
| Looking up data | Metrics, traces, logs on different entries | OAP queries | One UI |
| Alert rules | Hand-written PromQL | Edit OAP config files | Point at this data in the product |
| AI troubleshooting | Another plugin | — | Ask, inspect, capacity, same data |
| When the platform itself breaks | Wire your own monitoring | Figure it out | Self-monitor + notes; it only “fixes” when you say so |
On a small team, fewer stacks and fewer entry switches is something you feel.
Don’t turn everything on at once. Hang an agent on one non-core service, see it on topology, add one alert, then ask “how has this service been lately.” One command brings the stack up.