How to Pick an OpenTelemetry APM Backend in 2026
OpenTelemetry · APM Backend · Open Source Observability · DataBuff
A practical guide to choosing an OpenTelemetry APM backend — evaluation criteria, common open-source patterns, and a hands-on look at a three-component stack.
If you instrument once with OpenTelemetry and still spend nights jumping between Jaeger, Prometheus, and log tabs, the problem is usually not the SDK — it is the backend. This article walks through how to evaluate backends, what the main open source APM patterns look like in 2026, and how to validate a candidate in an afternoon.
1Why the Backend Matters
OpenTelemetry standardizes how applications emit traces, metrics, and logs. Your backend decides where telemetry lands, how you query it under incident pressure, and whether traces and RED metrics stay correlated.
- Apps export OTLP (gRPC 4317 or HTTP 4318).
- OpenTelemetry Collector (optional) receives and forwards telemetry.
- APM backend stores and indexes data for UI and alerts.
◆ ◆ ◆
2Three Common Patterns
Trace-first (Jaeger, Zipkin)
Mature distributed tracing; Jaeger v2 uses the OTel Collector framework. Best when tracing is primary and metrics/logs live elsewhere.
Modular LGTM (Grafana ecosystem)
Loki, Grafana, Tempo, Mimir/Prometheus — maximum flexibility, more services to operate.
All-in-one OSS APM
Unified UI for traces and metrics — e.g. widely referenced open source observability platforms built on OpenTelemetry. Apache SkyWalking remains strong in Java-heavy microservice environments with OTLP receivers alongside native agents.
◆ ◆ ◆
3Evaluation Checklist
| Dimension | What to ask |
|---|---|
| OTLP-native ingest | Native OTLP without proprietary agents? |
| Correlation | From slow service to spans in one UI? |
| Ops footprint | How many stateful components in prod? |
| Storage | Cost and ops at your trace volume? |
| On-call UX | Service map, RED, trace search at 3 a.m.? |
| Exit strategy | Instrumentation stays portable via OTel? |
◆ ◆ ◆
4Example: Three-Component OpenTelemetry APM
DataBuff illustrates a compact opentelemetry apm backend: listed on the OpenTelemetry Vendors page as Pure OSS with Native OTLP Yes.
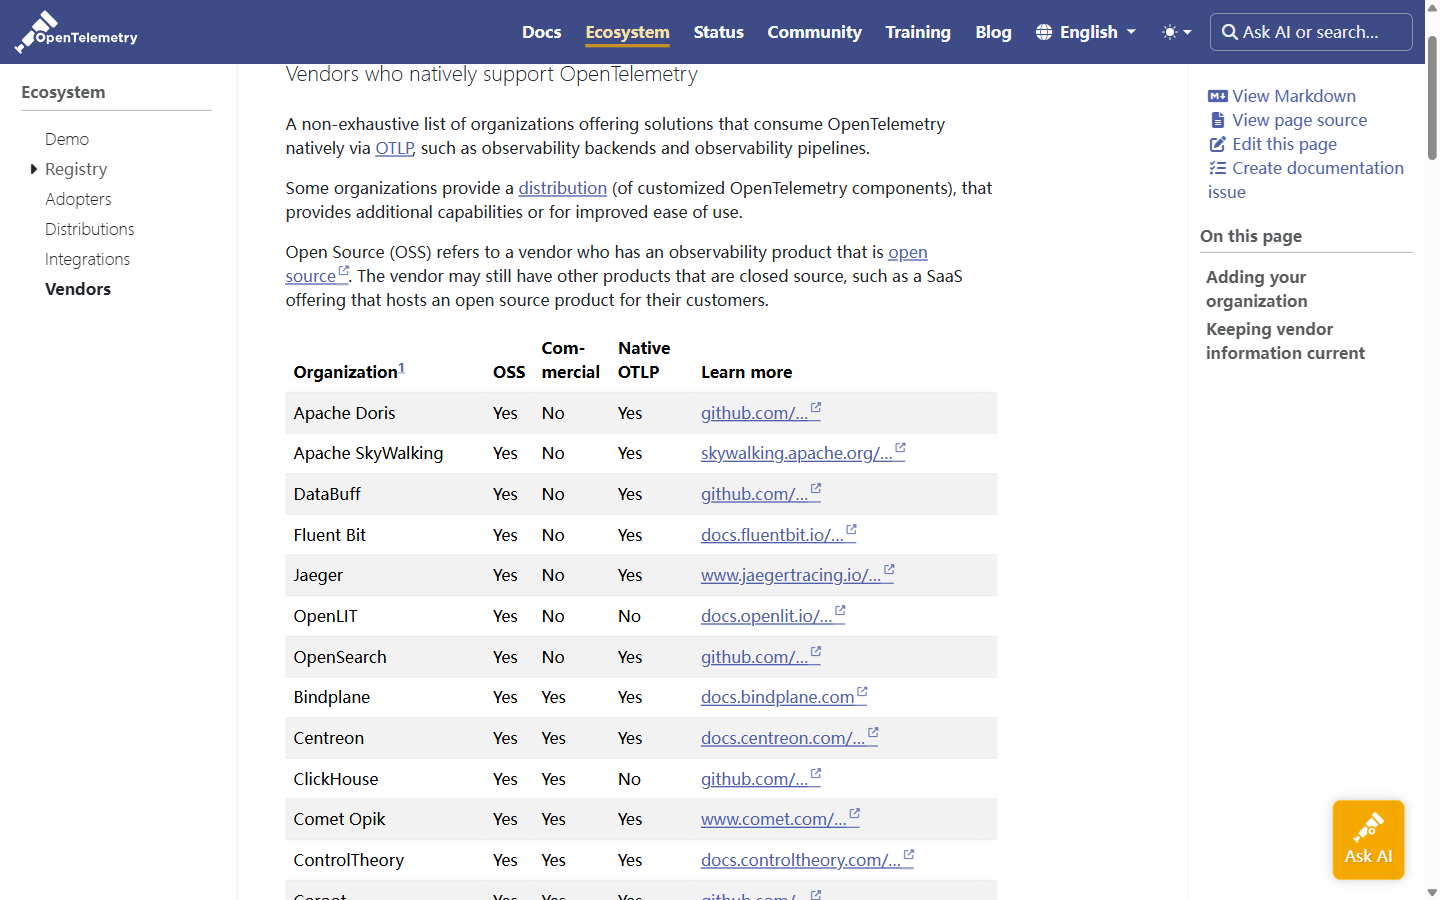
Figure 1 · Vendors entry (Native OTLP)
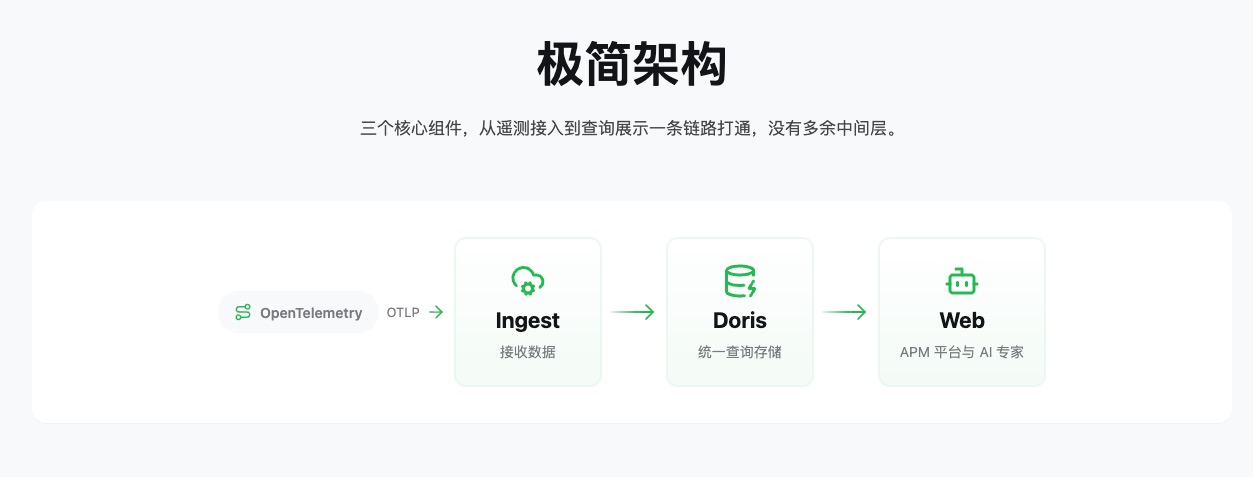
Figure 2 · Ingest → Doris → Web
◆ ◆ ◆
5UI Expectations
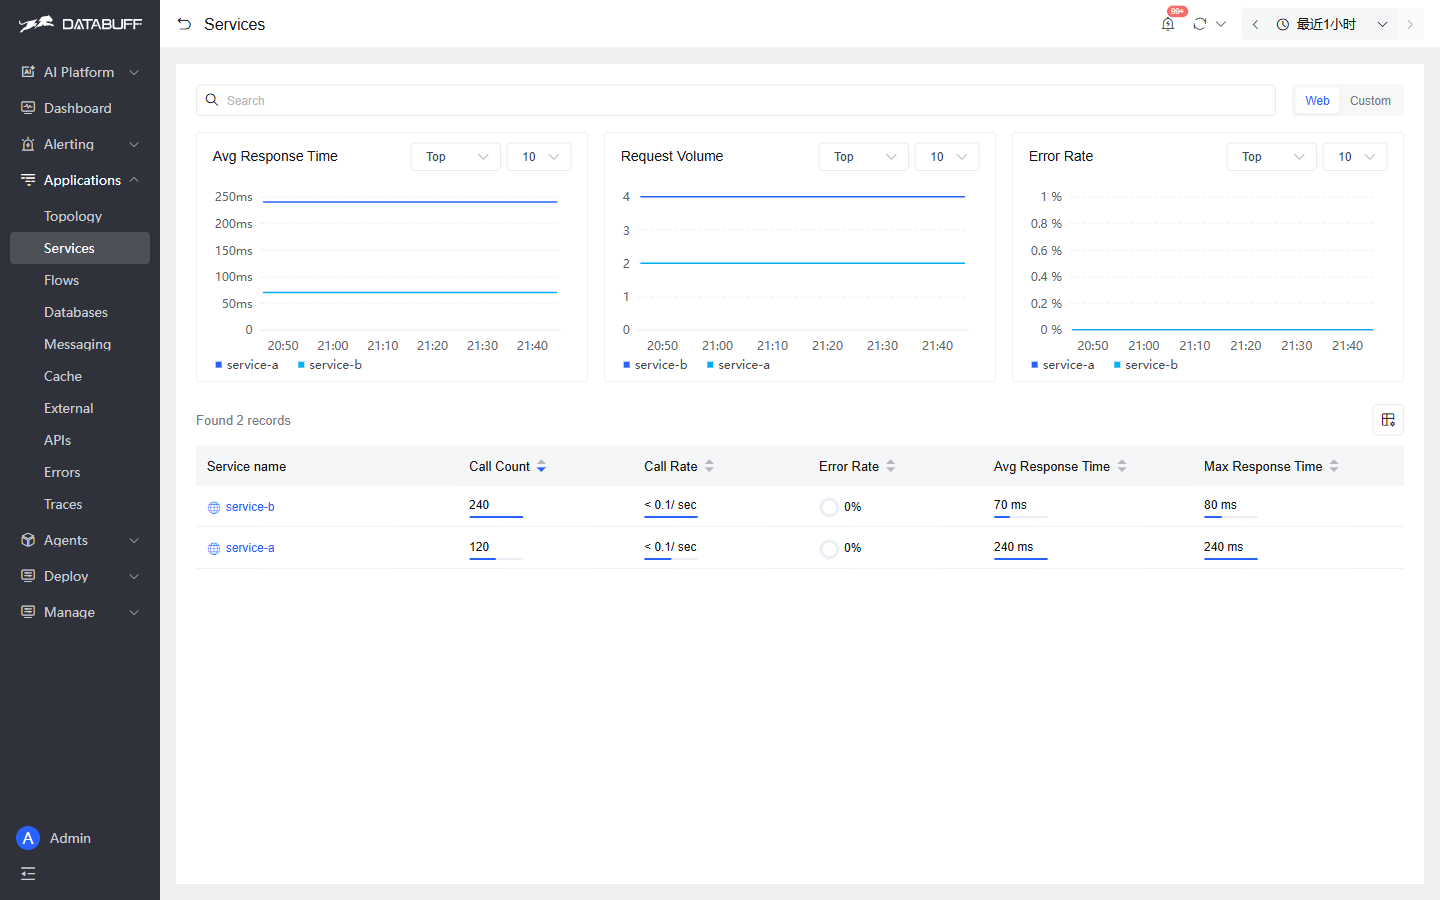
Figure 3 · Service RED overview
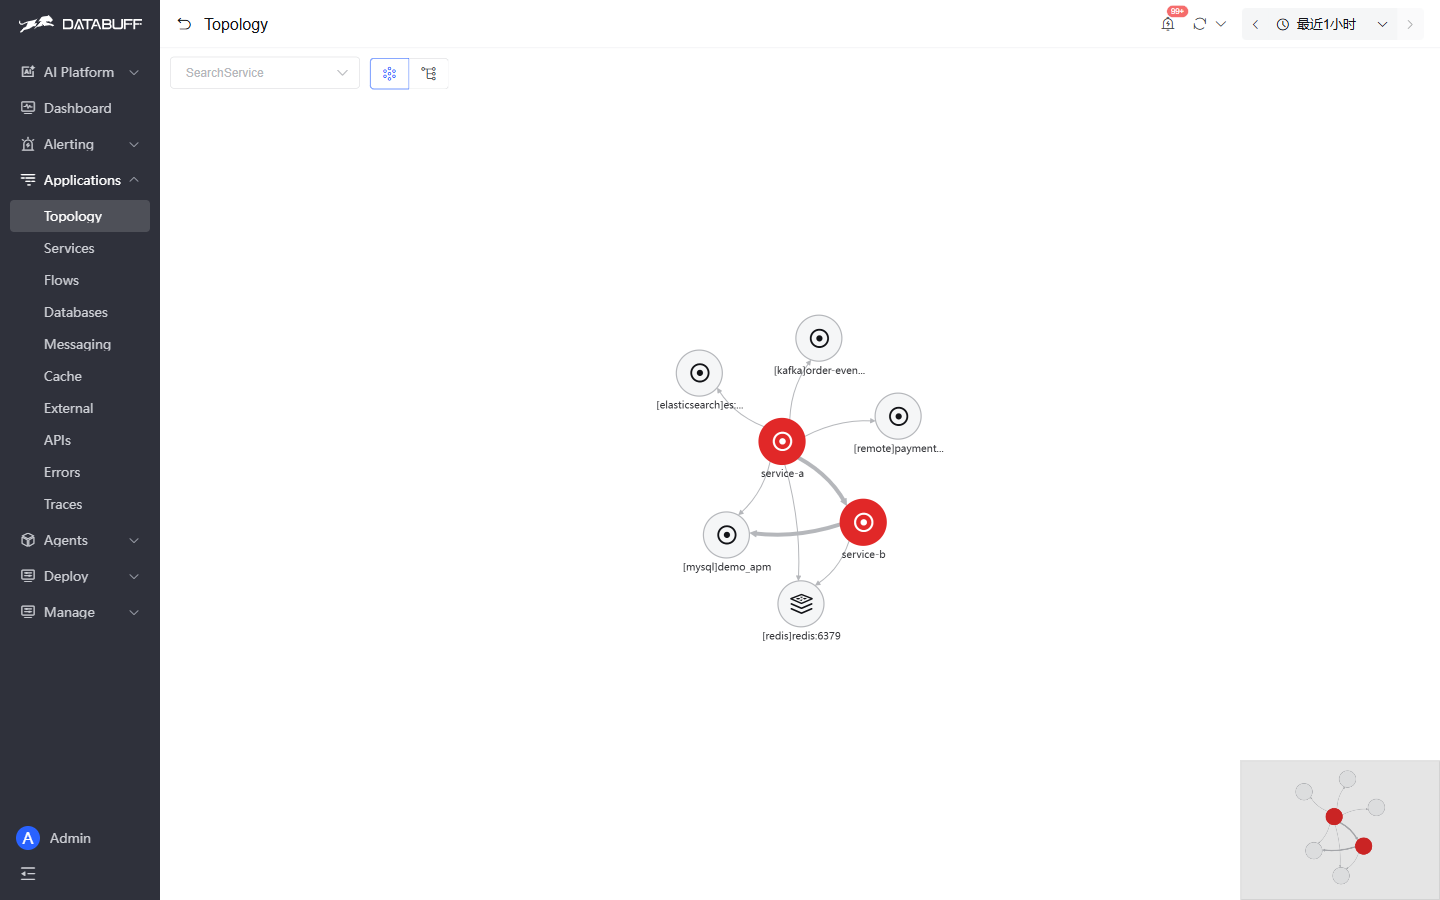
Figure 4 · Topology from traces
◆ ◆ ◆
6AI-Assisted Triage
Prefer AI that queries the same trace store — not a disconnected chat window.
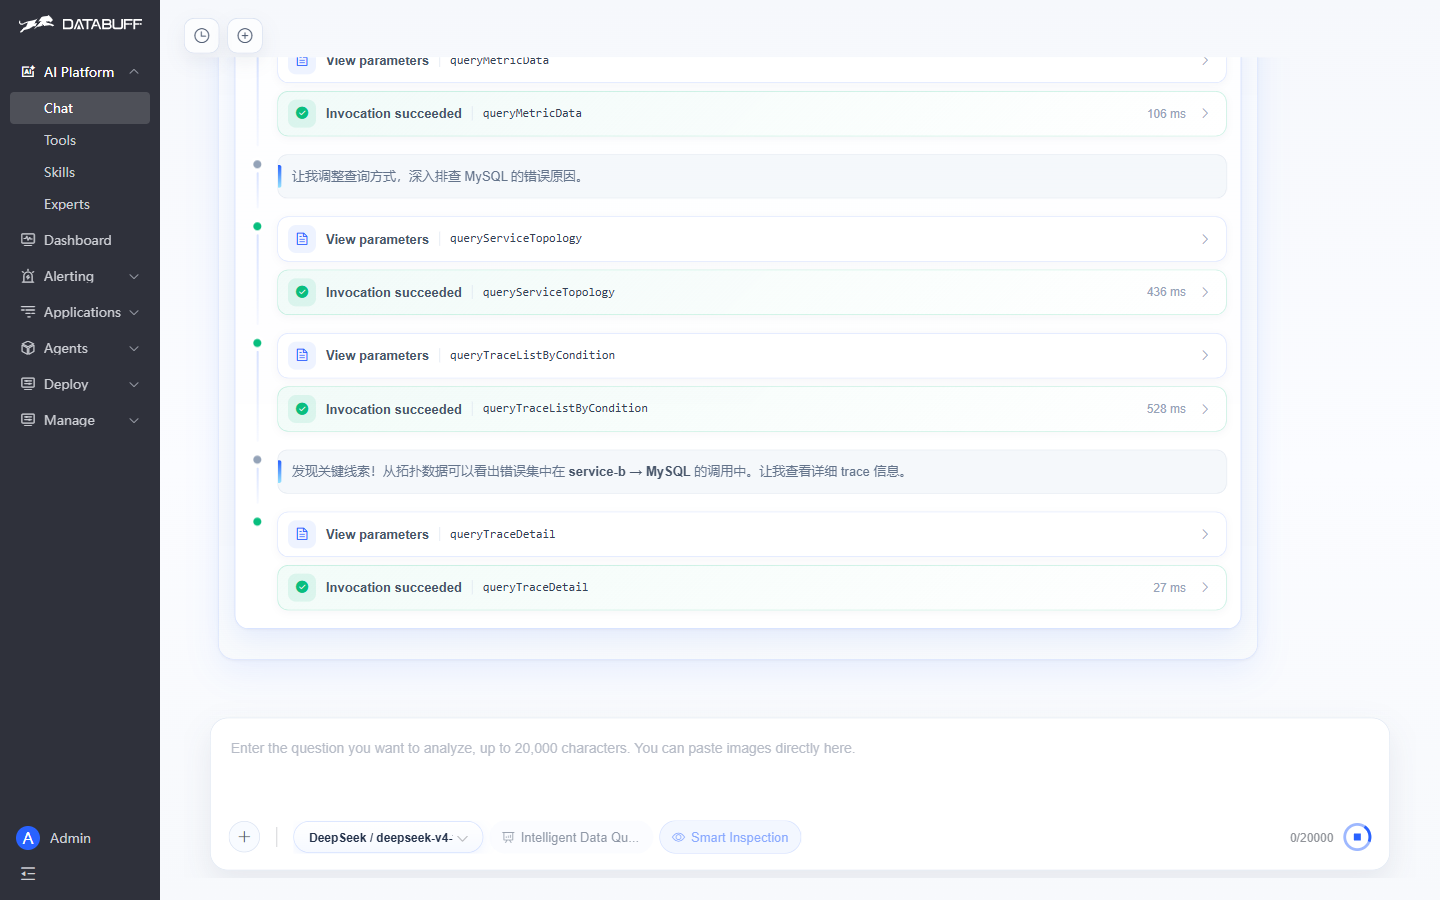
Figure 5 · Alert diagnosis on live OTel data (topology red → root cause + remediation)
◆ ◆ ◆
7Quick POC Script
- Point demo app at OTLP 4318 or 4317.
- Generate traffic for five minutes.
- Confirm services, topology, and trace search.
- Record ports and resource use on your target VM.
Example HTTP endpoint: http://YOUR_HOST:4318/v1/traces. Web UI typically on port 27403 after install per project docs.
◆ ◆ ◆
8Takeaways
Pick on OTLP fidelity, correlated troubleshooting, and operable storage. Open source apm spans trace-only, LGTM, and unified platforms. Validate with a repeatable POC before standardizing retention. For Native OTLP OSS with a small footprint and AI on live spans, evaluate DataBuff alongside SigNoz, SkyWalking, and LGTM.
◆ ◆ ◆
9References
[1] https://opentelemetry.io/docs/
[2] https://opentelemetry.io/ecosystem/vendors/
[3] https://github.com/databufflabs/databuff
[4] https://github.com/jaegertracing/jaeger
[5] https://github.com/signoz/signoz
◆ ◆ ◆