Open Source APM Compared: Pinpoint vs DataBuff — Full Capability Review
Pinpoint · DataBuff · AI Native APM · Side-by-Side Demo · 2026
Many teams treat Pinpoint as a Java call-stack tool, but it spans full distributed tracing from USER entry to downstream dependencies: ServerMap for topology, Scatter to box slow requests, CallStack down to method-level Spans. This article focuses on AI vs APM depth gaps, then demos DataBuff: natural-language Q&A → smart inspection → root-cause diagnosis.
§2 AI Capability Comparison
In a side-by-side environment (Pinpoint 3.1.0 / DataBuff v0.1.4), Pinpoint uses a proprietary Java Agent + Thrift ingest; DataBuff accepts OTLP 4318 alongside SkyWalking gRPC. The AI platform is the largest gap: Pinpoint has no equivalent AI UI; DataBuff feeds ingested Traces and metrics in Doris directly into AI context.
2.1 Seven AI Capabilities Compared
| Capability | Pinpoint 3.1.0 | DataBuff v0.1.4 |
|---|---|---|
| ① See clearly · NL query the system | None | Yes · NL queries for services/topology/anomaly trends (Chinese UI) |
| ② Squad sync · Multi-agent collaboration | None | Yes · Parallel expert forensics, orchestrated tasks |
| ③ Inspect · Service inspection + reports | None | Yes · One-line inspection with evidence and recommendations |
| ④ Diagnose · Bottleneck / root-cause forensics | None | Yes · Evidence chains from Trace/metrics/topology |
| ⑤ Remediate · Ops expert actions | None | Yes · Policy-gated fixes with human approval |
| ⑥ Predict · Capacity / trends | None | Yes · Capacity and trend analysis |
| ⑦ Answer · Q&A expert | None | Yes · Retrieves product docs for deploy/ingest questions |
| External · MCP / Skill | None | Yes · External MCP/Skill and custom digital experts |
2.2 APM Depth: Pinpoint Strengths vs DataBuff Gaps Filled
Pinpoint is clearly stronger at:
- Java method-level Call Tree / Flame Graph— bytecode depth proven in CallStack
- ServerMap + Scatter + Apdex in one view— topology and scatter on one page, box-select into transactions
- Proprietary agent ecosystem— high migration cost for teams deep in Pinpoint plugins
DataBuff leads in multi-language OTel, service/instance/API call analysis and service flow, middleware pages, log↔Trace linking, platform self-monitoring, and AI. Key rows from the comparison table:
| Capability | Pinpoint | DataBuff |
|---|---|---|
| Global topology | Server Map | Global topology + health color codes |
| Service-level call analysis (upstream/downstream + Trace) | No dedicated page | Yes |
| Service flow / response contribution | None | Yes |
| Trace Span linked logs | None | Yes |
| Middleware pages (DB/cache/MQ) | May appear in topology, no dedicated page | Dedicated pages |
| Call Tree method-level depth | Strong | Span waterfall |
| Ingest protocol | Proprietary Java Agent | OTLP + SkyWalking gRPC |
| Trace list / search | Scatter box-select | Charts + multi-dimensional filters |
| Alerting productization | Administration config | Alert center + smart alerts |
2.3 Scenario Quick Reference
| Scenario | Better fit | Notes |
|---|---|---|
| Pure Java, need method-level Call Tree | Pinpoint | Bytecode stack depth |
| ServerMap + Scatter unified troubleshooting | Pinpoint | Topology and scatter on one page |
| Need all seven AI capabilities | DataBuff | Pinpoint has no equivalent AI platform |
| Multi-language / existing OTel agents | DataBuff | Native OTLP 4317/4318 |
| Slow SQL / logs linked to Trace | DataBuff | Middleware pages + Log→Trace |
| Java call chains only, no AI needed | Either works | No need to migrate for branding alone |
§3 DataBuff AI Capability Demos
All three use cases below were run in the DataBuff public Demo AI chat (2026-08-26). Screenshots are from live sessions — capabilities Pinpoint lacks: one-line Q&A / inspection / diagnosis.
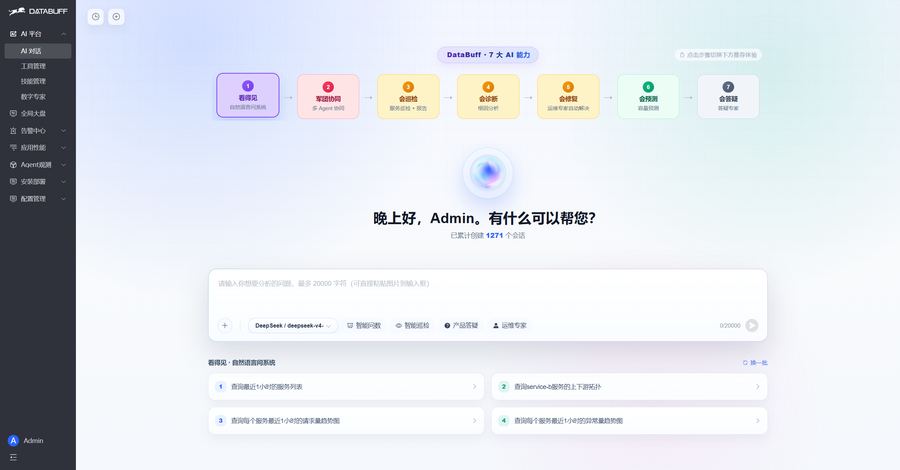
Fig 3-0 · AI chat home: seven AI capability flow and quick Q&A/inspection shortcuts
Use case 1: Natural-language Q&A (See clearly)
In Pinpoint this takes ServerMap → per-app stats → Scatter. AI compresses intent parsing + metric queries + tabular summary into one conversation.
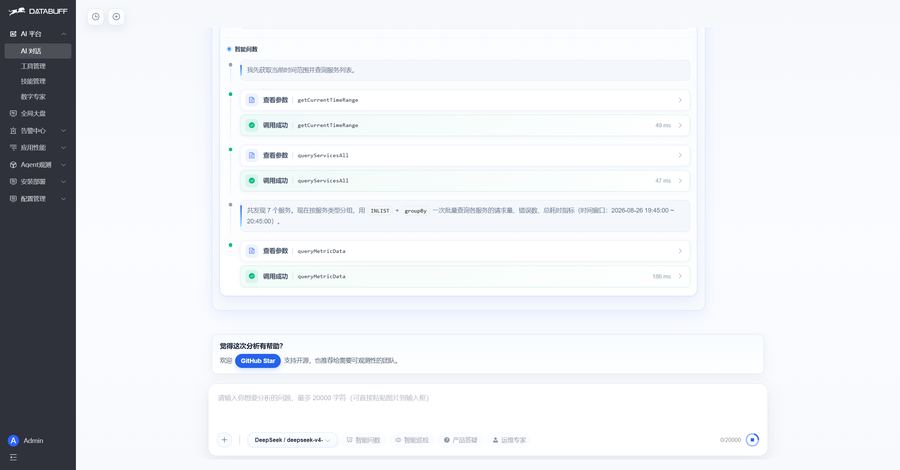
Fig 3-1 · Metrics Q&A expert calls queryMetricData and returns per-service RED summary
Use case 2: One-line smart inspection (Inspect)
Pinpoint Inspector shows JVM curves but does not auto-generate cross-service inspection reports. DataBuff inspection experts combine alerts, metrics, and logs into evidence-backed conclusions for handoffs.
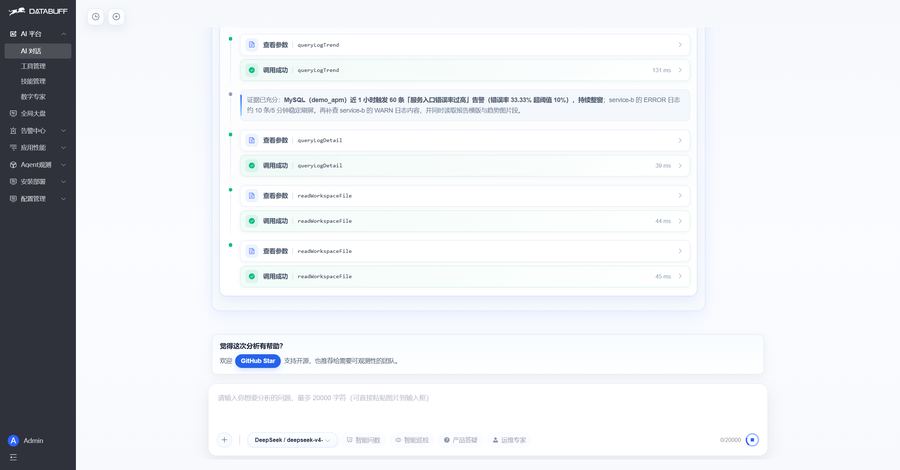
Fig 3-2 · Inspection session summary: MySQL alerts, error-rate threshold, service-b log trend
Use case 3: Trace + topology root-cause diagnosis (Diagnose)
This automates Pinpoint's manual ServerMap → Scatter → CallStack path, organizing topology, metrics, Trace, and alerts into a structured reasoning chain.
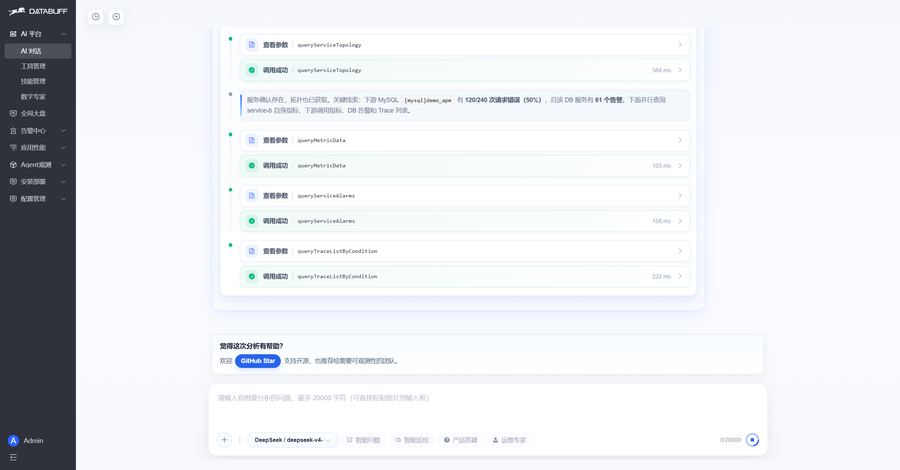
Fig 3-3 · Diagnosis session: topology query, downstream MySQL errors, DB alert count
Summary
Pinpoint full-stack observability builds on ServerMap → Scatter → CallStack → Inspector linkage; Java method-level stack depth remains a core strength; but it does not ship built-in AI Q&A, inspection, or root-cause reports. Three live AI demos show the same OTel data can power Q&A, inspection, and diagnosis in chat — a verifiable side-by-side POC path for Pinpoint legacy plus AI increment.