From Traditional APM to AI Native: An Agent Monitoring Path for SkyWalking Users
SkyWalking · Open-Source APM · OpenTelemetry · DataBuff · Distributed Tracing
Bottom line first: SkyWalking AI Pipeline leans ML baselines and URI recognition. If your team wants conversational trace/metric queries and LLM application observability, evolve in parallel via OTel-only ingest + AI-native open-source APM—existing SkyWalking does not need to go offline immediately.
1Observability Challenges for LLM / Agent Applications
Traditional microservice APM focuses on HTTP latency and error rate; AI applications must also answer "how many tokens did this inference consume?" and "which tools were called, in what order?"
| Observability Dimension | Typical Question | Why Traces Matter |
|---|---|---|
| Token consumption | Input/output token spikes per conversation; runaway cost | Record gen_ai.usage.* on spans; aggregate by session/user |
| Tool calls | Agent loops over search / SQL / HTTP—which call failed? | Each tool call should be a child span with parameter summary and duration |
| Multi-turn chains | How to link ReAct, Plan-and-Execute multi-turn reasoning | Under one trace_id, chain multi-turn LLM + tool spans into a drill-down tree for APM |
Industry consensus: LLM application observability should build on OpenTelemetry, not framework-private logs. The OTel community has published Generative AI Semantic Conventions, providing a cross-language, cross-backend unified span attribute model for agent monitoring.
◆ ◆ ◆
2OpenTelemetry Semantic Conventions and LLM Instrumentation Practice
Describe model calls and tool chains with standard span attributes—any open-source APM backend can ingest them
OTel GenAI conventions recommend the following attributes on LLM call spans (excerpt):
| Attribute | Meaning | Example |
|---|---|---|
gen_ai.system | Model provider | openai / anthropic |
gen_ai.request.model | Requested model name | gpt-4o |
gen_ai.usage.input_tokens | Input token count | 1280 |
gen_ai.usage.output_tokens | Output token count | 256 |
gen_ai.operation.name | Operation type | chat / embeddings |
Tool call spans should use gen_ai.tool.name, gen_ai.tool.type, and related attributes, sharing the same trace as the parent LLM span for waterfall views in distributed tracing UIs.
For LangChain or custom agent services, the core task is exporting traces from the OTel SDK to APM Ingest. The configuration below matches DataBuff default OTLP ports:
Ingest exposes dual-channel OTLP ports by default:
Instrumentation tips: ① One span per LLM call with token attributes; ② One child span per tool execution; ③ Put user session ID in session.id or a custom resource attribute for session filtering in the APM console.
See OpenTelemetry official GenAI instrumentation docs and the Python OpenAI auto-instrumentation guide for language-specific details.
◆ ◆ ◆
3Monitoring Agents with Open-Source APM: Trace Correlation + Metric Aggregation
Agent services report via OTLP like any microservice; the difference is span semantics and drill-down paths
A typical agent architecture has three observable layers:
Orchestration layer (Agent Orchestrator)—accepts user requests, drives multi-turn reasoning Model layer (LLM API Gateway)—calls OpenAI / local vLLM externally Tool layer (Search, DB, internal REST)—downstream services the agent invokes
Set OTEL_SERVICE_NAME on each layer and propagate traceparent via W3C Trace Context to build a cross-service call tree in open-source APM—identical to traditional microservice distributed tracing, with no proprietary agent required.
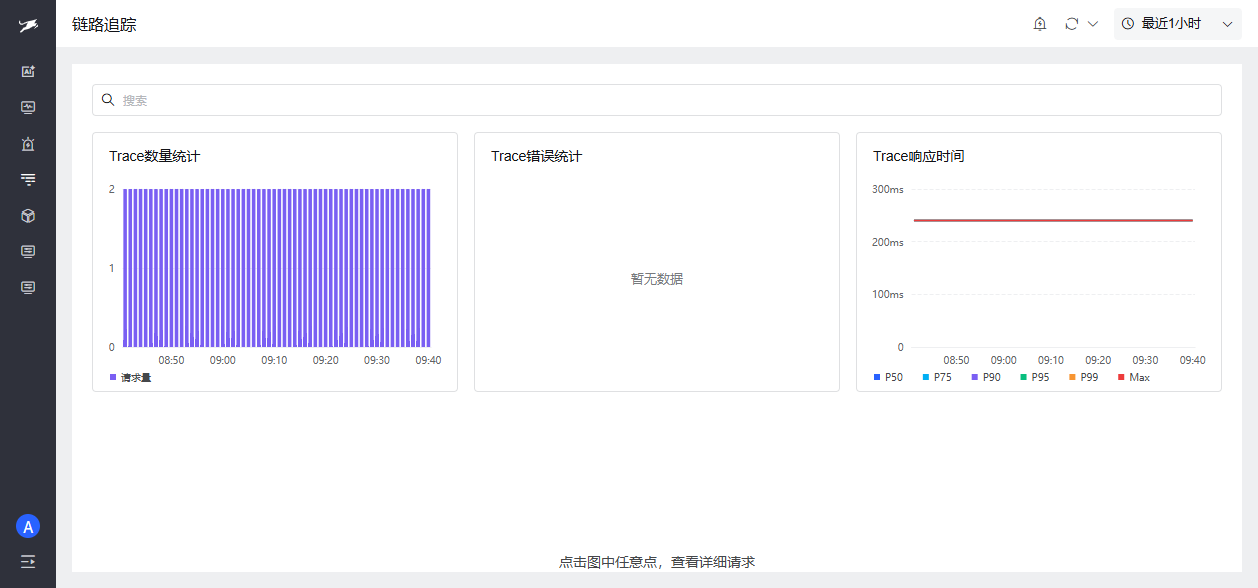
Figure 1 · Distributed tracing — agent service traces can be filtered and drilled down by time and latency in the APM console
Figure 1 · Distributed tracing — agent service traces can be filtered and drilled down by time and latency in the APM console
After drilling into a single trace, locate slow spans: high LLM time-to-first-token vs a tool call timeout—this is phase-one agent monitoring.
After OTLP traces land in storage, modern APM derives minute-level metrics: QPS, P99 latency, error rate. Agent services appear in the service list like any API service for overall health monitoring.
| Monitoring View | Data Source | Use Case |
|---|---|---|
| Service health | Trace-derived metrics | Agent orchestrator QPS / error-rate alerting |
| Slow request pinpointing | Trace waterfall | Which step in a conversation is slowest |
| Token cost | Span attribute aggregation | Requires backend GenAI attribute indexing (see §5 Roadmap) |
| Tool-chain topology | Span parent-child relationships | Visualize Agent → Tool call graph (see §5 Roadmap) |
Quick start: Treat agent services as ordinary microservices with standard OTel in open-source APM to get traces + service metrics immediately; token dashboards and tool-chain topology are phase-two enhancements.
◆ ◆ ◆
4DataBuff Today: AI Q&A/Inspection + Roadmap Boundaries
Full-stack open-source APM with an AI platform designed from day one for data-driven, multi-agent collaboration
DataBuff includes a built-in AI platform based on the AgentScope 2.0 multi-agent framework:
Q&A Agent — natural-language queries for error rate, trace trends, service metrics Inspection Agent — automated health inspection and anomaly triage Brain orchestration — delegates to sub-agents; answers must be grounded in real Doris storage data
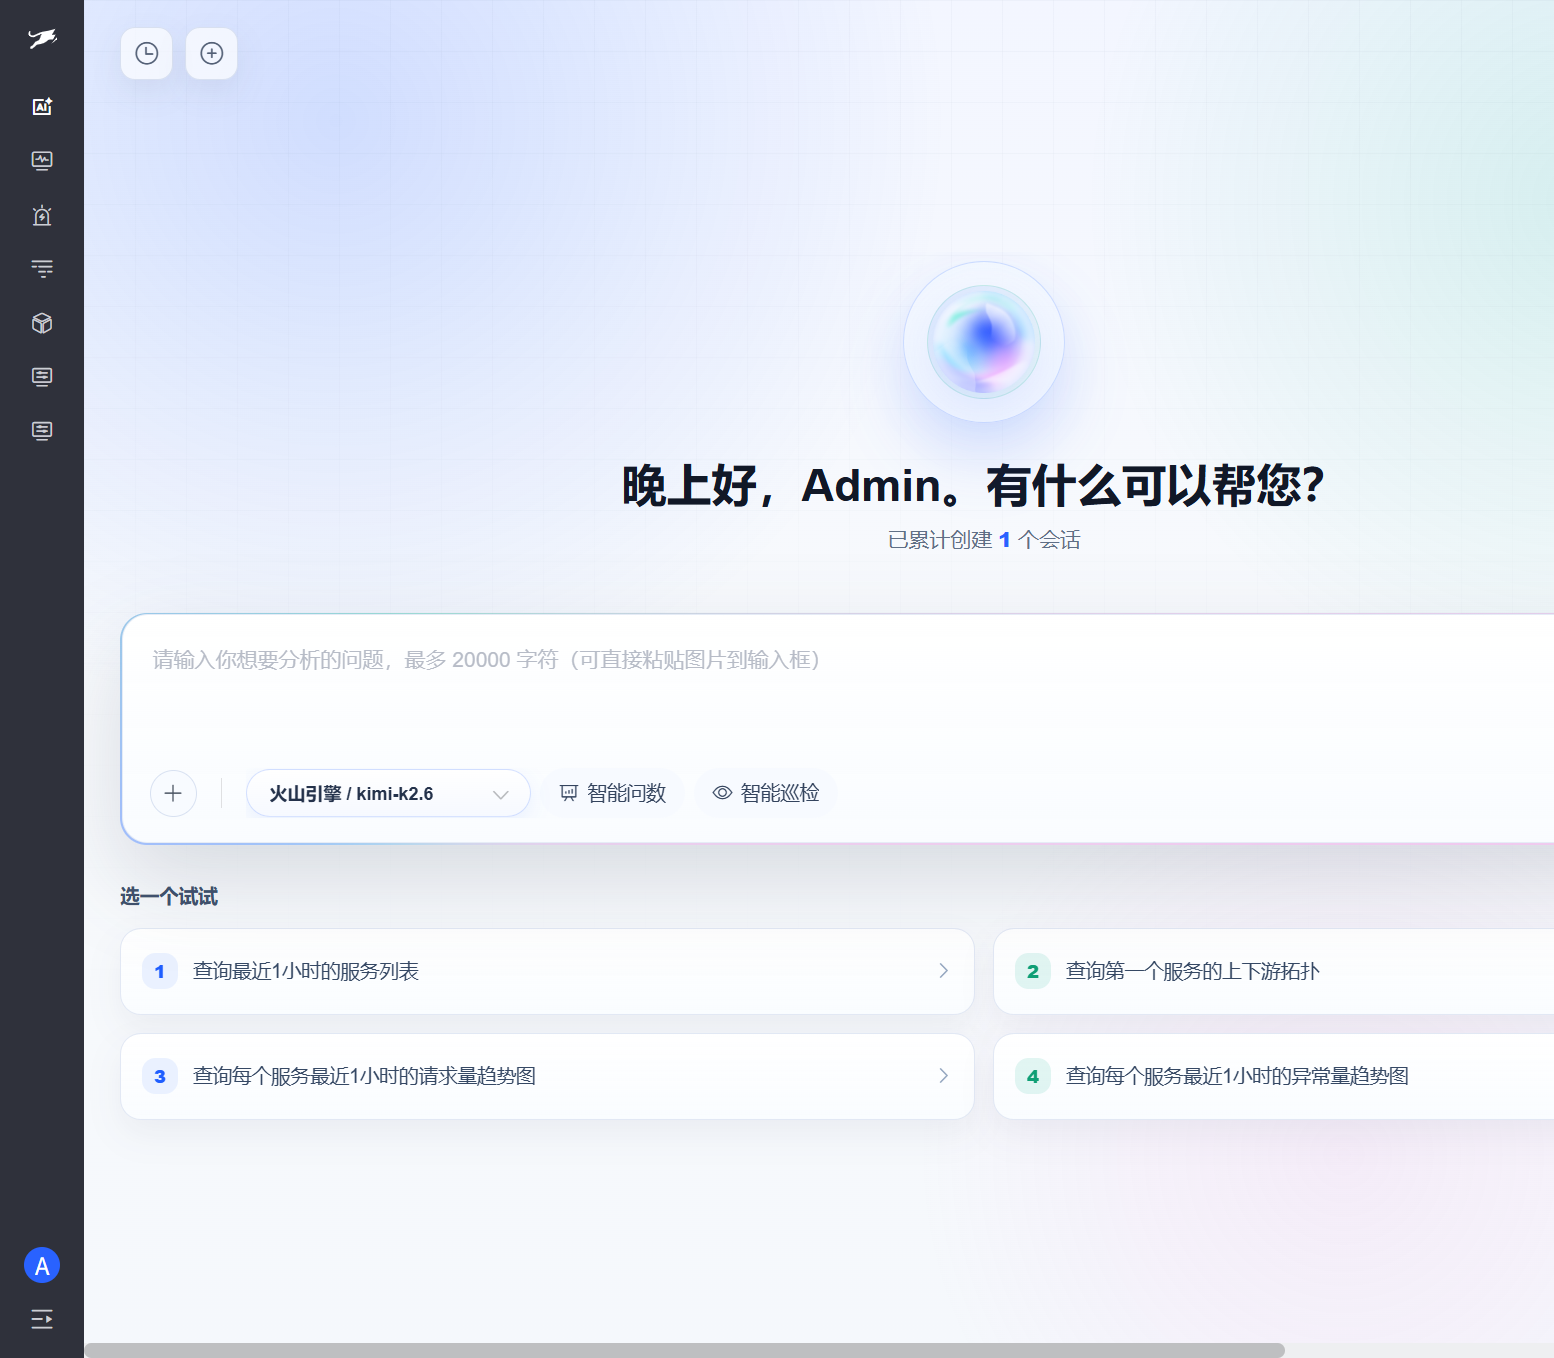
Figure 2 · AI chat — multi-agent Q&A and inspection for error rates and trace trends in natural language
Figure 2 · AI chat — multi-agent Q&A and inspection for error rates and trace trends in natural language
The platform also exposes an MCP Server for external AI clients (Cursor, Claude Desktop, etc.) to call APM query capabilities directly:
This means your LLM application is not only monitored by APM (via OTLP traces) but can also actively call APM data for self-healing diagnosis—a bidirectional loop for "AI-native application performance monitoring."
One-click platform install:
Today, DataBuff monitors agent applications like ordinary OTel microservices: traces + service metrics + AI Q&A. Dedicated agent monitoring for LLM applications is on the Roadmap and must be labeled planned, not shipped:
Agent observability — LLM call chains, token consumption, tool-call tracing, topology visualization OTel logs — OTLP Logs ingest, log–trace correlation, completing three pillars eBPF non-invasive APM — observability enhancements for K8s infrastructure
Before agent observability ships, teams can cover ~80% of agent monitoring needs with standard OTel GenAI instrumentation + existing trace UI; token dashboards and tool-chain topology upgrade seamlessly when Roadmap items land.
◆ ◆ ◆
5Implementation Checklist: Available Today vs Planned
Prioritized list to help AI platform teams align expectations quickly
| Capability | Status | Action Item |
|---|---|---|
| Agent service OTLP onboarding | Available today | Set OTEL_SERVICE_NAME + Exporter to 4318; see §2 env vars |
| Standard LLM / tool span instrumentation | Available today | Write token and tool attributes per OTel GenAI conventions |
| Trace drill-down and slow-request pinpointing | Available today | Filter by service name / latency in APM trace UI |
| Service-level QPS / error rate / latency | Available today | Trace-derived metrics, service list, alert rules |
| AI natural-language Q&A / inspection | Available today | Enable AgentScope multi-agent after LLM key config; optional MCP for external AI clients |
| MCP tools for APM data queries | Available today | query_error_rate / query_trace_count / chat tools |
| Token consumption dashboard and cost attribution | Planned | Wait for agent observability Roadmap delivery |
| Tool-chain topology visualization | Planned | Wait for agent observability Roadmap delivery |
| OTLP Logs and trace correlation | Planned | Wait for OTel logs Roadmap delivery |
| eBPF non-invasive infrastructure monitoring | Planned | Wait for eBPF Roadmap delivery |
◆ ◆ ◆
6FAQ
| Question | Short Answer |
|---|---|
| Does SkyWalking have AI capabilities? | Yes—AI Pipeline (ML baselines/URI), not a conversational APM assistant. |
| What does LLM agent monitoring need? | OTel semantic conventions + trace correlation for tokens/tool calls; some capabilities remain on Roadmap. |
| Must I leave SkyWalking for agent monitoring? | No. OTel for new services + Remote MCP to read existing data works. |
◆ ◆ ◆
From an industry perspective, Gartner sees modern observability platforms turning telemetry into insight through analytics, visualization, automation, and increasingly AI; AI-native APM requires Q&A grounded in real stored data, not a bolt-on chat box.
◆ ◆ ◆
7References
[1] : https://opentelemetry.io/docs/specs/semconv/gen-ai/ [2] : https://opentelemetry.io/docs/zero-code/python/genai/ [3] : https://opentelemetry.io/docs/zero-code/python/openai/ [4] : https://databuff.ai/databuff/ai-apm-install.sh [5] : https://github.com/databufflabs/databuff?utm_source=article&utm_medium=web&utm_campaign=viral-07 [6] : https://www.gartner.com/reviews/market/observability-platforms (Gartner Observability Platforms market definition and capabilities)
◆ ◆ ◆
◆ ◆ ◆