Open Source SkyWalking Architecture Deep Dive and Competitor Comparison 2026
SkyWalking · Open-Source APM · OpenTelemetry · DataBuff · Distributed Tracing
In 2026, many teams still treat SkyWalking as the default APM answer—but 10.x brings substantial breaking changes to engine and storage, while OTel-native plus AI Q&A alternatives are maturing quickly. Below we walk through SkyWalking 10.4 four-layer architecture → DataBuff three-component stack → six-dimension comparison → AI-native hands-on, with key conclusions in tables for easy comparison of onboarding and operational cost.
1SkyWalking 10.4: Four-Layer Architecture
1.1 Logical architecture: Probe → OAP → Storage → UI
SkyWalking officially divides the platform into four segments:
On the Probe side, coverage spans multi-language agents, Service Mesh (Istio/Envoy ALS), eBPF Rover, Telegraf/Zabbix, and more. The data model unifies on Service → Instance → Endpoint → Process, with cross-layer (K8s, Mesh, OS) Service Hierarchy support.
OAP (Observability Analysis Platform) is the architectural center: it receives Trace/Metrics/Logs/Events and generates entities and metrics through DSL pipelines such as OAL (metric analysis), MAL (Meter analysis), and LAL (log analysis). From 10.4 onward, MAL/LAL run on the V2 engine, with metric aggregation and persistence worker pools merged into BatchQueue scheduling.
Storage is pluggable; production deployments commonly use Elasticsearch/OpenSearch or BanyanDB (SkyWalking's native time-series + trace store, with deeper coupling in 10.x). The UI is a customizable web console supporting GraphQL / PromQL / LogQL queries.
1.2 Verifiable deployment and port facts
Docker / Kubernetes Quick Start: see official Setup documentation OAP default gRPC receiver 11800, HTTP 12800; OTLP gRPC is typically 4317 mapped to OAP (confirm in your config) Storage choice drives operational complexity: ES cluster + OAP cluster is a common production topology—significantly more components than "three-container" stacks
◆ ◆ ◆
2DataBuff: Open Source OTel APM and Three-Component Architecture
2.1 Project positioning and highlights
DataBuff (databuffopen) is an AI-native OpenTelemetry APM: ingest Trace/metrics via OTLP first, then let AI read the same storage for Q&A, inspection, and diagnosis. Versus SkyWalking, the differentiator is not "one more chart" but OTel as the default protocol plus built-in multi-agent platform.
| Highlight | Description |
|---|---|
| OTLP-only ingestion | gRPC 4317 / HTTP 4318—direct integration with OpenTelemetry SDK / Java Agent, no proprietary probe binding |
| Minimal three-component stack | Ingest → Doris (storage) → Web platform (query/alerting/AI), one Docker command install |
| Metrics derived from Traces | Minute-level pre-aggregation—one telemetry stream powers RED and trace drill-down |
| AI-native integration | Not a bolt-on chat box: experts query metrics, Traces, topology, and alerts directly via the Tool layer |
| MCP openness | External MCP services can register with digital experts and be invoked in conversation |
Install example (public script; terminal prints UI address and OTLP endpoint after install):
On the application side, standard OTel environment variables suffice:
2.2 Technical architecture breakdown
Design trade-off: unified storage in exchange for architectural simplicity—AI experts need not stitch context across ES + Kafka + multiple microservices. Alerting, service health indicators, global topology, and distributed tracing are covered in Phase 1; AI capabilities extend through Skill (behavior) + Tool (data access) + Expert (role)—new capabilities register as experts/tools rather than OAP-style DSL changes.
◆ ◆ ◆
3SkyWalking vs DataBuff: Six-Dimension Architecture Comparison
Both are open-source APM, but design philosophy and operational shape differ significantly
| Dimension | Apache SkyWalking 10.4 | DataBuff (databuffopen) |
|---|---|---|
| Architecture layers | Probe + OAP + Storage + UI (four layers) | Ingest + Doris + Web (three layers) |
| Core backend | OAP cluster (OAL/MAL/LAL pipelines) | Lightweight Ingest + Doris column store |
| Default ingestion | SkyWalking Agent + multi-protocol receivers | OTLP 4317/4318 primary |
| Storage | ES / BanyanDB / JDBC plugins, etc. | Doris unified storage |
| Extension model | OAL/MAL/LAL YAML + module plugins | AI Tool / Skill / Expert + MCP |
| AI capabilities | AI Pipeline (URI recognition, baseline alerting, etc.) | Conversational Q&A, inspection, multi-agent orchestration |
| Typical operations | OAP + storage cluster; DSL rule upgrades need regression | Three containers to start; script install |
| Best fit | Four pillars in one, Mesh/eBPF, deep SkyWalking ecosystem | OTel unified ingestion, self-service ops, AI-assisted troubleshooting |
Teams already at scale on SkyWalking Agent, relying on BanyanDB/ES historical data and OAL rules—continuing on 10.4 has the lowest migration cost. Teams pushing OpenTelemetry standardization, wanting fewer components, and needing natural-language Trace/metric queries can run a parallel DataBuff POC—the two can split traffic by environment via OTLP without a big-bang migration.
◆ ◆ ◆
4DataBuff AI-Native Capabilities: Demo Walkthrough
All screenshots below are from live operations on demo.databuff.ai after login (2026-06-30)
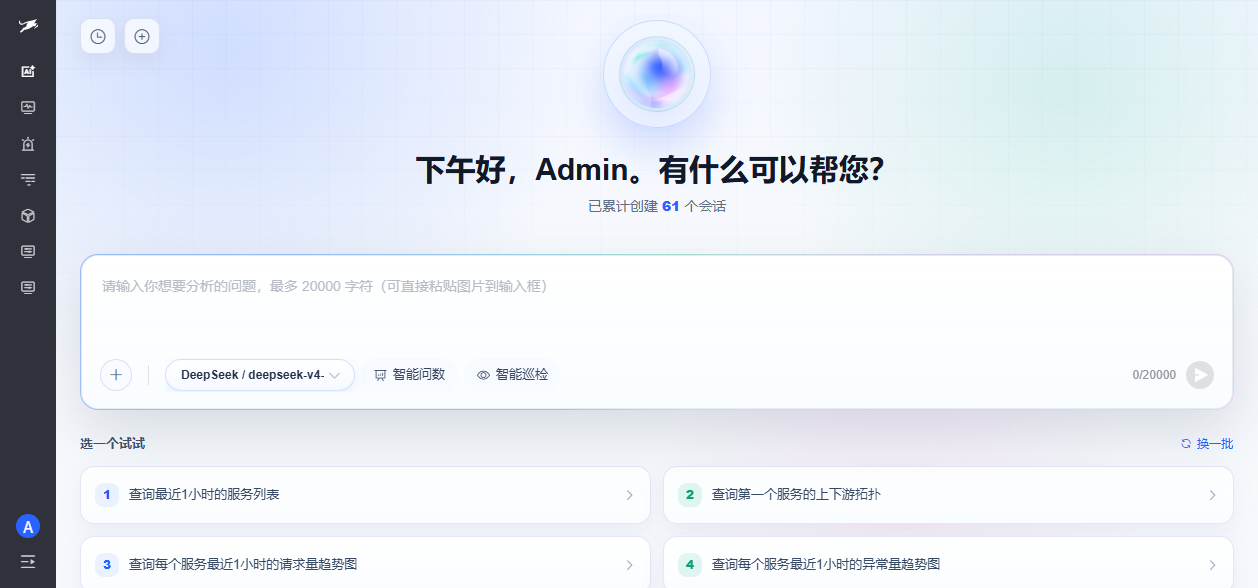
Figure 4-1 · AI platform default chat page: supports Smart Q&A and Smart Inspection modes; switch LLM at the bottom; one-click prompts like "List services / topology / trends" lower the first-use barrier.
Figure 4-1 · AI platform default chat page: supports Smart Q&A and Smart Inspection modes; switch LLM at the bottom; one-click prompts like "List services / topology / trends" lower the first-use barrier.
In the chat, select "Query service list for the last hour." The AI Brain dispatches the Smart Q&A expert, calling built-in APM Tools to return a structured table (including virtual middleware nodes and explanatory text):
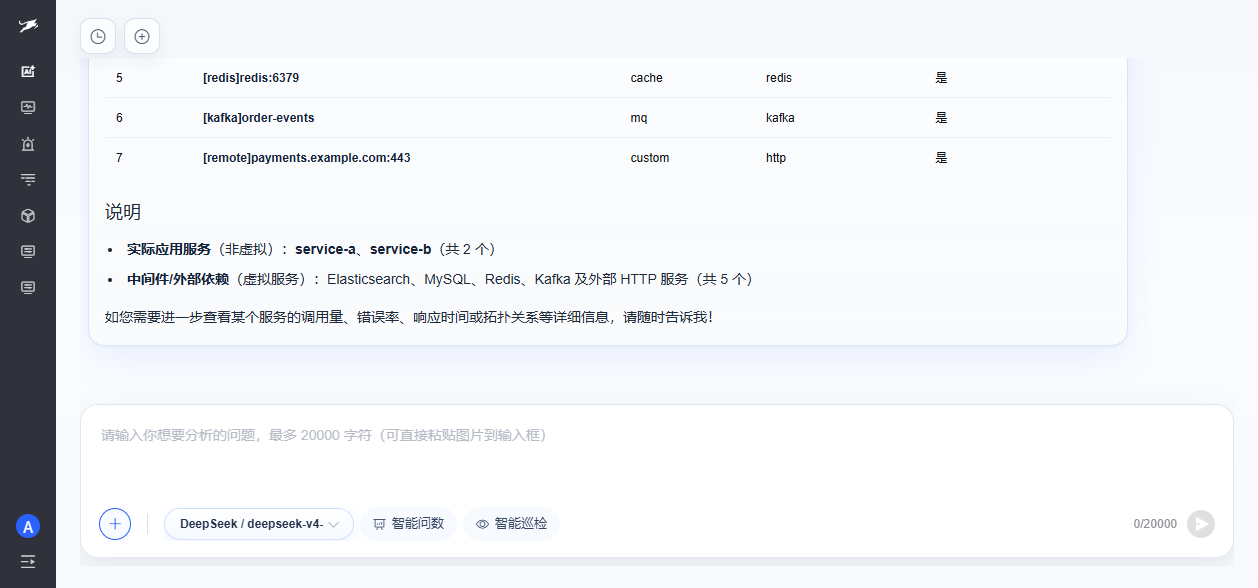
Figure 4-2 · Q&A example: lists service-a / service-b and dependencies such as Elasticsearch, MySQL, Redis, Kafka; header shows "Thinking complete, 11s · 10 steps"—evidence of multi-step Tool calls, not a single LLM hallucination. Follow up with "Which service has the highest P99?" or "Plot request volume trend."
Figure 4-2 · Q&A example: lists service-a / service-b and dependencies such as Elasticsearch, MySQL, Redis, Kafka; header shows "Thinking complete, 11s · 10 steps"—evidence of multi-step Tool calls, not a single LLM hallucination. Follow up with "Which service has the highest P99?" or "Plot request volume trend."
The "hands" of the AI architecture is the Tool layer. The Tool Management page shows 14 local built-in APM tools (query metrics, plot trends, dispatch expert tasks, etc.) and reserves MCP tool slots to attach external SSE / Streamable HTTP MCP services to digital experts:
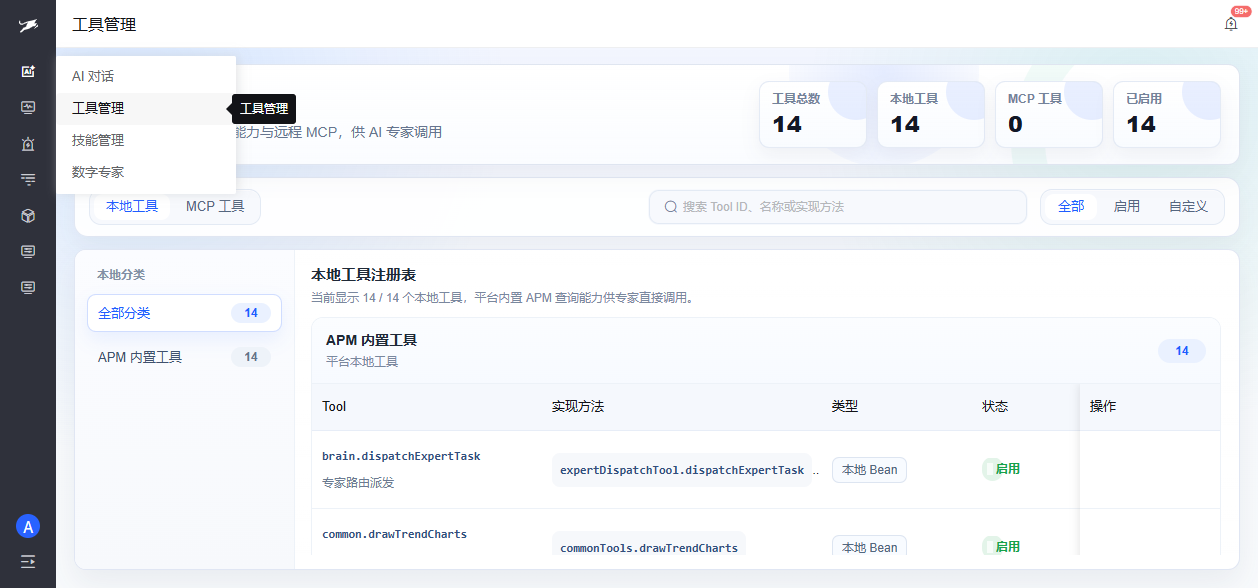
Figure 4-3 · Local tool registry (e.g. brain.dispatchExpertTask, common.drawTrendCharts) and MCP tool category; experts access Trace/metrics in unified Doris storage via Tools for data-driven answers.
Figure 4-3 · Local tool registry (e.g. brain.dispatchExpertTask, common.drawTrendCharts) and MCP tool category; experts access Trace/metrics in unified Doris storage via Tools for data-driven answers.
Contrast with SkyWalking AI Pipeline: SkyWalking focuses on ML pipelines over telemetry (URI clustering, metric baselines, etc.); DataBuff treats conversational experts + Tool/MCP as first-class capabilities for on-call engineers who want to query and inspect in natural language.
◆ ◆ ◆
5Summary
| If you need… | Better fit |
|---|---|
| Mesh/eBPF, four pillars, BanyanDB, deep OAL customization | SkyWalking 10.4 |
| OTLP standard ingestion, three-component deployment, AI Q&A/inspection/MCP | DataBuff |
2026 observability selection is shifting from "pick one big backend" to "protocol standardization + simplified architecture + intelligent interaction." SkyWalking 10.4 solidifies the OAP foundation with engine V2 and BatchQueue; DataBuff combines OTel + Doris + multi-agent to make "asking data" a native platform operation. Run a one-week POC per team based on OTel progress, evaluate storage and query latency with real Trace volume, then decide primary and parallel paths.
From an industry perspective, Gartner's observability platform research notes that most products now include APM, yet APM alone no longer covers enterprise observability needs. When comparing SkyWalking and DataBuff architectures, look at OTel unified ingestion, component operational surface, and AI analysis depth as platform evolution directions—not just whether Traces are queryable.
◆ ◆ ◆
6References
1. https://skywalking.apache.org/docs/main/latest/readme/ (SkyWalking 10.4.0 official docs and changelog) 2. https://skywalking.apache.org/docs/main/latest/en/changes/changes-10.3.0/ (10.3.0 release notes) 3. https://skywalking.apache.org/docs/main/latest/en/concepts-and-designs/overview/ (Architecture overview: Probe / OAP / Storage / UI) 4. https://skywalking.apache.org/docs/main/latest/en/setup/quick-start/ (Quick Start) 5. https://github.com/databufflabs/databuff (DataBuff open-source repository) 6. https://databuff.ai/databuff/ai-apm-install.sh (DataBuff install script) 7. https://demo.databuff.ai/ (DataBuff online Demo) 8. DataBuff docs · External MCP integration (public documentation site) 9. https://skywalking.apache.org/docs/main/latest/en/ai-pipeline/introduction/ (SkyWalking AI Pipeline introduction) 10. https://www.gartner.com/reviews/market/observability-platforms (Gartner Observability Platforms market definition and capability overview)
◆ ◆ ◆
◆ ◆ ◆