Abstract: Once dozens of microservices are wired together, the hard part is rarely “whether you have monitoring”—it is which instances and which downstream hops are stalling a single request. This article clarifies SkyWalking 10.x positioning, selection trade-offs, and core concepts; walks through official Agent onboarding; then uses databuff-proxy dual-write so the same traces land in both OAP and DataBuff for side-by-side service, topology, and AI querying checks.
An observability platform for microservices and cloud-native stacks: tracing, metrics, logs, and profiling in one place.
In systems made of dozens to hundreds of microservices, troubleshooting tends to hit the same walls: how to stitch a request’s call chain and find the slow hop quickly; how to see service dependencies; how to analyze endpoint-level performance; how to reconstruct business flow order. Without a unified trace and topology view, teams bounce between logs, metrics, and guesswork. Worse: at peak traffic “average latency still looks fine,” while SLA is killed by a long-tail Span on one downstream instance—without Trace, that class of issue is mostly luck.
SkyWalking is an application performance monitoring and observability analysis platform for distributed systems, aimed at microservices, cloud-native, and containerized environments (Docker, Kubernetes, and the like). Beyond distributed tracing, it places mesh telemetry, metric aggregation, log correlation, and visualization on one backend and UI. The project grew from open-source practice starting in 2015 and later became a top-level ASF project. As of 2026, the stable backend line is represented by 10.4.0 (including GenAI observability, Grafana Tempo compatibility, and related evolution); the Java Agent ships on its own line (e.g. 9.7.x) and pairs with OAP 10.x. Official docs list both “Showcase one-click experience” and “Quick Start the backend” as entry paths: the former for end-to-end effect first, the latter for running OAP/UI/storage in your own environment.
Compared with lightweight tools that only show call chains, SkyWalking is closer to a full observability platform: the same probe data feeds topology, RED-style service metrics, alerting, and Profiling. On the 2024–2026 release line, storage leans clearly toward BanyanDB (from 10.2 the default path no longer depends on H2), the UI centers on Horizon, and external formats such as Zipkin / OTLP remain supported—so existing SkyWalking Agents and a new OTel pipeline can coexist instead of a rip-and-replace.
1.1 How to compare tracing options
For engineering selection, a common neutral comparison looks like this (capability boundaries; concrete numbers belong to each project’s docs and your own load tests):
| Option | Traits (neutral summary) | Typical fit |
|---|---|---|
| Zipkin | Lightweight call-chain analysis; strong Spring Cloud Sleuth / Brave ecosystem fit | Need “see the chain first,” keep deploy simple |
| OpenTelemetry | Vendor-neutral telemetry standard; OTLP unifies traces / metrics / logs; backends swappable | Instrument once, multi-backend, reduce lock-in |
| DataBuff | Open-source APM: native OTLP + SkyWalking Agent compatibility; topology / services / Trace / AI querying on one stack | Keep existing Agents, deepen analysis and on-call surface |
| Pinpoint | Bytecode injection, rich plugins, strong UI, no business-code intrusion on the agent side | Fine-grained probes and console experience |
| SkyWalking | Bytecode injection + multi-language Agents + Mesh/eBPF; UI, alerts, and topology together | Large community, rich documentation |
| CAT and similar | Code/config-oriented access covering tracing, monitoring, logs, and alerts as a suite | Team already has matching access habits and ops |
On probe overhead: community and vendor comparison posts often cite conclusions like “under full sampling and high concurrency, SkyWalking’s throughput impact is relatively smaller.” Emphasize: sampling rate, plugin set, JDK version, and business paths change the answer. Production should use load tests on your own paths, and include sampling (e.g. samples per 3 seconds) and ignored endpoint suffixes in the comparison. Pasting someone else’s bench table into capacity planning is one of the most common mistakes in tracing governance.
Two more engineering questions help selection: does the team already own Spring Cloud Sleuth / OTel instrumentation assets; do you strongly depend on Mesh or eBPF zero-code coverage. The former decides whether you must maintain two context-propagation stacks; the latter decides whether SkyWalking stays the primary stack while DataBuff enters as “dual-write to deepen analysis” rather than replacing probes immediately.
1.2 Main capabilities
- Multiple monitoring approaches: language agents, Service Mesh receivers, and more—covering app and infra signals.
- Multi-language auto agents: Java, .NET, Node.js, Go, Python, PHP, Rust, and other independent Agent repos keep evolving.
- Lightweight and efficient: aggregation and query without standing up a heavy big-data platform first (storage scales with size).
- Modular: UI, storage, and cluster management can be replaced or scaled horizontally.
- Alerting: rule- and metric-expression-driven notifications.
- Visualization: topology, service dashboards, Trace waterfall, logs, and Profiling in one console.
1.3 Architecture overview
Logically, still four stages:
[ Probe / Receiver ]
        │  gRPC / OTLP / Zipkin / Prometheus …
        ▼
[ OAP Observability Analysis Platform ]  →  aggregate · stream analysis · alert
        ▼
[ Storage ]  →  BanyanDB / Elasticsearch / other storage plugins
        ▼
[ UI ] → Horizon UI (v10/v11 generation) · topology · Trace · metrics · logs- Agent: bytecode enhancement (ByteBuddy is common on Java), loaded via
-javaagent, intercepts target methods at startup. - SDK: explicit business calls; code-invasive; fits special frameworks.
- Service Mesh / eBPF: collect from proxies or the kernel; fits deep mesh and infra observation.
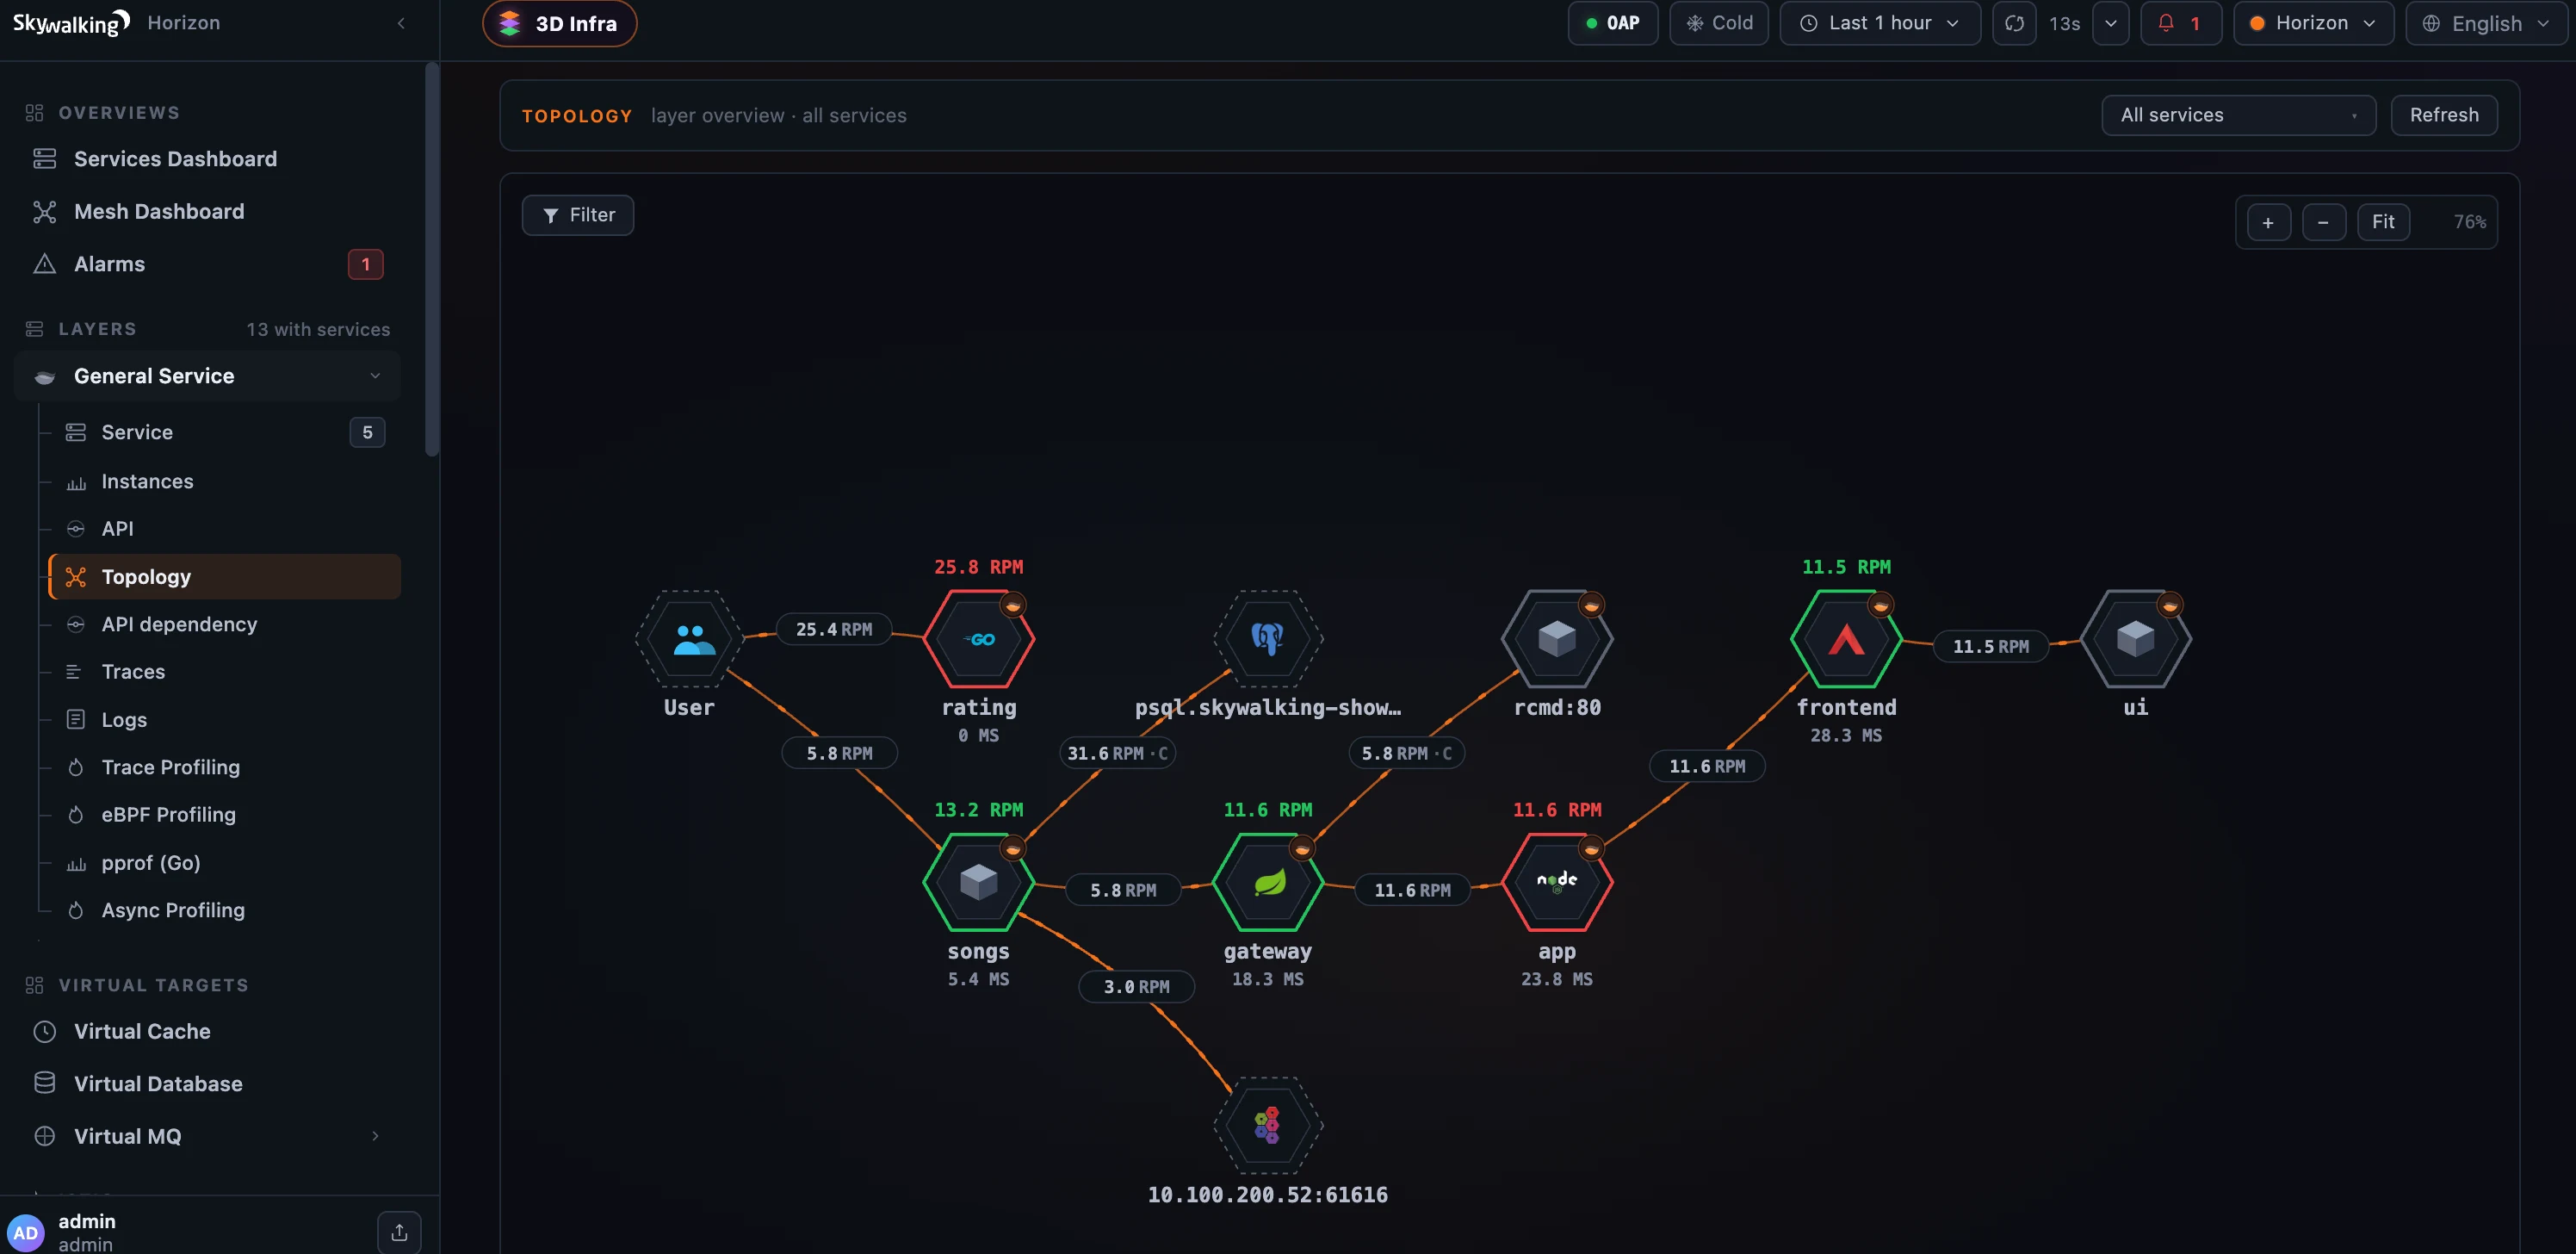
The backend centers on OAP (Observability Analysis Platform): receive probe data, analyze metrics and call chains, write storage, and expose queries. Historically there was OAL and related analysis languages; the 10.x docs emphasize MQE, storage choices (BanyanDB / Elasticsearch are common in production), and Marketplace out-of-box capabilities. The UI evolved from early RocketBot to Horizon UI; the demo site is Horizon as well.
1.4 Three core concepts
- Service: a set of workloads that provide the same behavior; named via
agent.service_nameon the Agent side. - Service Instance: each workload instance in that set, usually one OS process.
- Endpoint: the path where a service receives requests, e.g. an HTTP URI or gRPC class name + method signature.
Understanding these three lets you drill UI paths as “service list → instance → endpoint → Trace” instead of staring at one waterfall and guessing root cause.
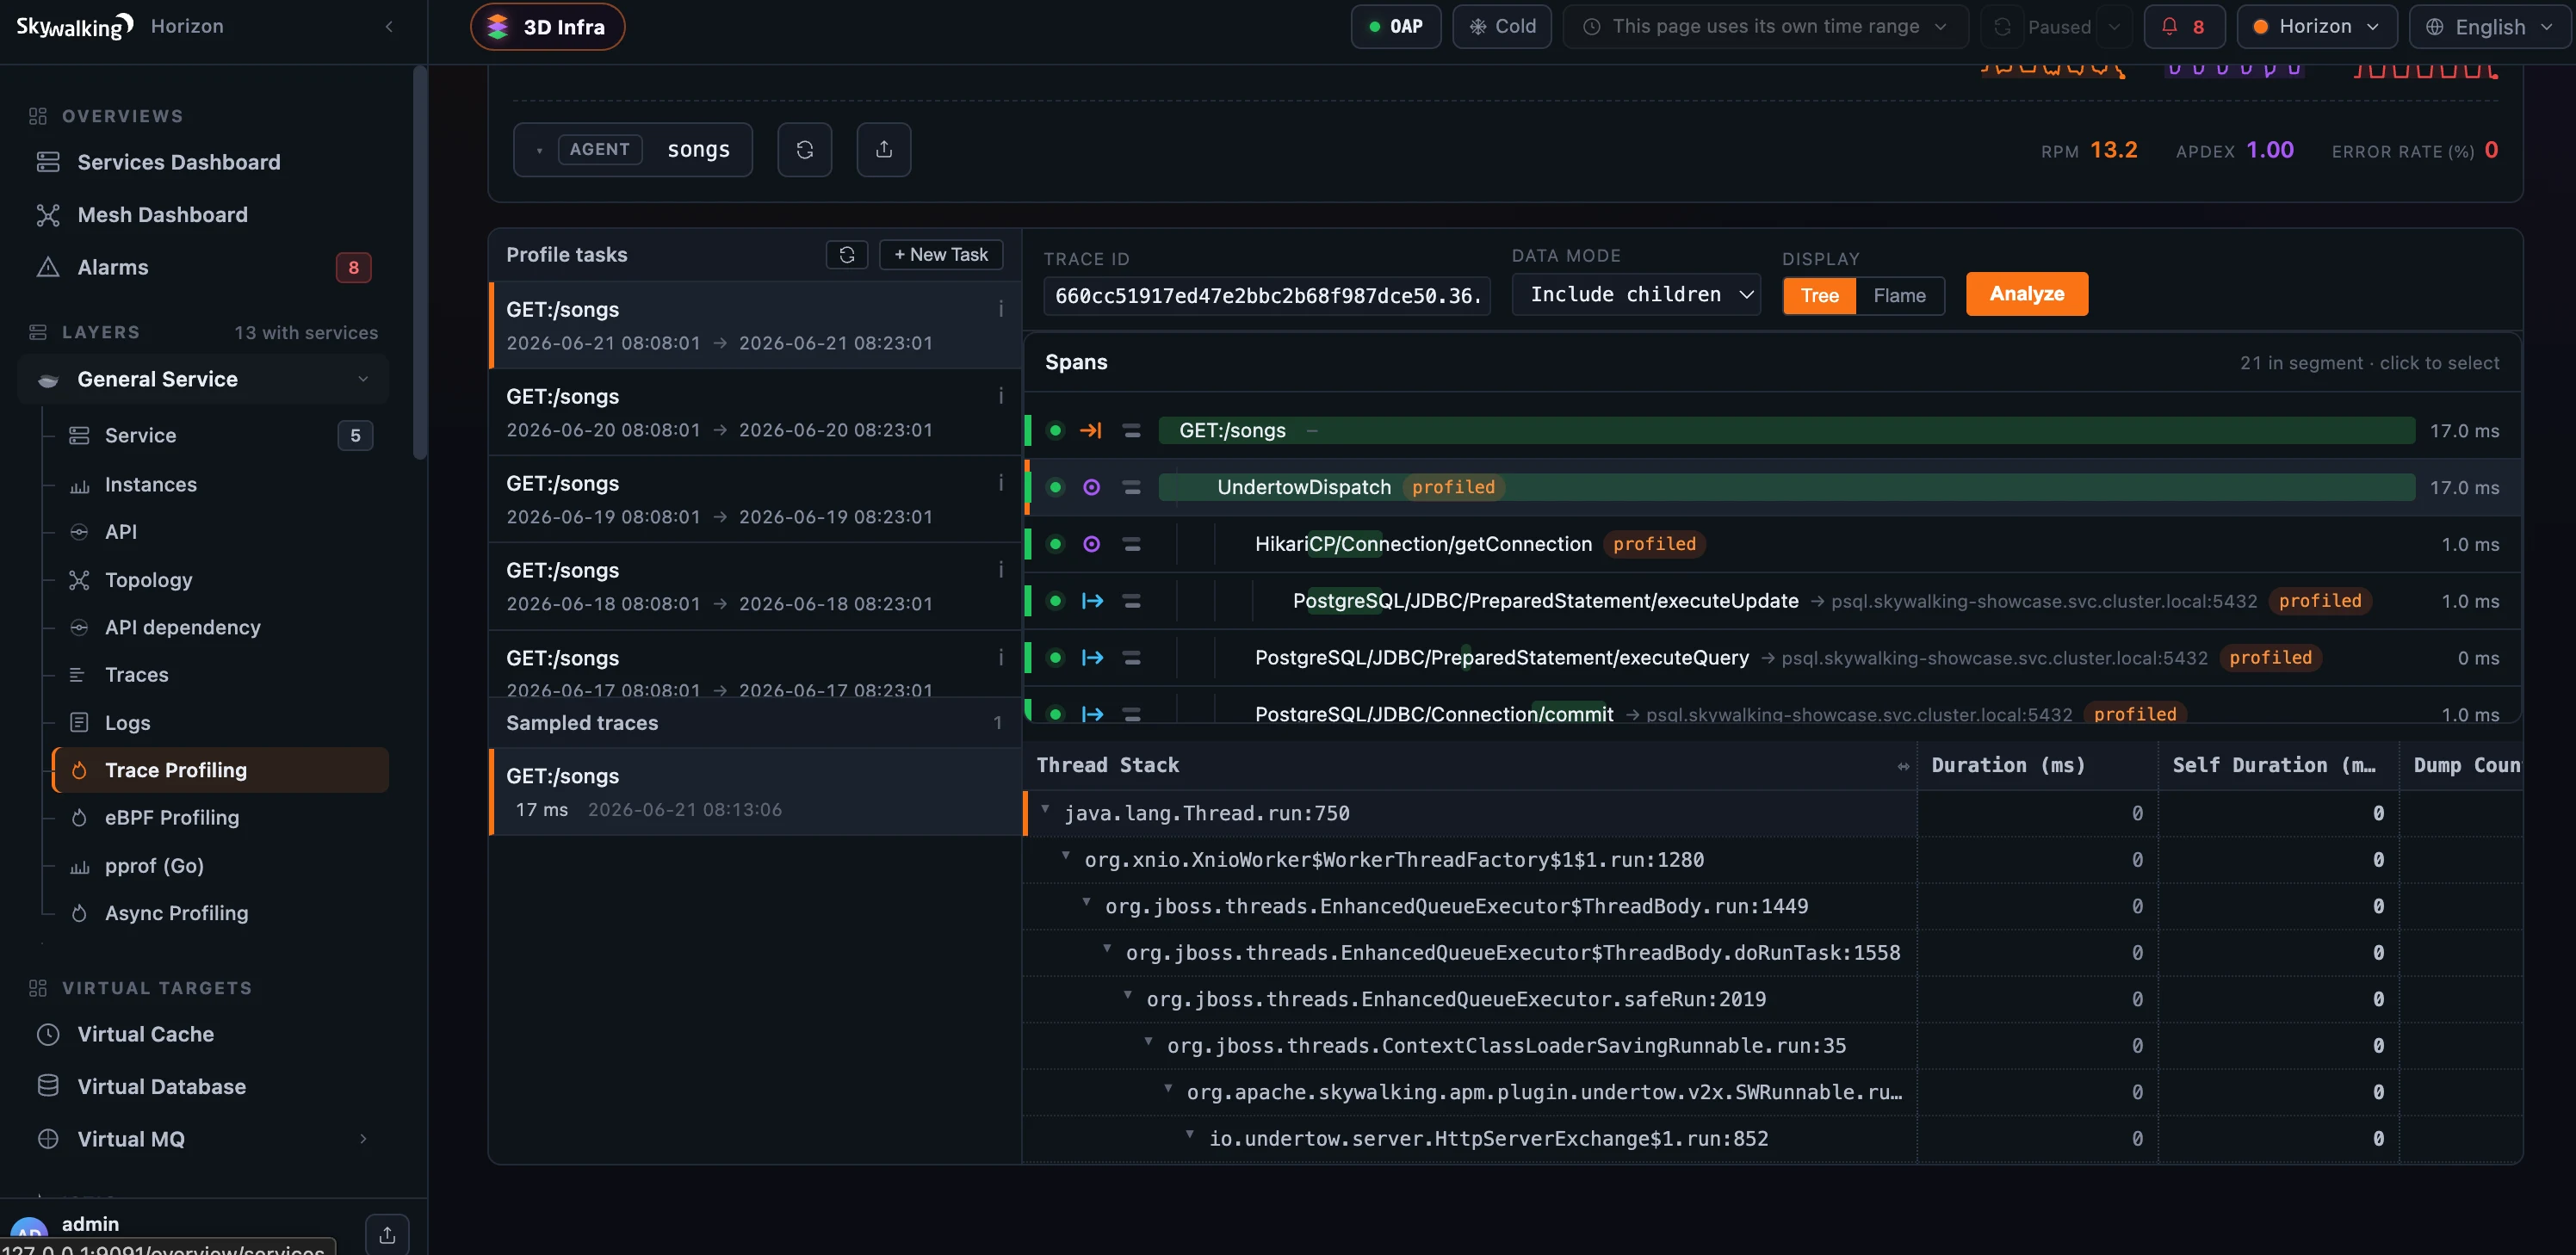
Aligned with official docs: stand up the backend in one shot, attach a Java Agent, view Traces, plus alerting, persistence, and cluster essentials.
2.1 Bring up the backend quickly
Official docs provide a Docker one-liner that lets you choose a storage backend (e.g. Elasticsearch or BanyanDB) and starts OAP + UI. First runs should use a clean Docker environment so occupied 11800/8080 does not yield “script succeeded but UI never opens.” On port conflicts, fix compose mappings before blaming Agent addresses.
Linux / macOS / WSL:
bash <(curl -sSL https://skywalking.apache.org/quickstart-docker.sh)Windows PowerShell:
Invoke-Expression ([System.Text.Encoding]::UTF8.GetString(
  (Invoke-WebRequest -Uri https://skywalking.apache.org/quickstart-docker.ps1 -UseBasicParsing).Content))
Typical ports (same as official Docker notes):
- Agent gRPC report: 11800
- OAP HTTP / query: 12800
- UI: 8080
Binary packages for 10.4.0 are also available from Downloads; unpack and start OAP and UI per docs. Do not rely on in-memory default storage in production—move early to BanyanDB / ES. When done experimenting, tear down by compose project name so leftover containers do not eat disk. Showcase (the music sample app) is for topology and Profiling demos; Quick Start backend is a separate track: one for effect, one for deploy practice.
2.2 Java Agent onboarding (jar / IDE)
Download a Java Agent release that matches your OAP (independent line, e.g. 9.7.x). After unpack, the core pieces are skywalking-agent.jar and config/agent.config. -javaagent must come before -jar.
export SW_AGENT_NAME=springboot-demo
export SW_AGENT_COLLECTOR_BACKEND_SERVICES=127.0.0.1:11800

java -javaagent:/path/to/skywalking-agent.jar \
  -Dskywalking.agent.service_name=${SW_AGENT_NAME} \
  -Dskywalking.collector.backend_service=${SW_AGENT_COLLECTOR_BACKEND_SERVICES} \
  -jar springboot-demo.jar
Common agent.config counterparts:
agent.service_name=${SW_AGENT_NAME:Your_ApplicationName}
collector.backend_service=${SW_AGENT_COLLECTOR_BACKEND_SERVICES:127.0.0.1:11800}
System properties with the skywalking. prefix can override the config file; env vs -D precedence follows the Agent version docs. For IDEA local debug: Run/Debug Configurations → select the app → put -javaagent:... and the collector address in VM options, Apply, then start—no business code changes. With Spring Boot layered jars or custom ClassLoaders, keep Agent and app on the same major JDK and search startup logs for strings like SkyWalking agent begin to confirm the probe attached.
Set sampling and noise baselines during integration: full sampling in dev to see data fast; in staging/prod tune agent.sample_n_per_3_secs and ignored static suffixes to acceptable overhead. Cross-thread and cross-MQ paths also need plugin coverage for your framework versions—official plugin lists move with Agent releases. Missing plugins look like “downstream not traced,” when the real issue is lost context.
2.3 Cross-service and custom tracing
With multi-service setups, as long as each process attaches a compatible Agent pointing at the same OAP (or the same proxy), cross-process context propagates via protocol headers (default sw8), and the UI shows cross-service Traces. Validate first with two minimal Spring Boot services (A calls B): different service_name, same collector, then confirm A→B parent/child on the Trace waterfall.
For uncovered frameworks, extend with official plugins or Toolkit API manual instrumentation; watch limits such as agent.span_limit_per_segment so exception paths do not explode Spans and overwhelm OAP. Custom spans should wrap “business-critical steps” only—not every getter—or the UI looks rich while storage and query collapse first.
2.4 Alerts, logs, and persistence
- Alerts: configure rules on OAP (YAML / console, depending on version), wire Webhook, email, etc.; align expressions with your MQE/metric model. During integration, start with an intentionally high threshold to prove the channel, then restore production thresholds.
- Logs: Agents can report logs correlated with Trace context; other receivers can also write into OAP for TraceId join in the UI. Filter at collection when volume is high—do not pour Debug floods into storage.
- Persistence: Quick Start is for experience only; production chooses BanyanDB or Elasticsearch and plans TTL, shards, and disk. Before major upgrades, read Breaking Changes (e.g. storage defaults) and fully replay queries and alerts in staging.
2.5 Cluster essentials
OAP is often clustered: multiple instances share one store; the UI points at multiple OAP query addresses. Kubernetes can use the official Helm Chart; Agent collector.backend_service must target a stable Service / Ingress entry, not a transient Pod IP. On rolling upgrades, scale out before scale in, and watch gRPC connections and latency.
High-frequency cluster issues: NTP skew (broken cross-host Trace timelines), only half the OAP set writing storage, UI still pointing at an old OAP list. When services appear in the console but new Traces do not, first reconcile “write cluster” vs “query cluster” before blaming the Agent.
Keep the SkyWalking Agent; dual-write with databuff-proxy for parallel validation, then decide cutover.
DataBuff Ingest implements SkyWalking native gRPC v3 (Trace / JVM / Log) directly; the default port is also 11800, so you do not have to switch to OTLP probes first. For teams already running SkyWalking Agents in production, this is the lowest-cost entry: keep the agent jar, plugin set, and service naming; changes concentrate on “where reports go” and “how to roll back during comparison.”
3.1 Dual-write (databuff-proxy)
Architecture sketch
Business process (SkyWalking Agent)
        │  gRPC :11800
        ▼
   databuff-proxy
        ├──▶ SkyWalking OAP   :11800 (or remapped address)
        └──▶ DataBuff Ingest  :11800
The proxy does gRPC fan-out: the same Segment / JVM / Log batches are copied symmetrically to both sinks with no protocol conversion. If one sink fails or writes are disabled, the other keeps working; the admin page shows success / failure / drop and circuit state. The design point is “symmetric copy,” not “convert then write”—during comparison both sides should see the same raw probe data; differences come from each backend’s aggregation, storage, and UI, not two instrumentation stacks.
Prerequisites
- DataBuff and SkyWalking OAP are online; the proxy host can reach both gRPC ports (commonly
:11800; on K8s DataBuff may be NodePort31180). - Deploy proxy on a host (or container). For “zero business config change,” proxy can take over the original OAP host’s
:11800and move OAP to a new port—both approaches mean “traffic through proxy”; docs default to pointing Agents at the proxy. - Record current OAP addresses, change tickets, and rollback owners; fix a comparison window (e.g. two weeks) so dual-write does not run forever on bandwidth.
Install and configure proxy
Download the matching package from databuff-proxy Releases, unpack, and edit config.yaml:
backends:
  - name: skywalking
    addr: "<oap-host>:11800"
    enabled: true
  - name: databuff
    addr: "<databuff-ingest-host>:11800"
    enabled: true
./start.sh # background; ./stop.sh to stop
# Admin page default http://<proxy-host>:9090/ (see admin.addr)Docker images can declare backends via env (e.g. BACKENDS) and map 11800 (Agent) and 9090 (admin). After start, confirm both sinks healthy on the admin page before changing Agents—avoid “Agent already points at proxy, but downstream addresses are wrong,” which blanks both sides.
Point Agents at the proxy
# agent.config
agent.service_name=my-service
collector.backend_service=<proxy-host>:11800

# or JVM
-Dskywalking.collector.backend_service=<proxy-host>:11800
Restart the app or roll Pods. Traffic then dual-writes through the proxy. Some migration docs also use agent.backend_service; it targets the same report address as the collector key—check your Agent version docs for the exact key. Canary advice: change 1–2 non-critical services first, finish the acceptance table below, then expand by domain.
Parallel validation
| Check | Expected |
|---|---|
| SkyWalking UI | Existing services and Traces still appear normally |
| DataBuff Web | Same service_name appears; new requests are queryable as Trace; data.source is SkyWalking |
| proxy admin | Both sinks forward successfully, no sustained drops; circuit state healthy |
| JVM / Log | Visible on both sides if the Agent enables those reports |
| Call relationships | In the same time window, key edges (e.g. A→B, A→DB) are explainable on both topologies |
Public stability validation at about QPS=35 dual-write: proxy uses under 1 core, tens of MB of memory flat overnight; when one sink dies or writes are turned off, the other is unaffected. Application teams should retest on their own traffic and put “admin drop count stays 0” into the comparison-period daily notes.
Cutover and rollback
Leaving SkyWalking: once DataBuff meets the bar, either disable skywalking writes on the proxy admin page (DataBuff-only immediately), or point Agents straight at DataBuff Ingest and retire proxy / OAP.
Rollback: during dual-write, disable databuff writes or point Agents back to OAP; after cutover, point Agents back to OAP or re-enable the skywalking sink on proxy. Note: historical OAP Traces/metrics and alert YAML do not migrate into DataBuff automatically—rebuild alerts on the DataBuff side. On cutover day, keep a buffer of “disable writes only, leave OAP online” so you can return to dual-write or OAP-only in one step.
3.2 What you get after ingest
Once dual-write works, the value is not “another UI”—it is whether the same probe data can be accepted on both sides, then used on DataBuff’s native troubleshooting paths. The effects below can be verified against public Demo or docs; if a distribution channel has environment limits, treat the DataBuff docs site, release notes, and live Demo as source of truth (see References).
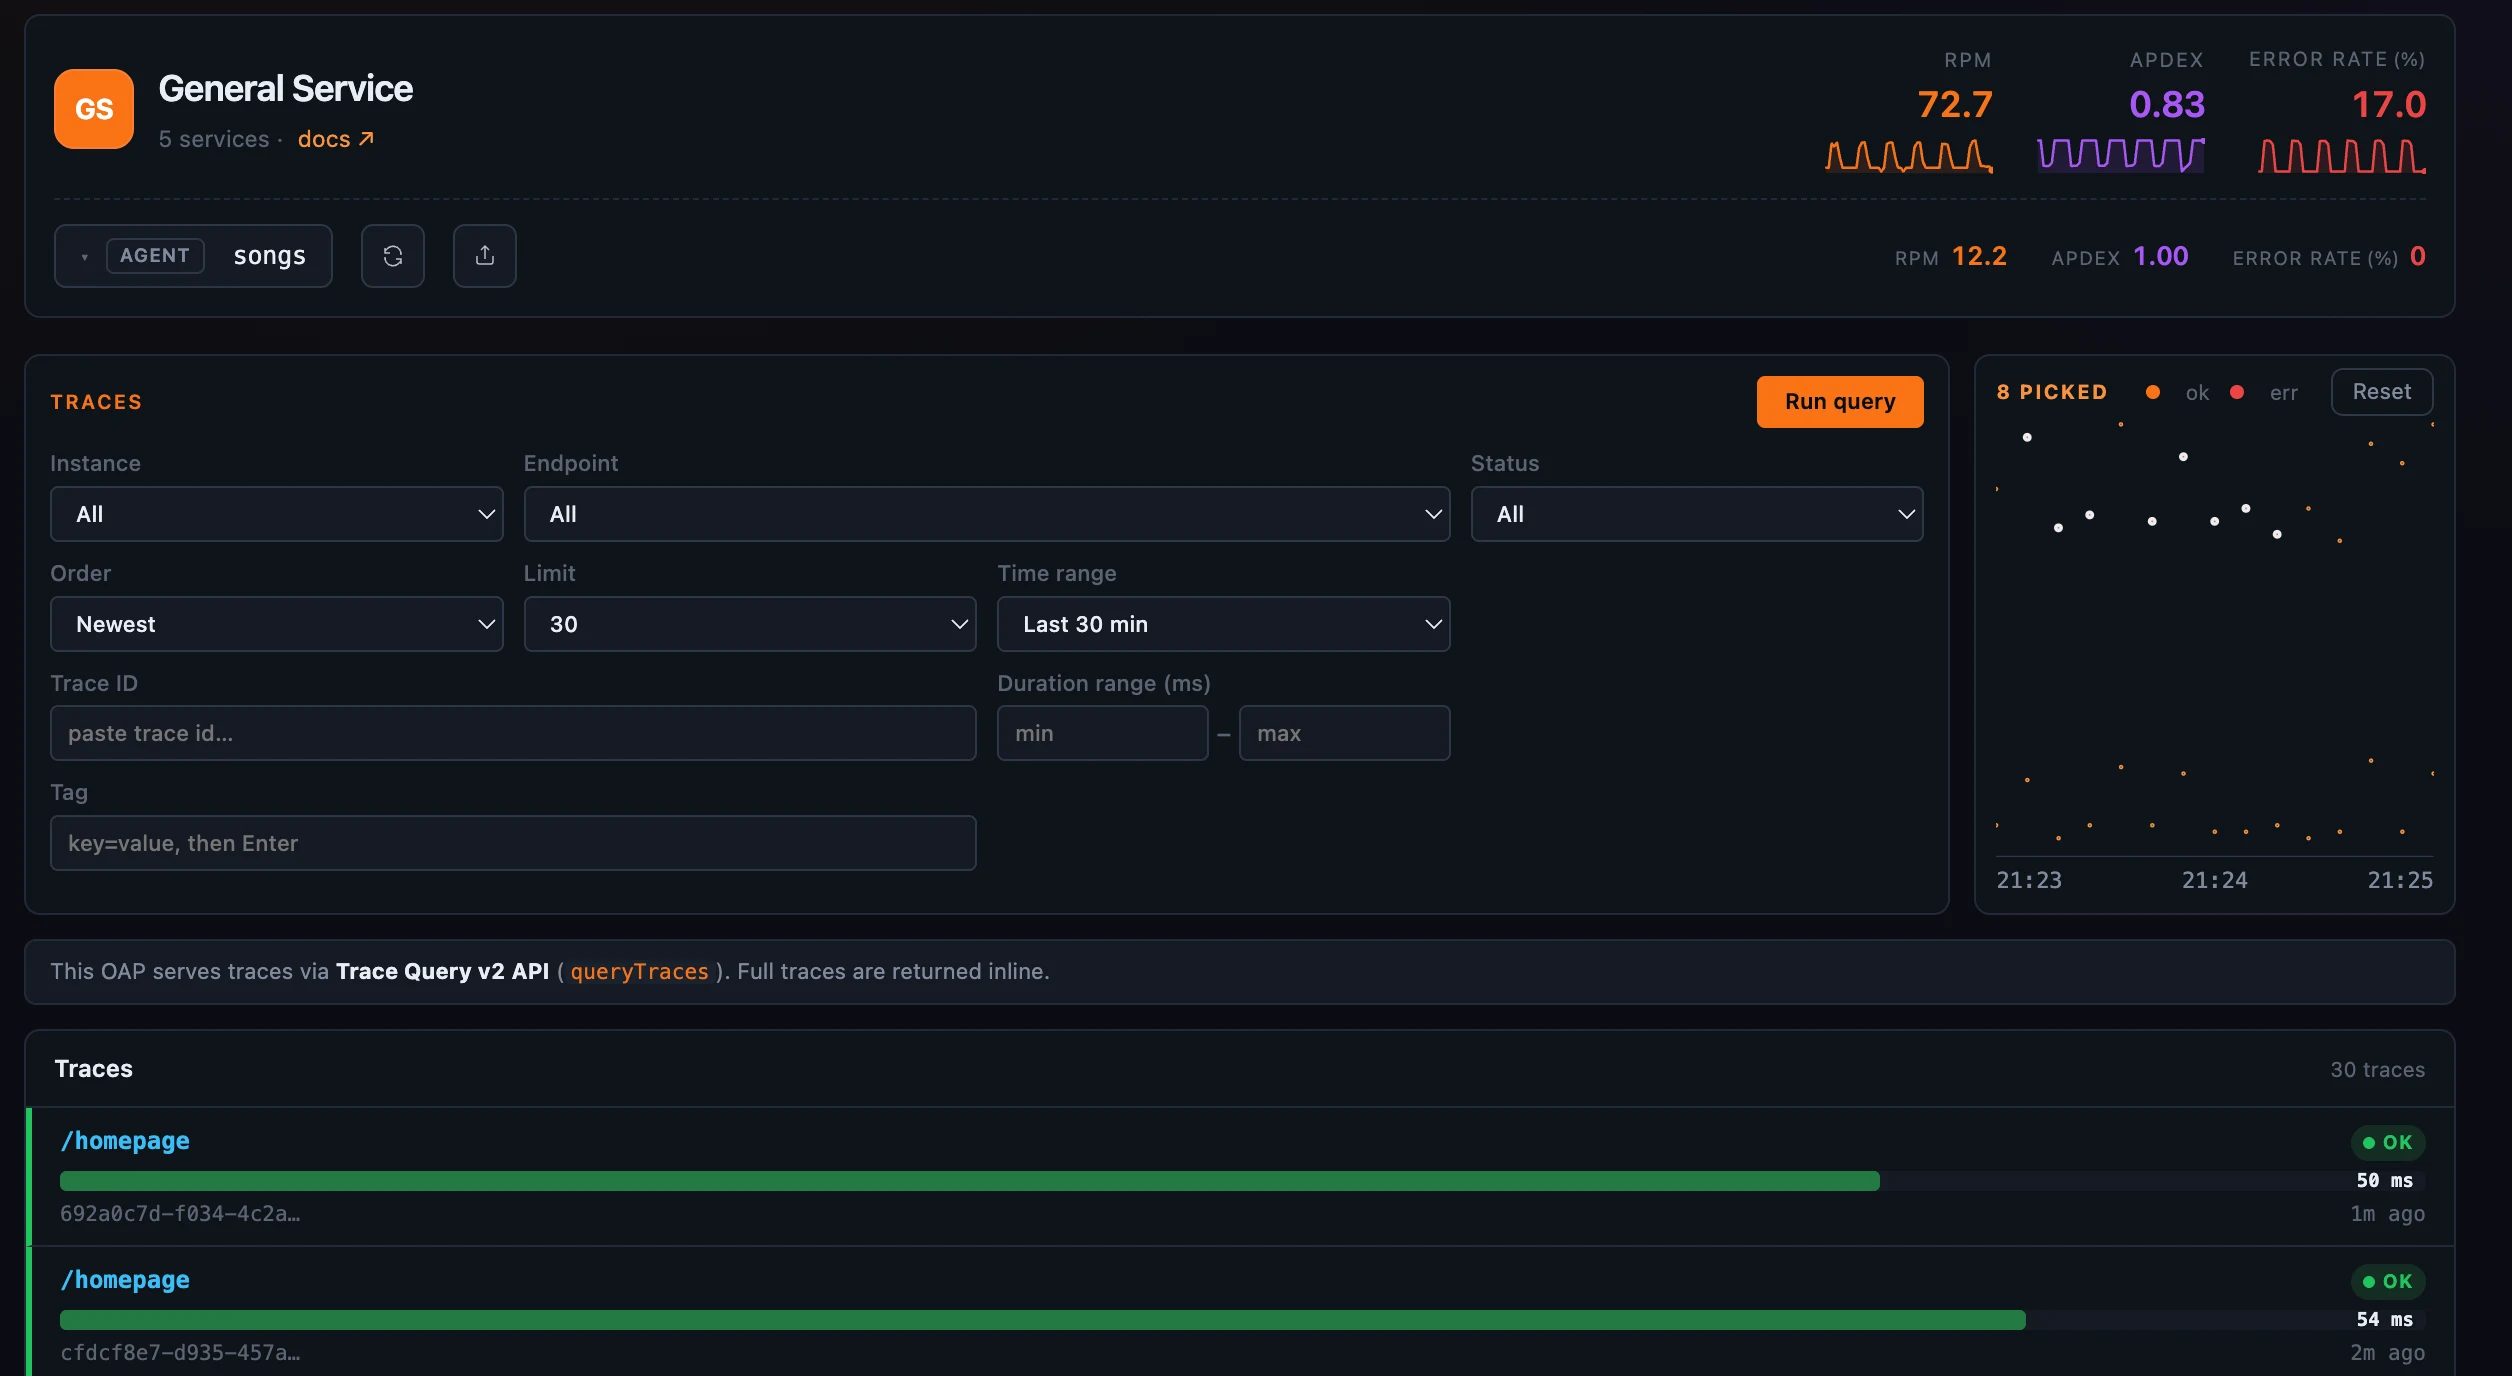
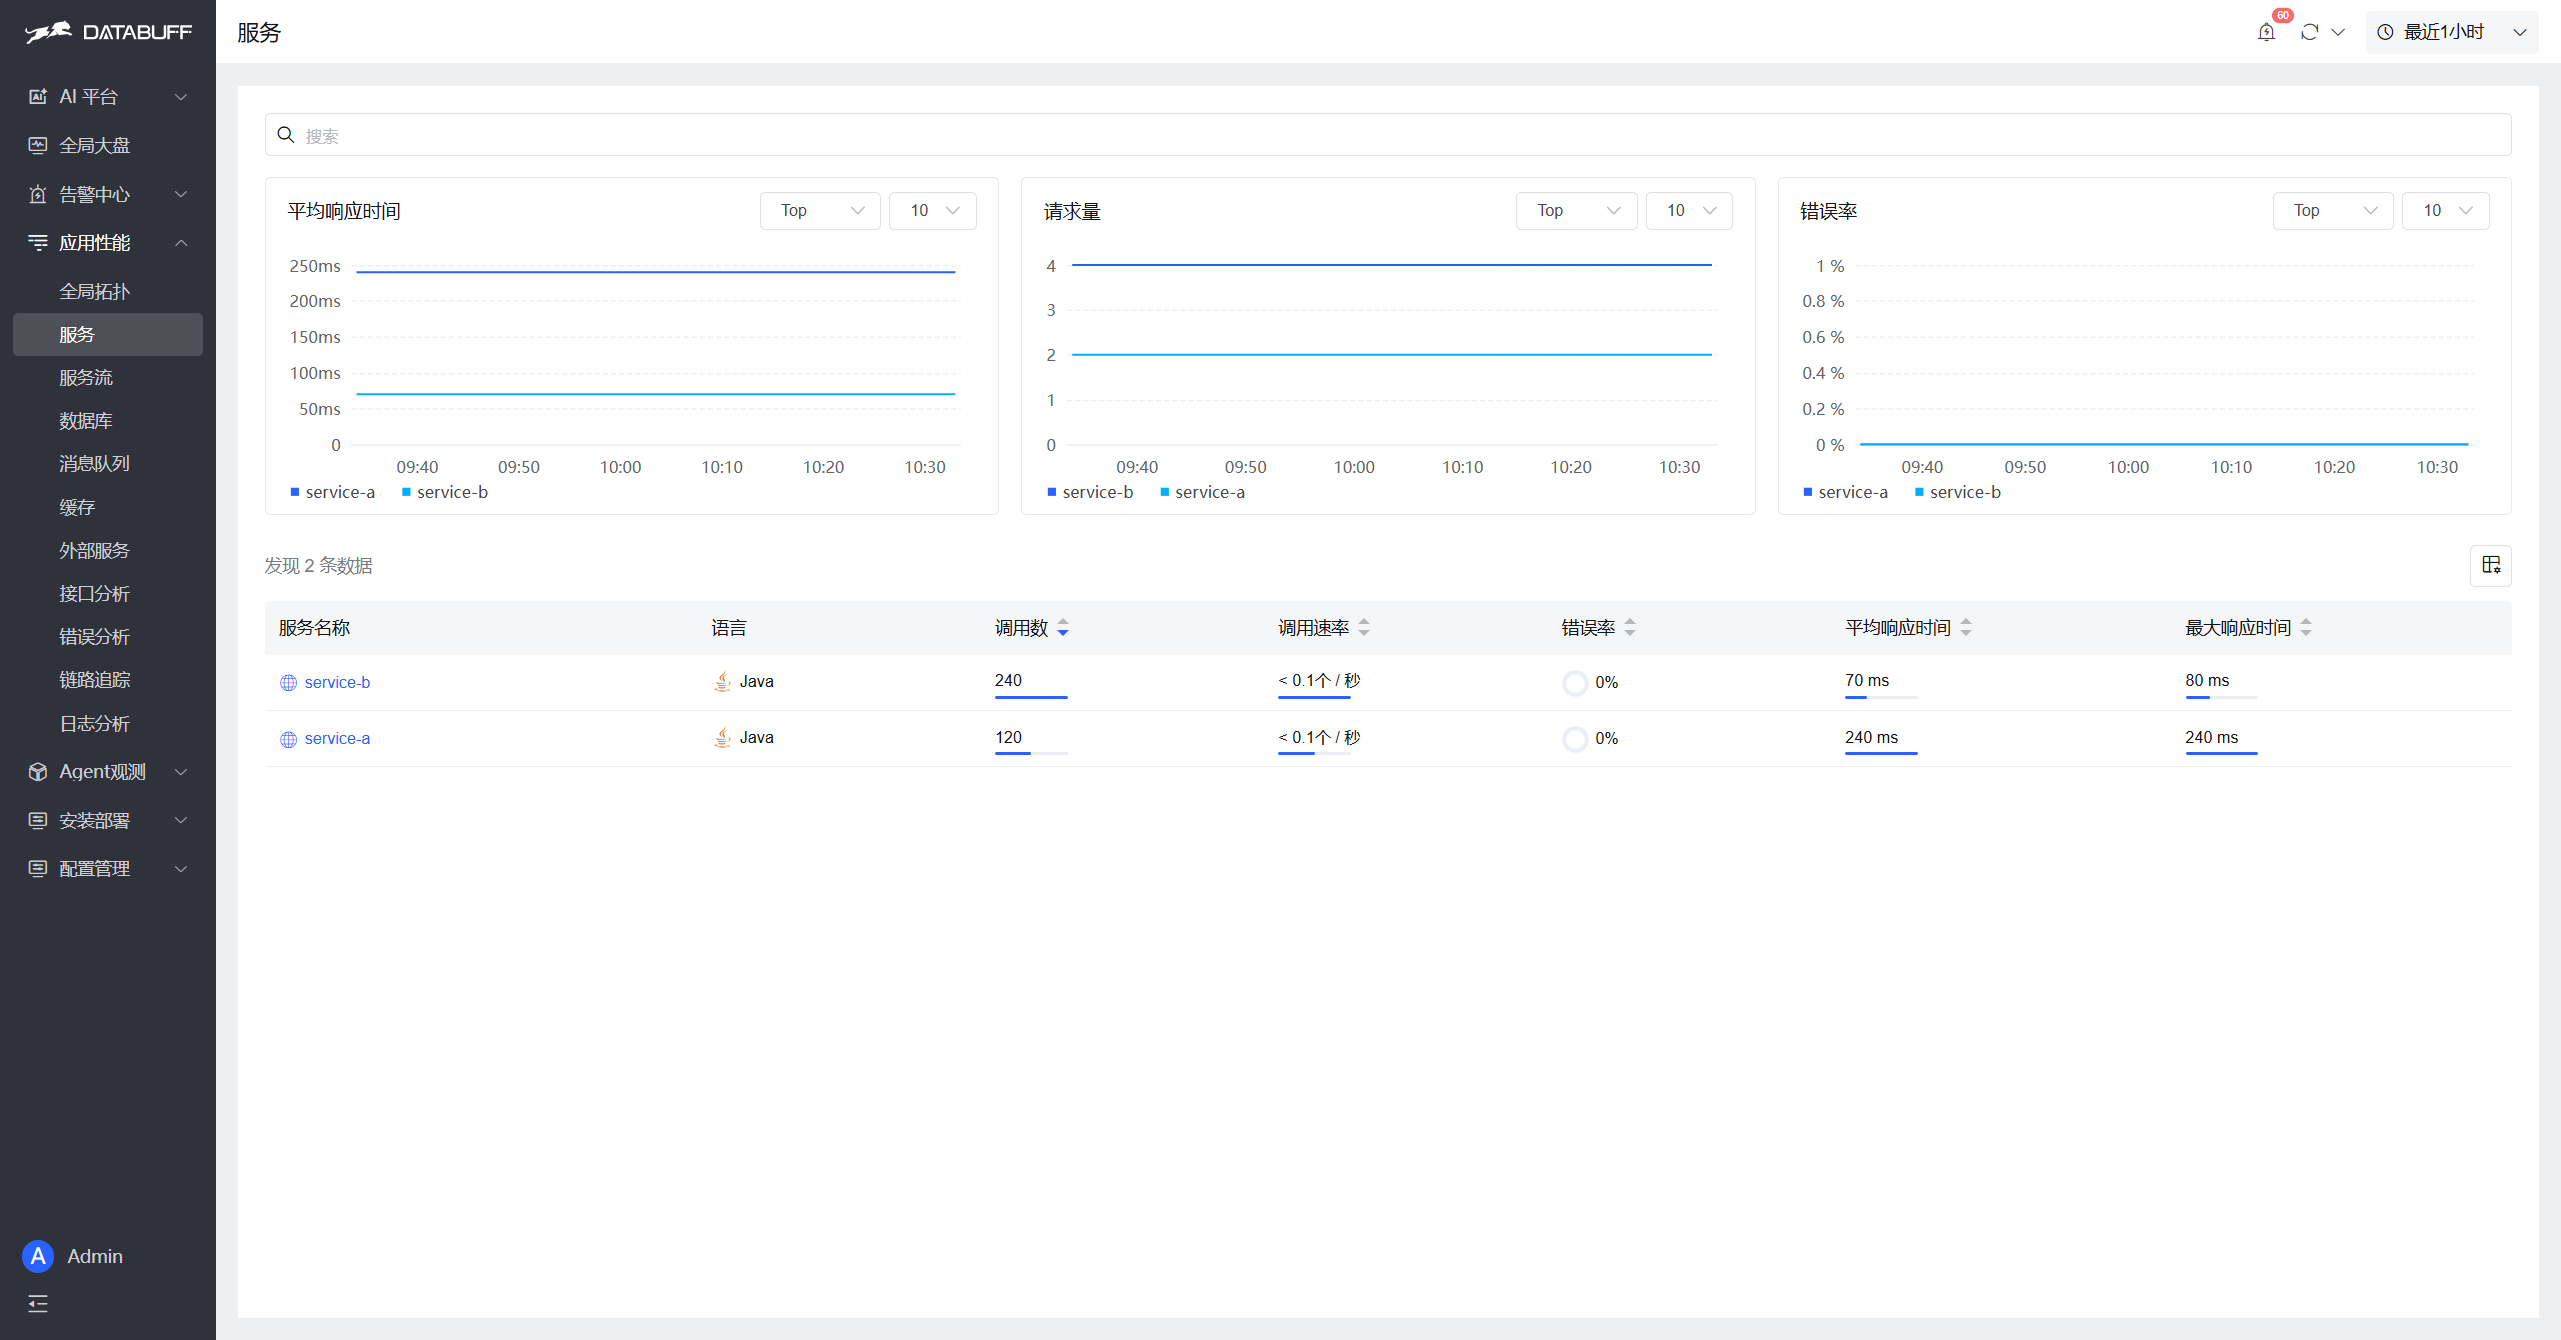
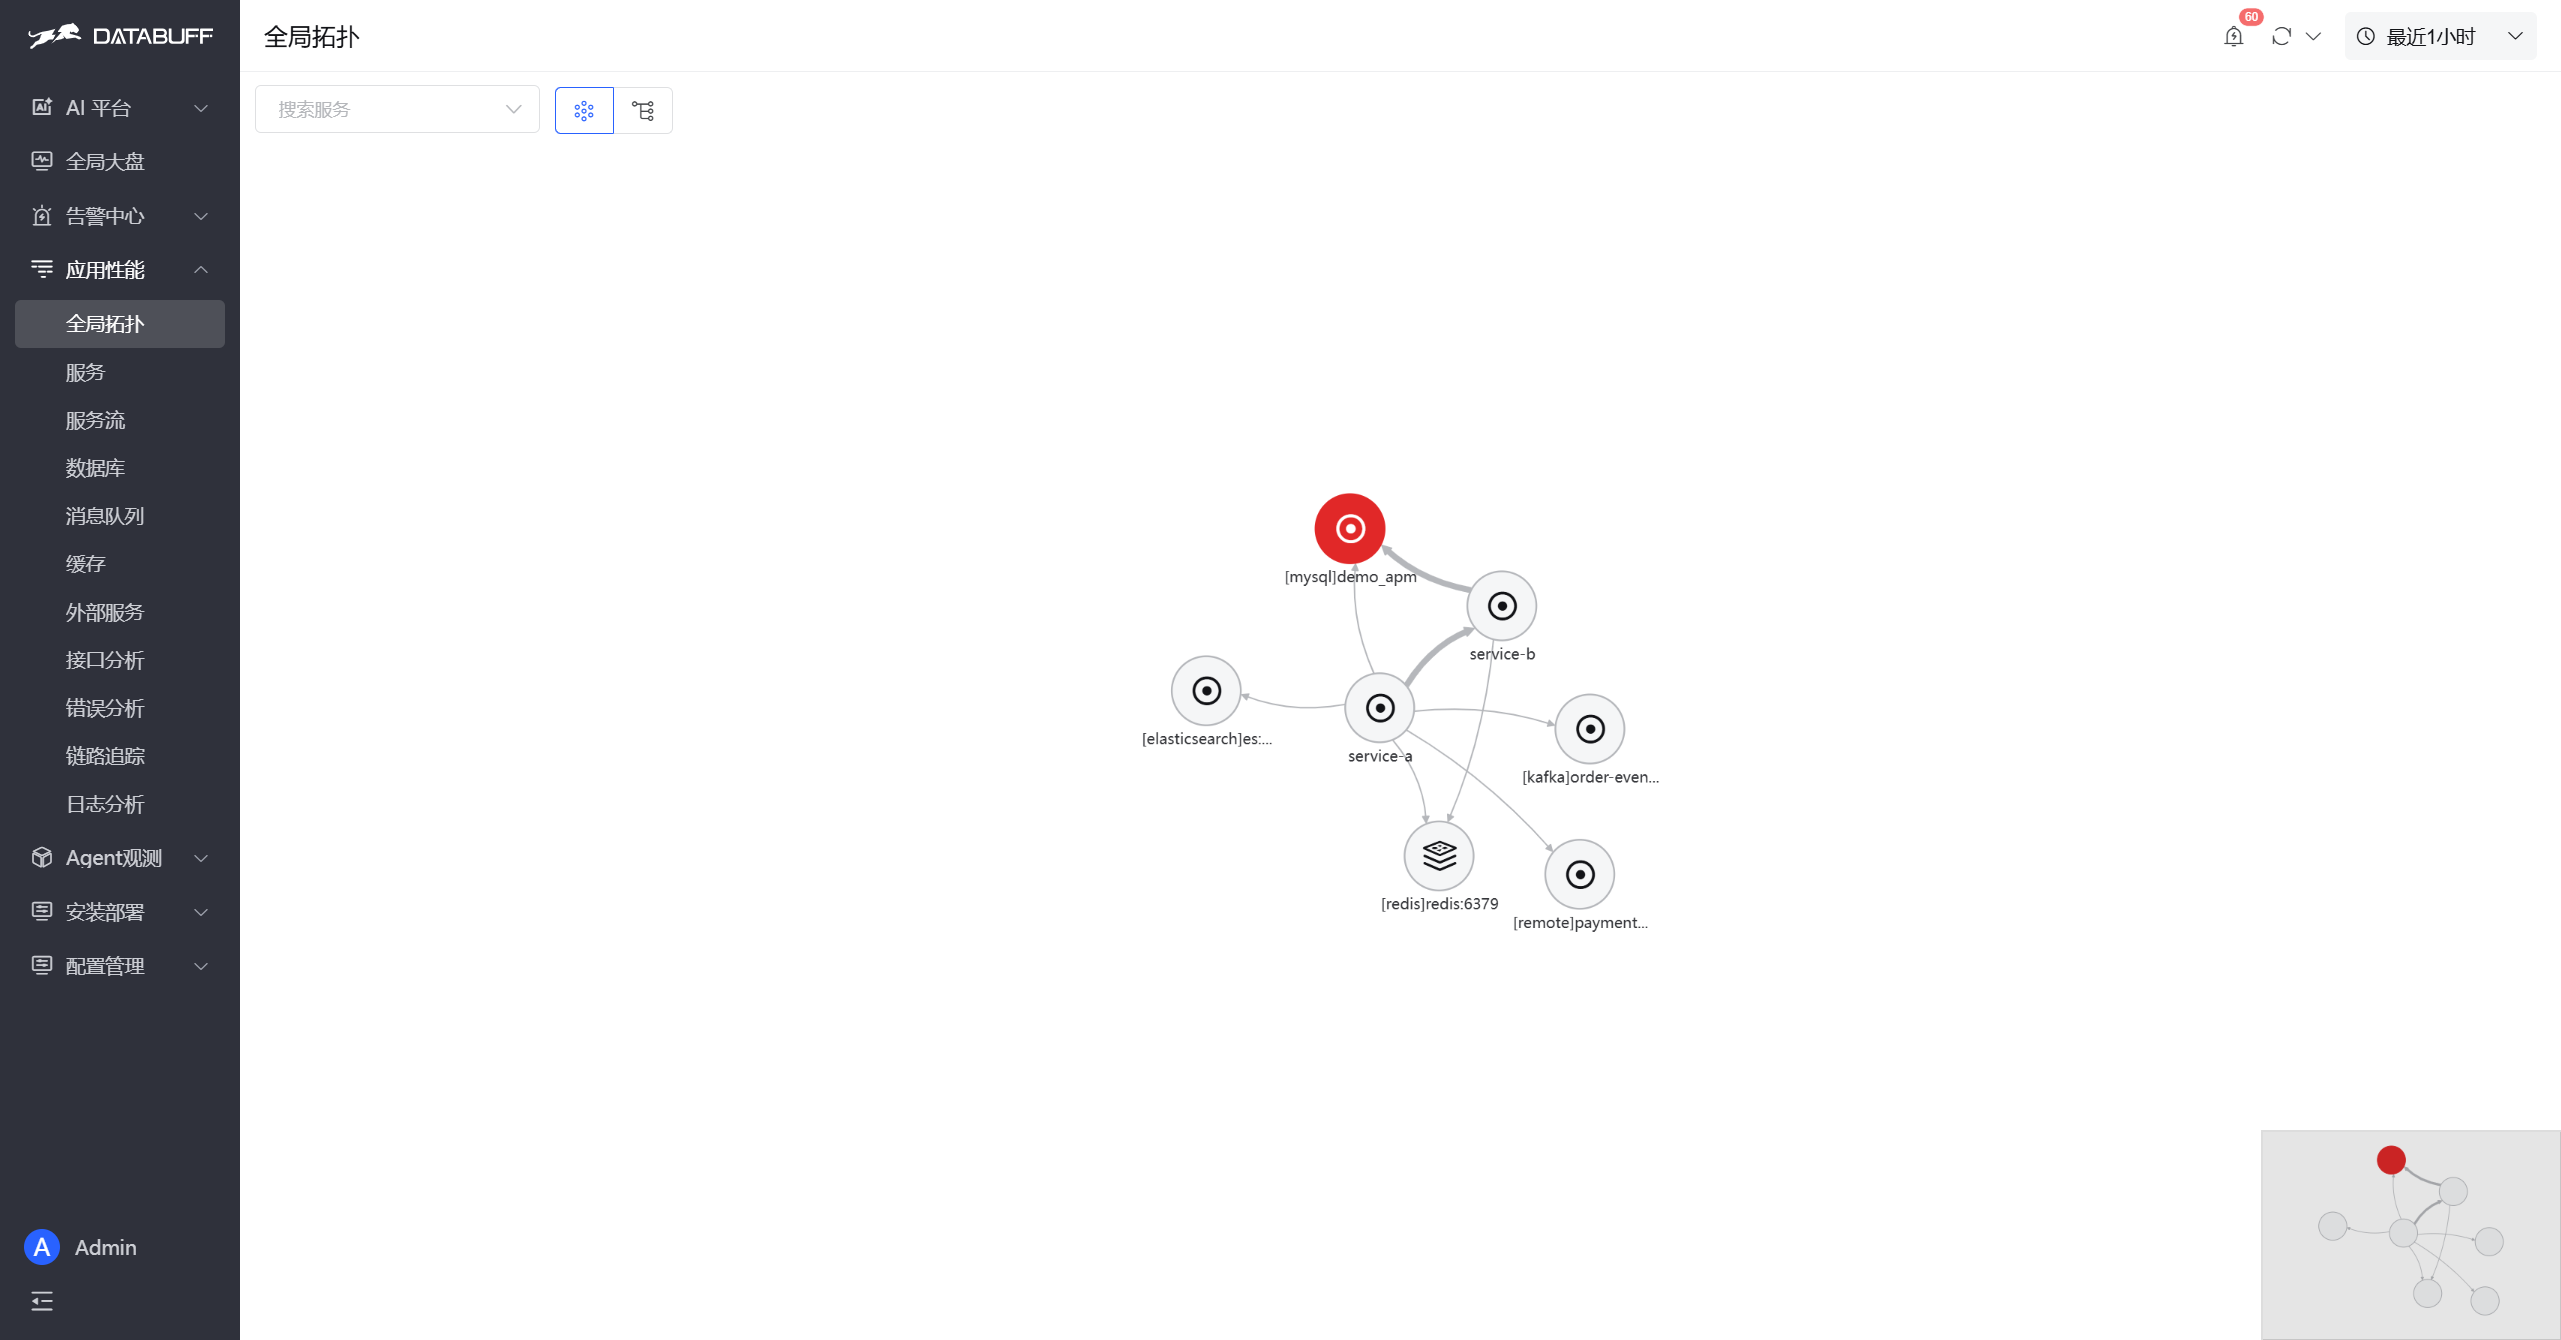
(1) Both sides see the same services and Traces. Keep Horizon topology / Trace Explorer on SkyWalking; on DataBuff, “Application Performance → Services” should show the same names. Public Demo shows Java services (e.g. service-a / service-b) with call counts, average response time, and error-rate trends—proof that Ingest digested Segments via the SkyWalking protocol. Fix one shared time window for comparison to avoid “15 minutes on one side, 1 hour on the other.”
(2) Topology gain: middleware and external deps on one screen. DataBuff global topology draws not only service nodes but MySQL, Redis, Elasticsearch, Kafka, external HTTP, and similar dependencies on the same graph, with color emphasis for unhealthy nodes. For “slow self or slow downstream,” this is more direct than service hexagons alone. Release notes on “endpoint latency breakdown” further split self time from downstream DB/Redis/MQ/HTTP—useful for cross-checking the same slow endpoint on both sides during comparison.
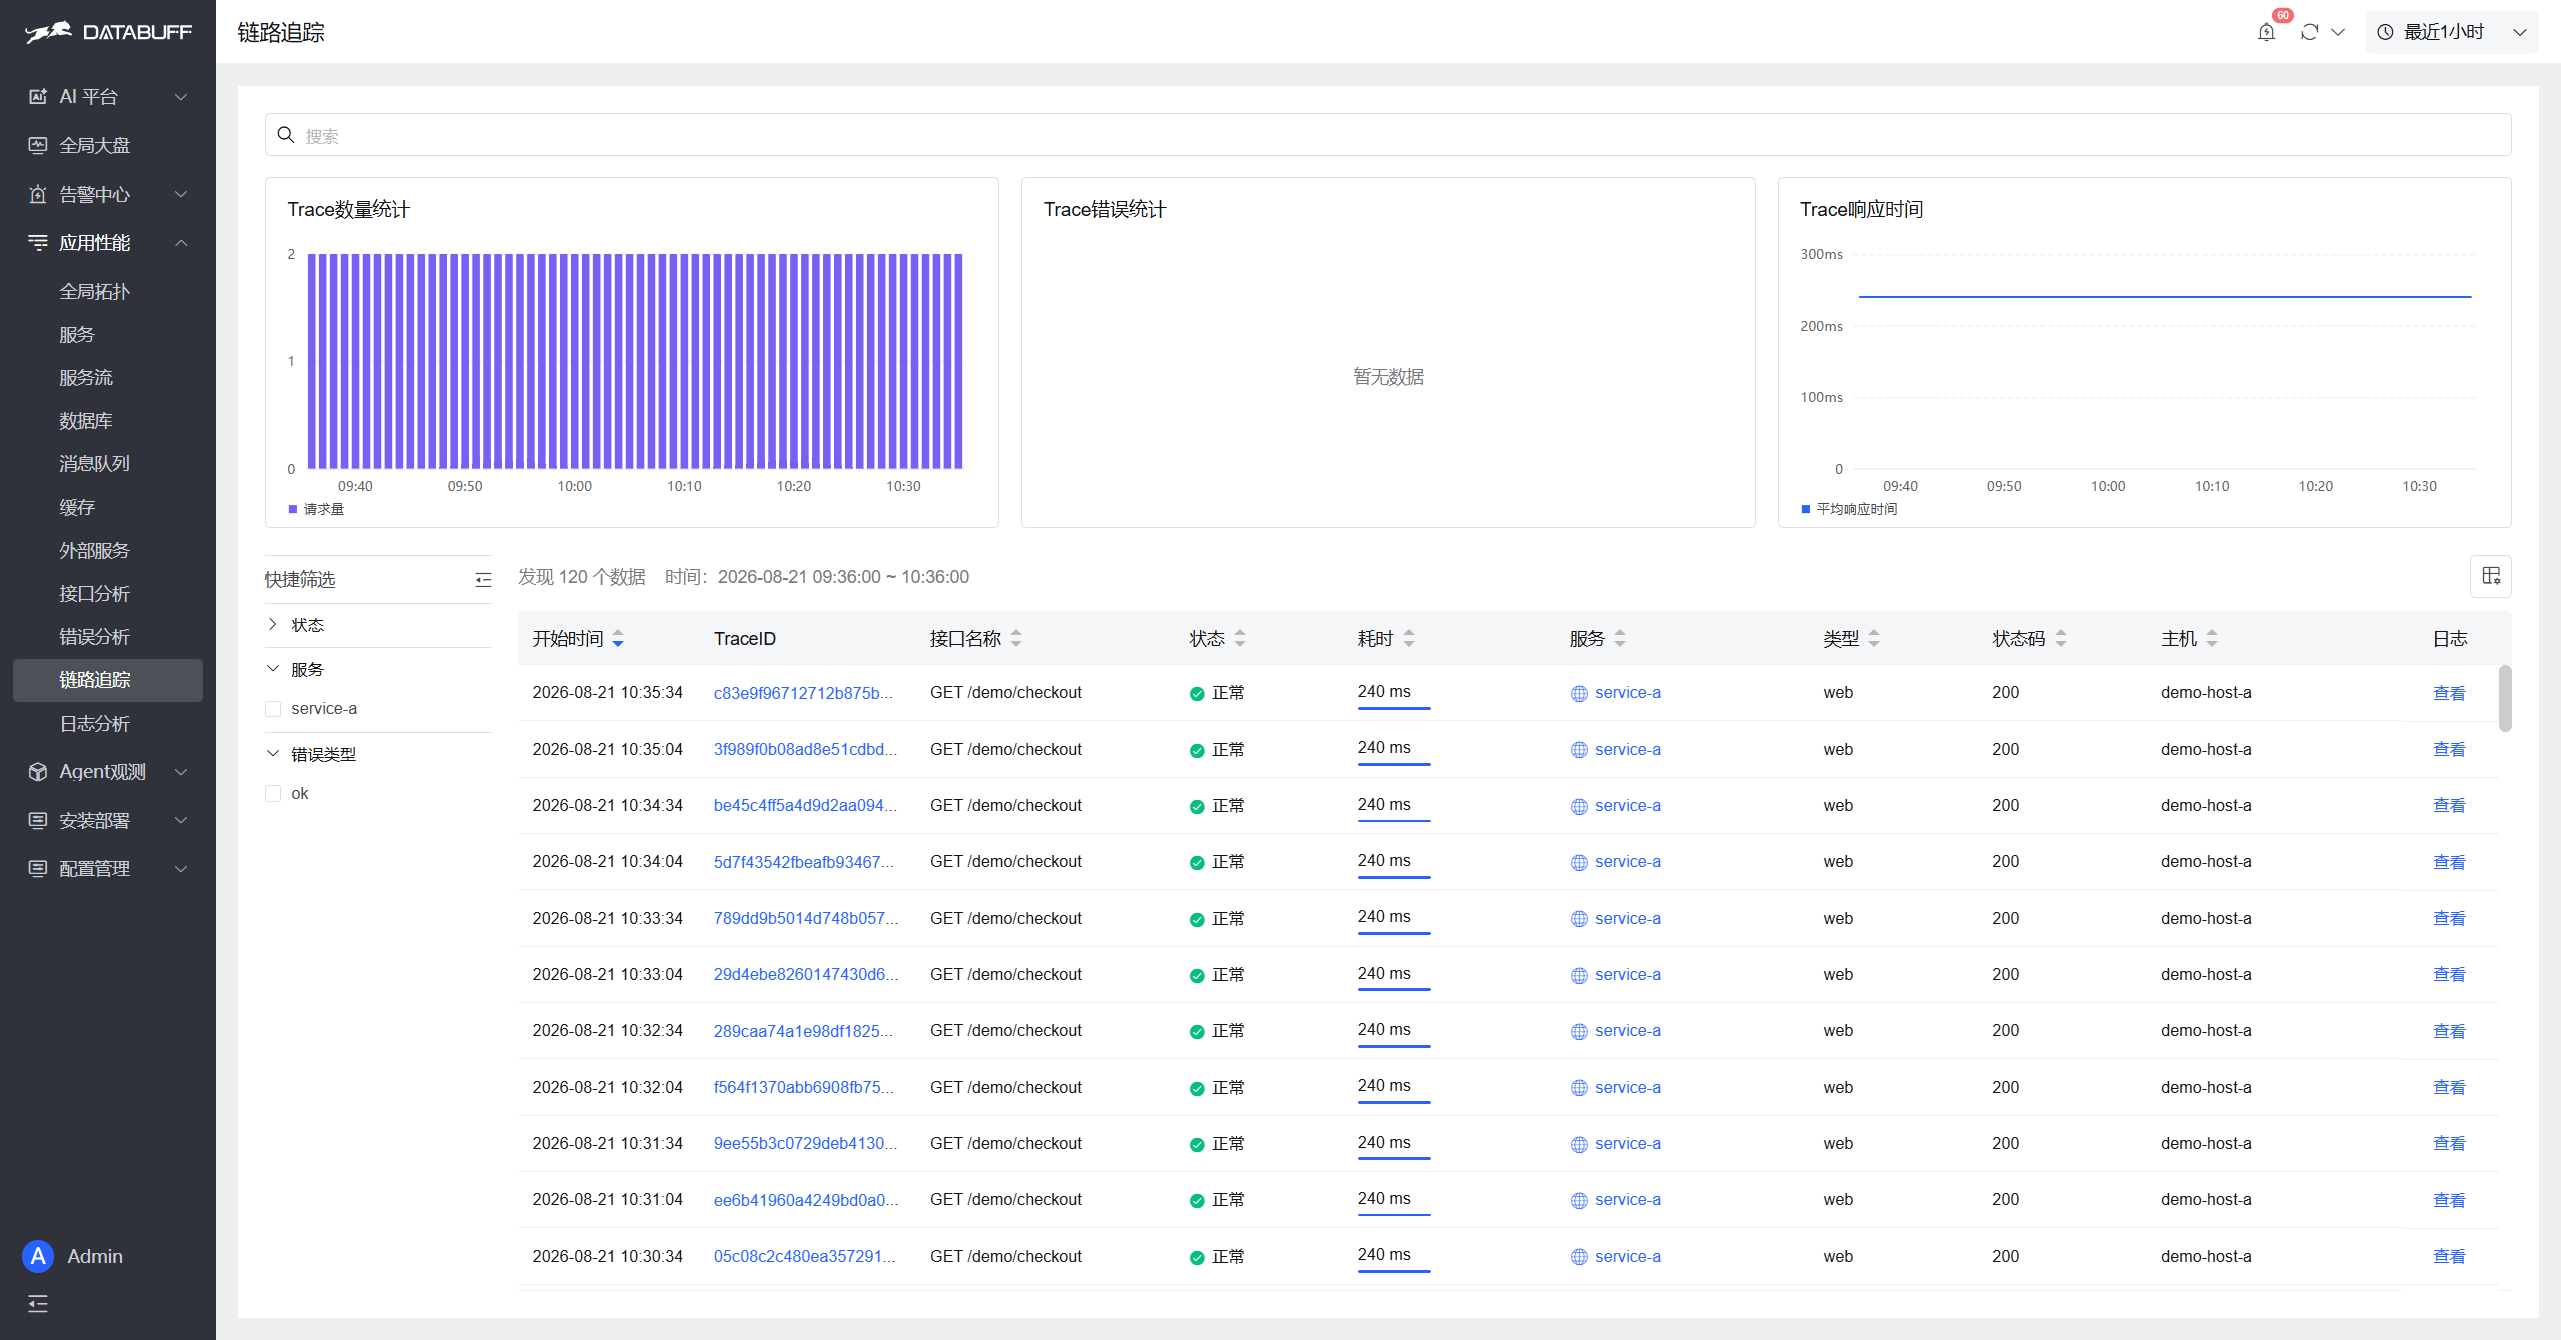
(3) Trace list and drill-down. The Trace page searches by time window, then opens waterfall / Span detail; ingest docs require confirming data.source=SkyWalking on acceptance so OTLP and SkyWalking-native ingest are not confused. If both protocols are enabled, use that field to avoid false “migration success.”
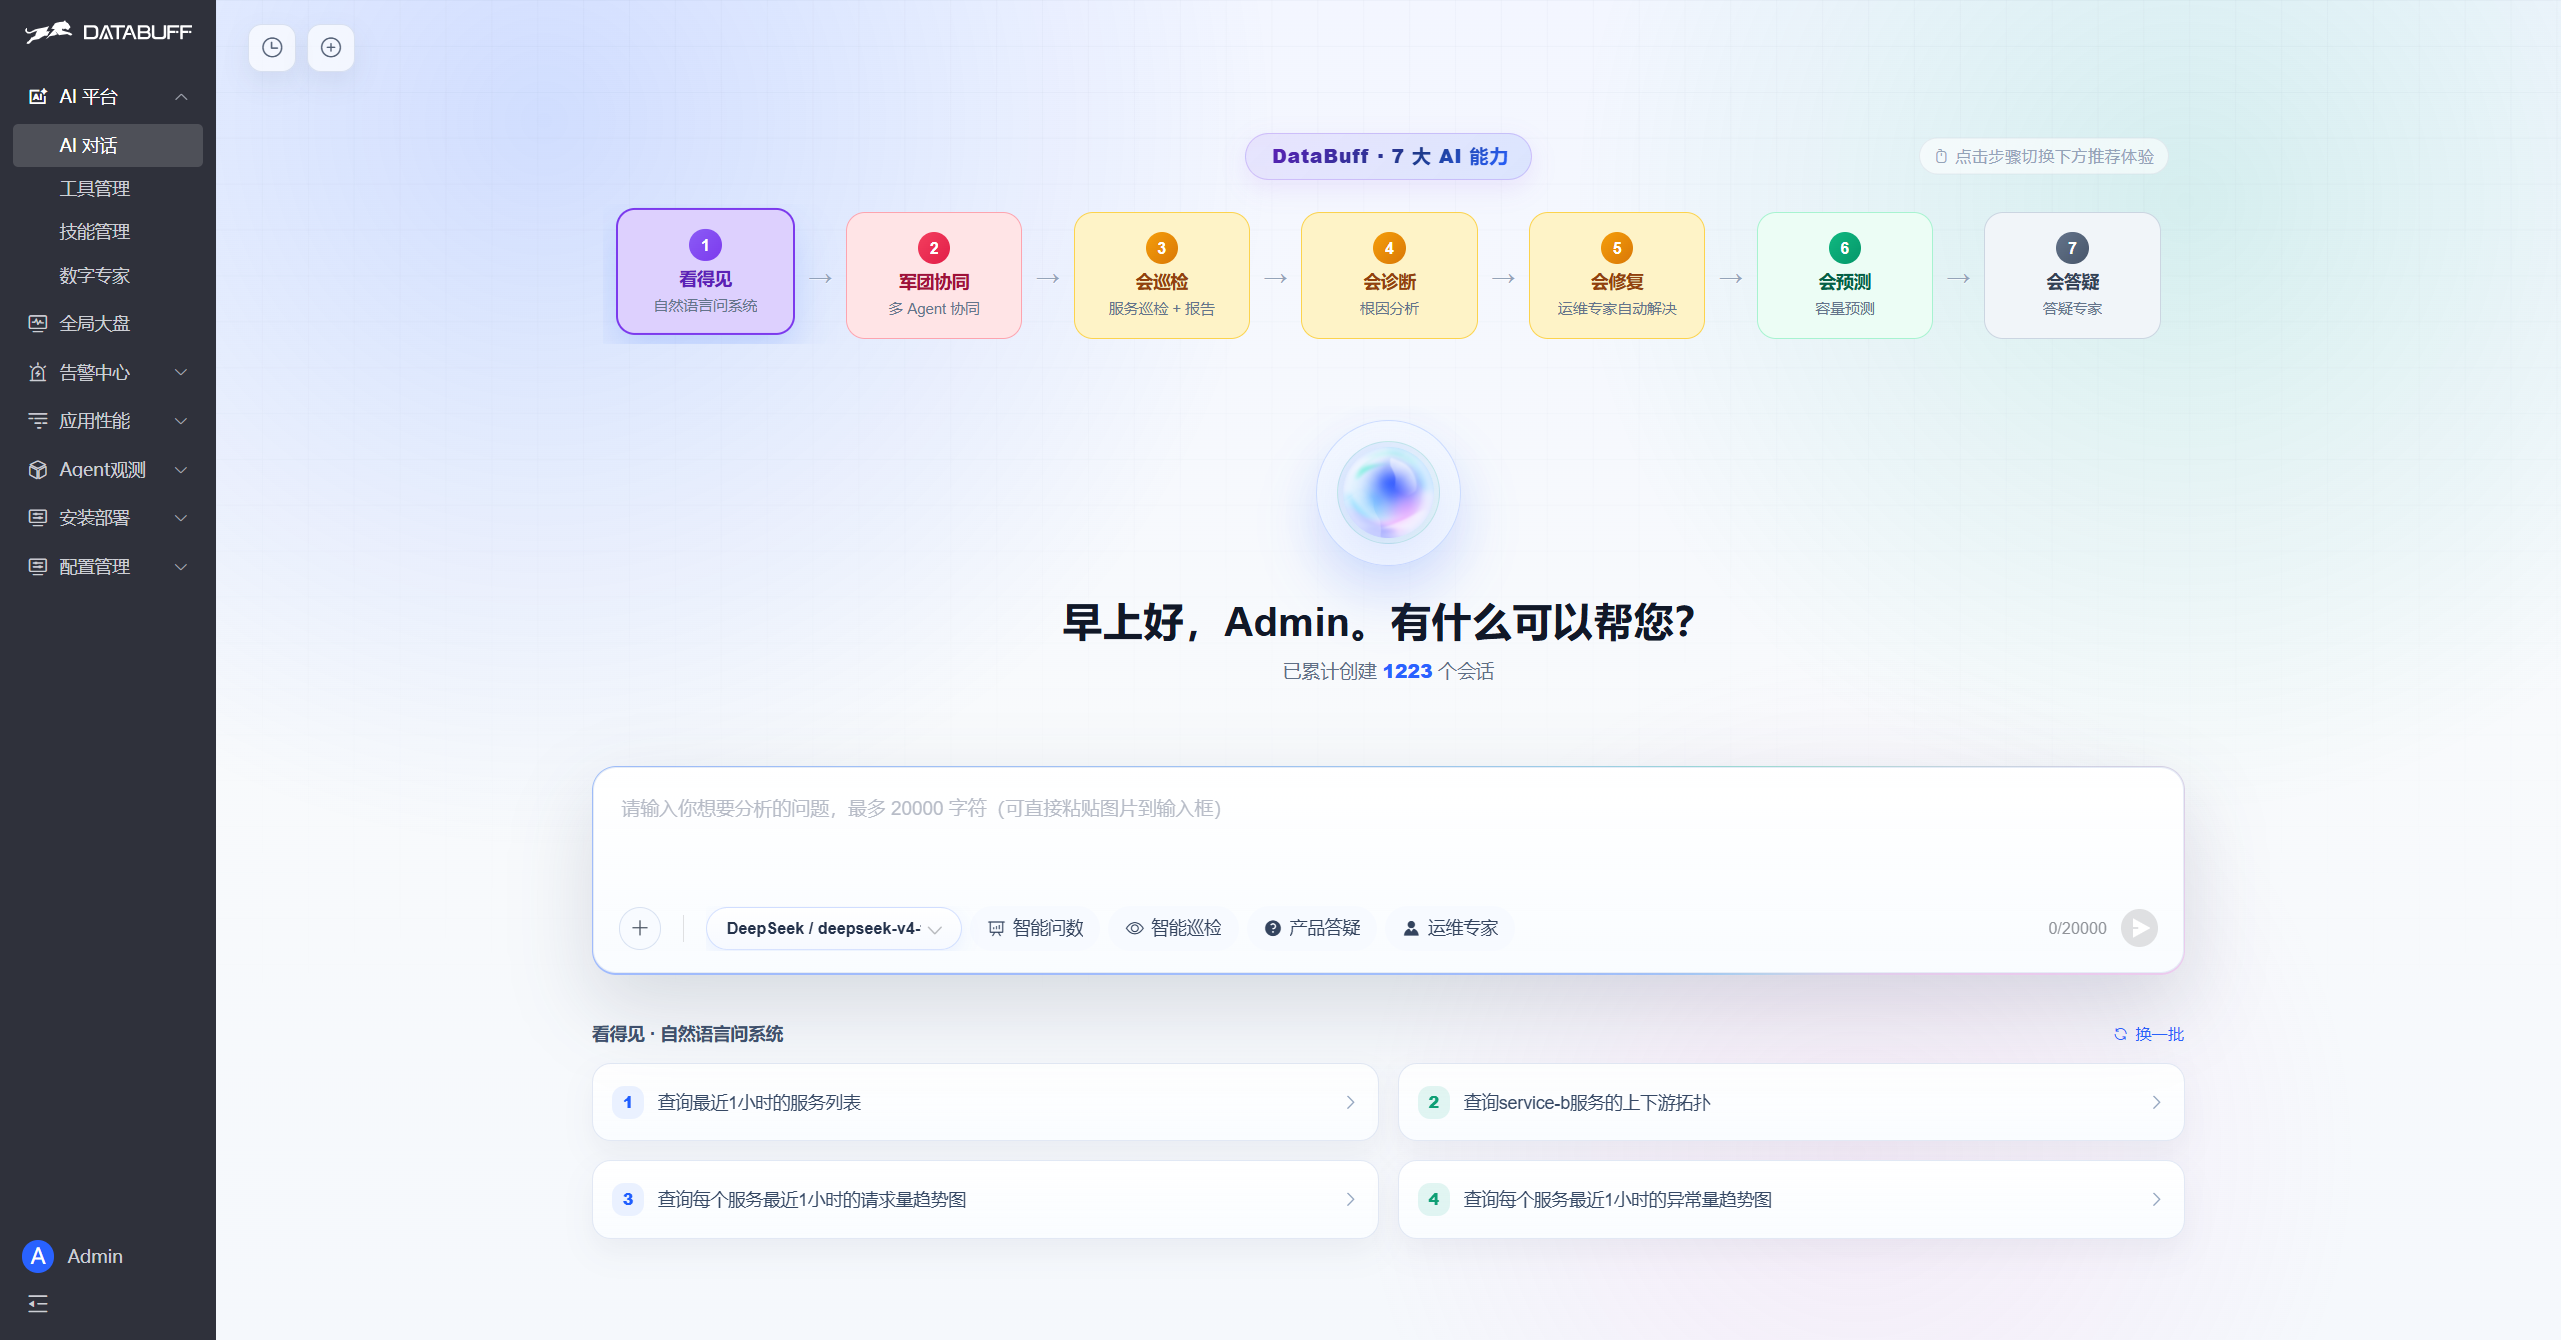
(4) Verifiable AI querying / inspection. DataBuff treats AI chat as a first-class entry: ask in natural language for the last-hour service list, a service’s upstream/downstream topology, request and error trends, and more. That matters for “keep Agents, deepen analysis”—probe layer unchanged, analysis layer gains a conversational path. Public release notes also stress that proxy dual-write lets SkyWalking users run DataBuff without changing business probes. During comparison, run an internal drill: same question via SkyWalking clicks vs DataBuff ask; record time and conclusion agreement before widening cutover.
Excerpts from public IDC and Gartner commentary place “probes + traces” in a broader buying and capability-evolution context.
Keeping SkyWalking Agents and layering a conversational, comparable analysis surface is not merely tool preference. Over the last two years, analyst language on APM / observability markets increasingly stresses two things: telemetry must support decisions, and AI must assist ops on real signals—not another disconnected black box.
4.1 IDC: observability as a decision foundation; AI reshaping ops software
In IDC’s first 2025 Worldwide Observability Platforms MarketScape study, observe and orient are called out as critical decision steps; observing digital assets therefore becomes a foundation for “scaled decision-making” in modern digital business. The research also frames observability platforms as unifying metrics, events, logs, traces, and experience-class data to accelerate troubleshooting and provide an evidence base for AI-assisted IT operations[1]. In other words, traces and metrics are no longer only an ops dashboard—they are the premise for automation and intelligent analysis that can stand up.
In the same vein, IDC’s public summaries on infrastructure software trends stress that AI capabilities are forcing change in enterprise systems management, AIOps, and observability product shapes—including AI observability evolution, AIOps moving from “noise reduction” toward broader ops decision support, and multi-agent collaboration[2]. For teams with existing SkyWalking probe assets, a pragmatic reading is: ensure Segment / topology / Trace evidence is complete first, then talk querying, inspection, or event correlation—matching the analyst narrative of “evidence-backed AI ops,” not chat first and data later.
4.2 Gartner: from APM to observability platforms to AI observability
On the Gartner side, market framing has broadened from Application Performance Monitoring toward Observability Platforms: understand application and infrastructure health and behavior from logs, metrics, events, and traces, and turn telemetry into insight and action—“traditional APM alone” is often not enough[3]. Recent Magic Quadrant / market commentary repeatedly notes that buyers evaluate full-stack observability and whether roadmaps are credible on AI observability, OpenTelemetry interoperability, and observability/governance for AI Agent workloads; they also caution that many “autonomous ops / auto-remediation” claims still outrun common adoption, while more solid capabilities today cluster around assisted investigation, event summarization, and root-cause assistance[4].
Parallel to “using AI to run apps” is “running AI itself.” Gartner’s public forecast says that by 2028, about 40% of organizations deploying AI will adopt dedicated AI observability capabilities to monitor model performance, bias, and outputs; drivers include not only infra health but risk management for complex models and agentic AI[5]. For application APM / tracing teams, that does not demand an immediate stack swap, but it hints that a single telemetry pipe (OTLP or SkyWalking-native) that can place service calls and (future) inference calls in correlatable context is closer to the evolution analysts describe.
- [1] https://my.idc.com/getdoc.jsp?containerId=US53004325
- [2] https://my.idc.com/getdoc.jsp?containerId=US53121225
- [3] https://www.gartner.com/en/documents/5663323
- [4] https://www.networkworld.com/article/4197973/ai-workloads-shake-up-observability-market.html
- [5] https://www.apmdigest.com/gartner-40-organizations-deploying-ai-will-use-ai-observability-monitor-model-performance-2028