SkyWalking Overview, Deployment, and Java Agent Installation Guide
SkyWalking · Open-Source APM · OpenTelemetry · DataBuff · Distributed Tracing
Many teams hit two walls on first contact with SkyWalking: how to start OAP and storage, and how to attach the Agent to Java processes. Below we follow understand architecture → deploy backend → install probe → compare options; commands and ports are cross-verifiable in public documentation.
1SkyWalking Project Overview and Architecture
Apache top-level open-source observability platform covering Trace / Metrics / Logs / Profiling / Event telemetry
Apache SkyWalking targets distributed and cloud-native infrastructure—collecting, analyzing, aggregating, and visualizing service telemetry. Unlike tools that "only do tracing," it covers five signal types on one platform:
Tracing: native Segment format, Zipkin v1/v2 compatible Metrics: native Meter, OTel Metrics, Telegraf; integrates with Istio/Envoy Service Mesh Logging: disk or network collection; Agent can auto-bind Trace context Profiling: language agents and standalone eBPF agent for code-level performance analysis Event: records releases, config changes, and other key events linked to metrics/traces for troubleshooting
1.1 Logical four-layer architecture
Official documentation divides SkyWalking into four logical segments:
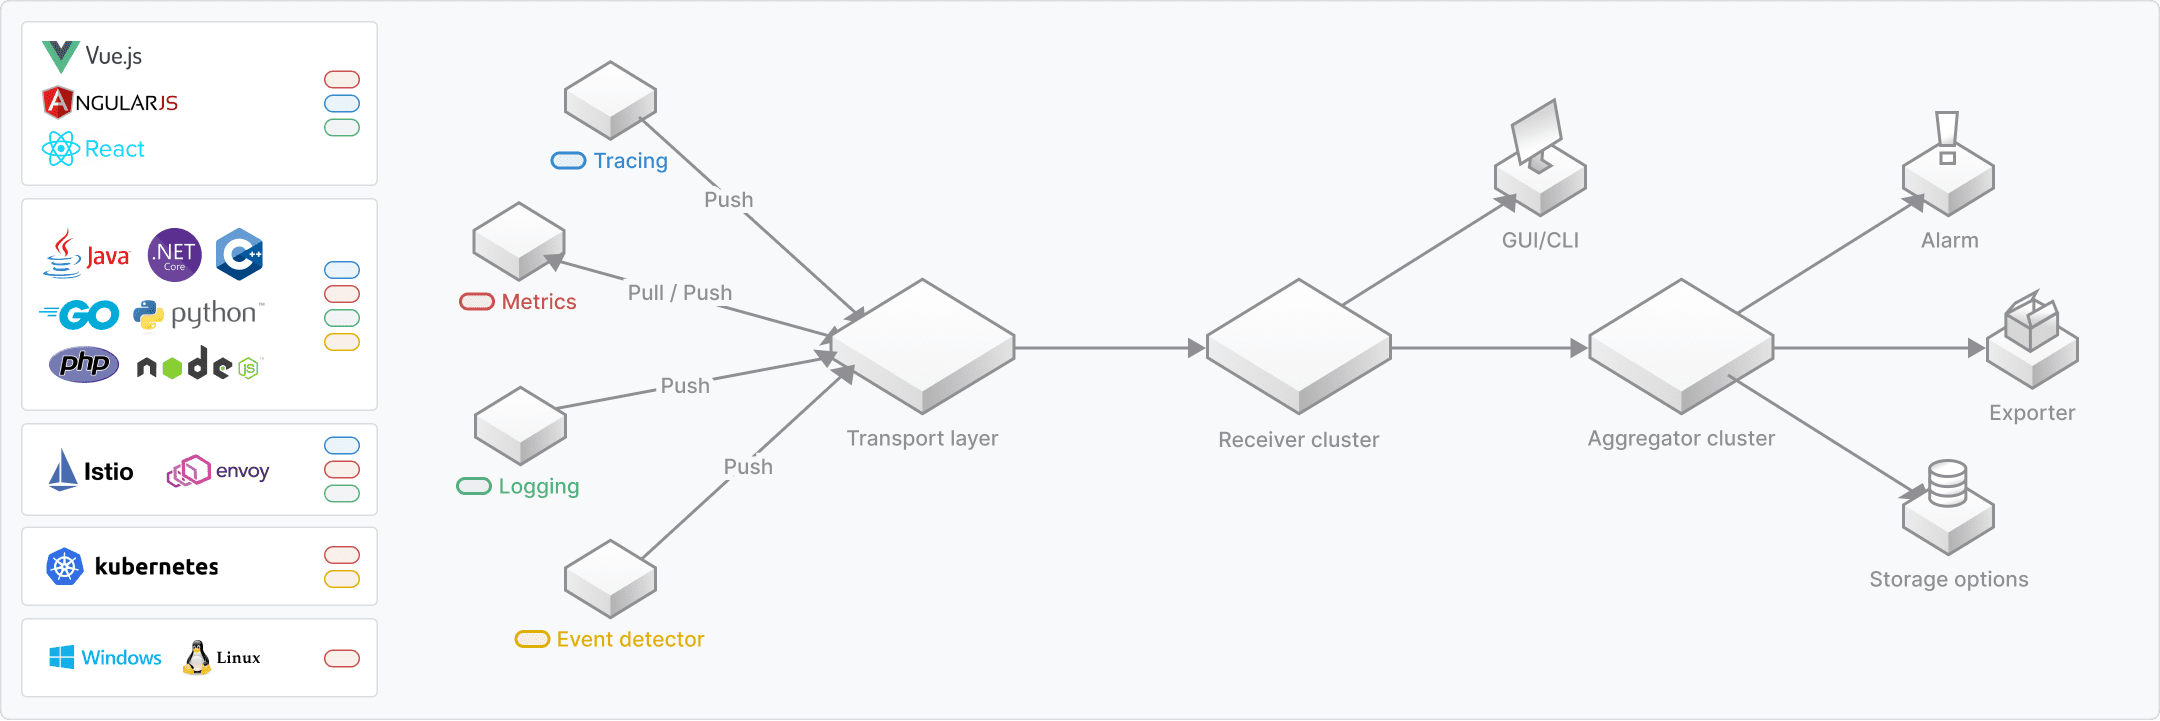
Figure 1-1 · Probes collect multi-protocol telemetry; OAP handles analysis and aggregation; Storage is pluggable; UI provides the visualization console.
Figure 1-1 · Probes collect multi-protocol telemetry; OAP handles analysis and aggregation; Storage is pluggable; UI provides the visualization console.
1.2 Core data model
SkyWalking describes observability objects as Service → Service Instance → Endpoint → Process. A Service is a group of workloads providing the same behavior; an Instance is a single instance under a Service (in Java Agent scenarios, typically one OS process); an Endpoint is an entry path such as an HTTP URI or gRPC method signature. Across K8s, Mesh, OS, and other layers, Service Hierarchy links views of the same logical service at different levels.
Probe forms: Beyond Java/C#/Go/Node.js/PHP/Python language agents, SkyWalking supports Service Mesh receivers, eBPF K8s monitoring, and third-party formats including OpenTelemetry, Prometheus, and Zipkin—suited to a gradual path where legacy agents and new OTel data coexist.
◆ ◆ ◆
2SkyWalking Backend Deployment
Docker Quick Start for fast evaluation; production needs separate Storage cluster and OAP horizontal scaling plans
2.1 Official Docker Quick Start
SkyWalking provides a one-click script that interactively selects Elasticsearch or BanyanDB as storage and starts OAP + Booster UI.
Linux / macOS / WSL:
Windows PowerShell:
After the script completes, typical ports are:
Agent / gRPC reporting: 11800 (OAP default collector port) OAP HTTP REST: 12800 Booster UI: 8080 (browser console access)
Tear down the environment:
2.2 Compose configs in the source repository
To customize image versions or storage, use profiles in the official repository:
You can also run OAP alone and point it at a storage backend, e.g. BanyanDB:
Ops note: Production commonly runs "OAP cluster + ES/OpenSearch or BanyanDB cluster + UI." Storage choice directly affects disk cost and Trace query latency; 10.x deepens BanyanDB integration—worth evaluating for greenfield projects.
◆ ◆ ◆
3SkyWalking Java Agent Installation and Configuration
Bytecode enhancement, non-intrusive integration; JDK 8–25 supported
3.1 Obtain the Agent package
From the Apache SkyWalking Java Agent release, extract the agent/ directory. Core file: skywalking-agent.jar; plugins in plugins/; config in config/agent.config.
3.2 Key configuration items
Edit agent.config (or override via environment variables):
In Docker Compose or K8s, environment variables match official e2e examples:
3.3 Attach to the JVM
Executable JAR:
Tomcat (first line of catalina.sh):
Note: -javaagent must appear before -jar. After startup, wait tens of seconds; the corresponding Service should appear in the UI "General Service" topology.
3.4 Plugins and optional capabilities
Plugins under plugins/ are enabled by default; remove a jar to disable a middleware probe (Dubbo, Feign, HttpClient, JDBC, etc.). Optional plugins live in optional-plugins/—copy into plugins/ to activate. For ZGC JRE, OAP 9.7.0+ is required for compatibility.
◆ ◆ ◆
4DataBuff Project Overview, Architecture, and AI Chat
Open source AI-native OpenTelemetry APM · Minimal three-component stack
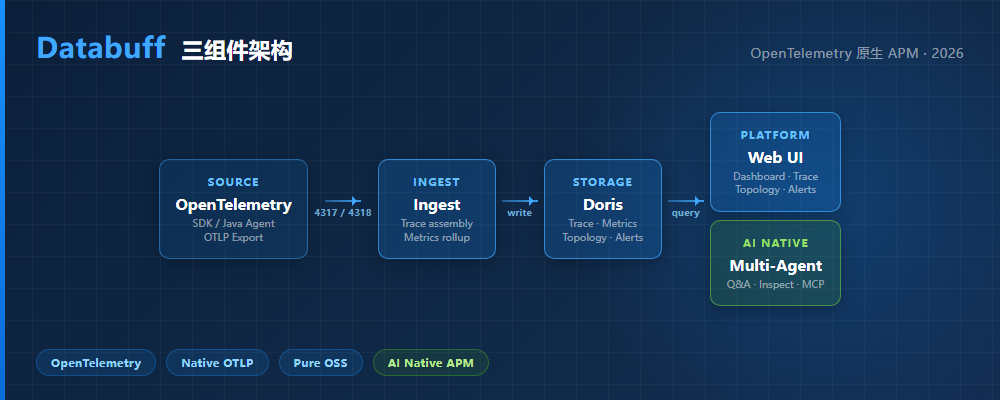
Figure 4-1 · DataBuff three-component architecture: OTel ingestion into Ingest, Doris unified storage, Web platform for APM UI and AI multi-agent layer.
Figure 4-1 · DataBuff three-component architecture: OTel ingestion into Ingest, Doris unified storage, Web platform for APM UI and AI multi-agent layer.
4.1 Positioning and architecture
DataBuff is an open-source APM built for the OpenTelemetry standard: it accepts OTLP Trace and Metrics by default and provides query, alerting, and AI-assisted troubleshooting on unified storage. DataBuff is listed on the opentelemetry.io official Vendors ecosystem page, marked Native OTLP for native telemetry consumption—verifiable on the OpenTelemetry site. The product summarizes as three layers:
Compared with SkyWalking's four-layer stack, DataBuff consolidates analysis engine + storage + query into Ingest + Doris + Web. One install script brings up a Docker Demo in minutes:
After install, the terminal prints the Web UI address (default 27403) and OTLP endpoint (e.g. 4318/v1/traces).
Applications use standard OTel environment variables—no proprietary Agent protocol:
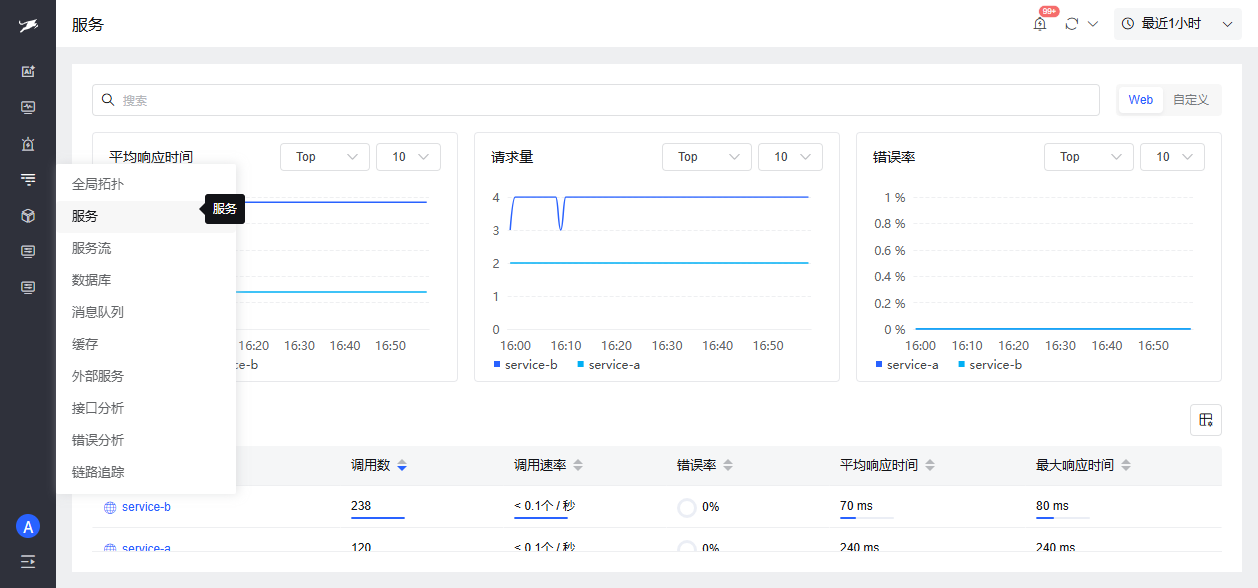
Figure 4-2 · After OTel ingestion, the service list shows QPS, error rate, P95, and other RED metrics—comparable to SkyWalking UI Service view.
Figure 4-2 · After OTel ingestion, the service list shows QPS, error rate, P95, and other RED metrics—comparable to SkyWalking UI Service view.
4.2 AI chat capabilities
DataBuff AI is not a bolt-on chat window—it reads APM storage directly: Brain parses intent and dispatches Query, Inspection, and other experts; the Tool layer queries metrics, Traces, topology, and alerts. The platform also supports MCP to register external tools with digital experts.
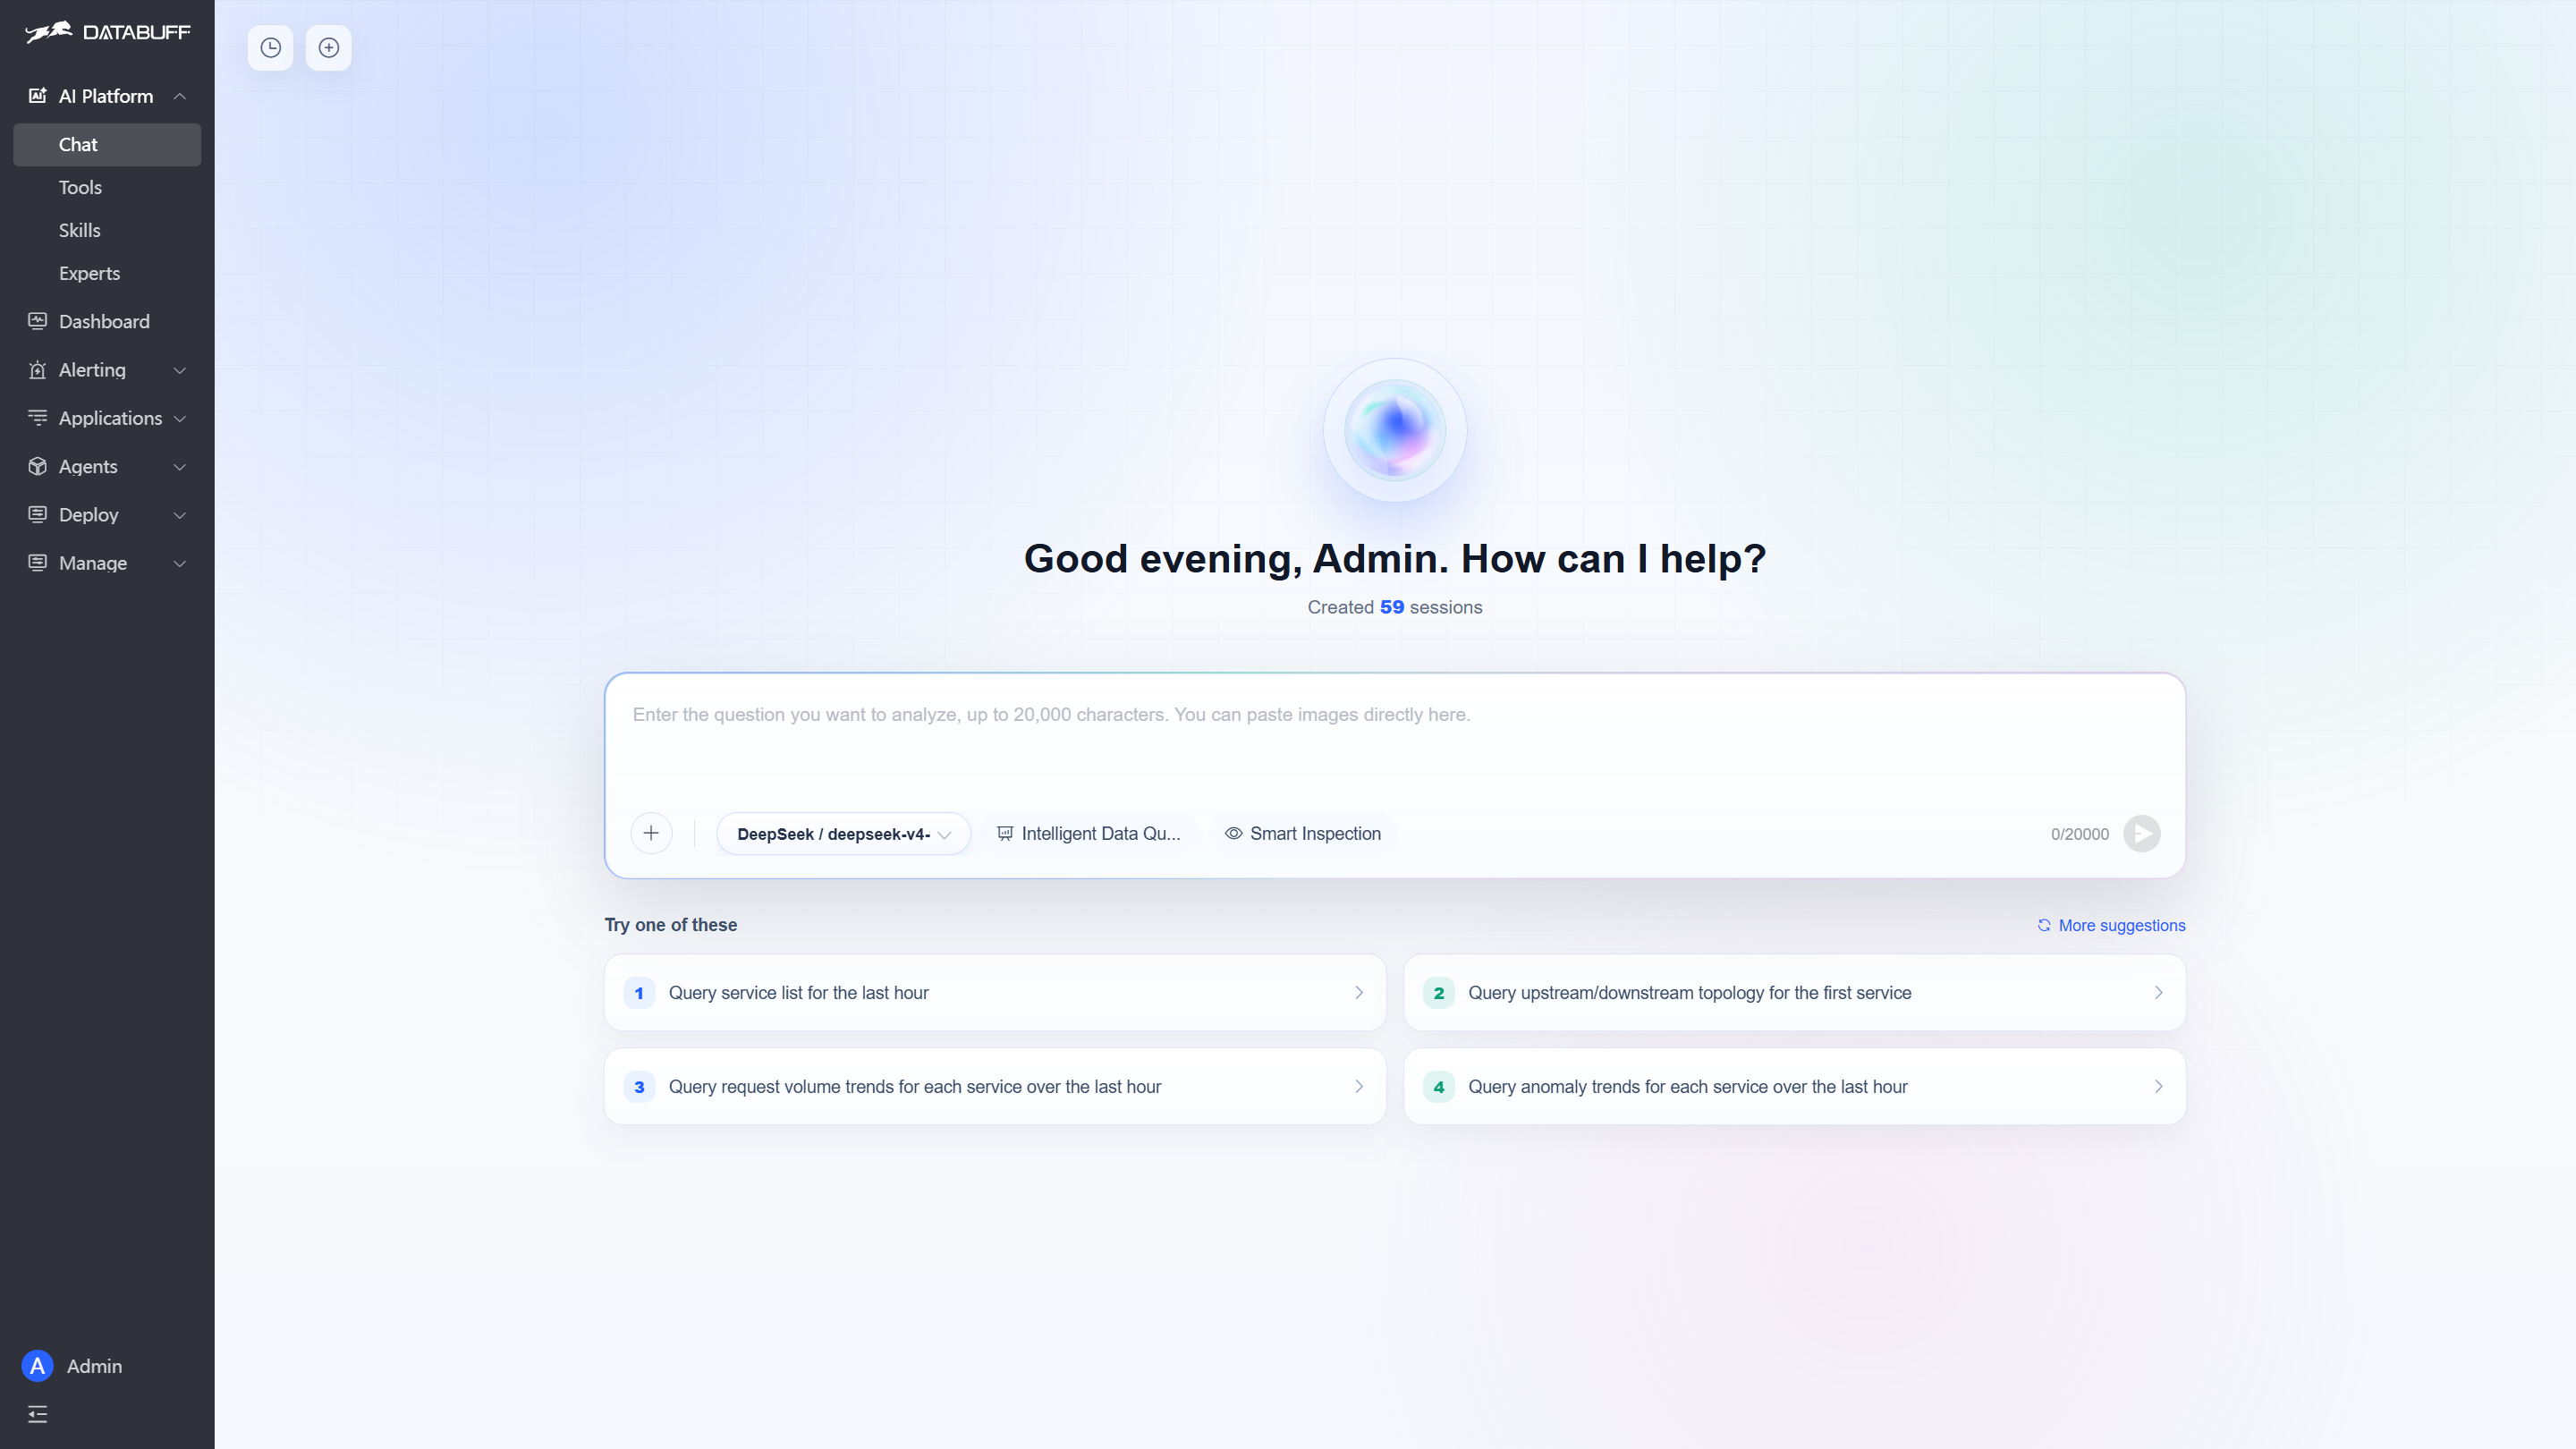
Figure 4-3 · AI platform offers Smart Q&A and Smart Inspection modes with one-click prompts for listing services, topology, and trends.
Figure 4-3 · AI platform offers Smart Q&A and Smart Inspection modes with one-click prompts for listing services, topology, and trends.
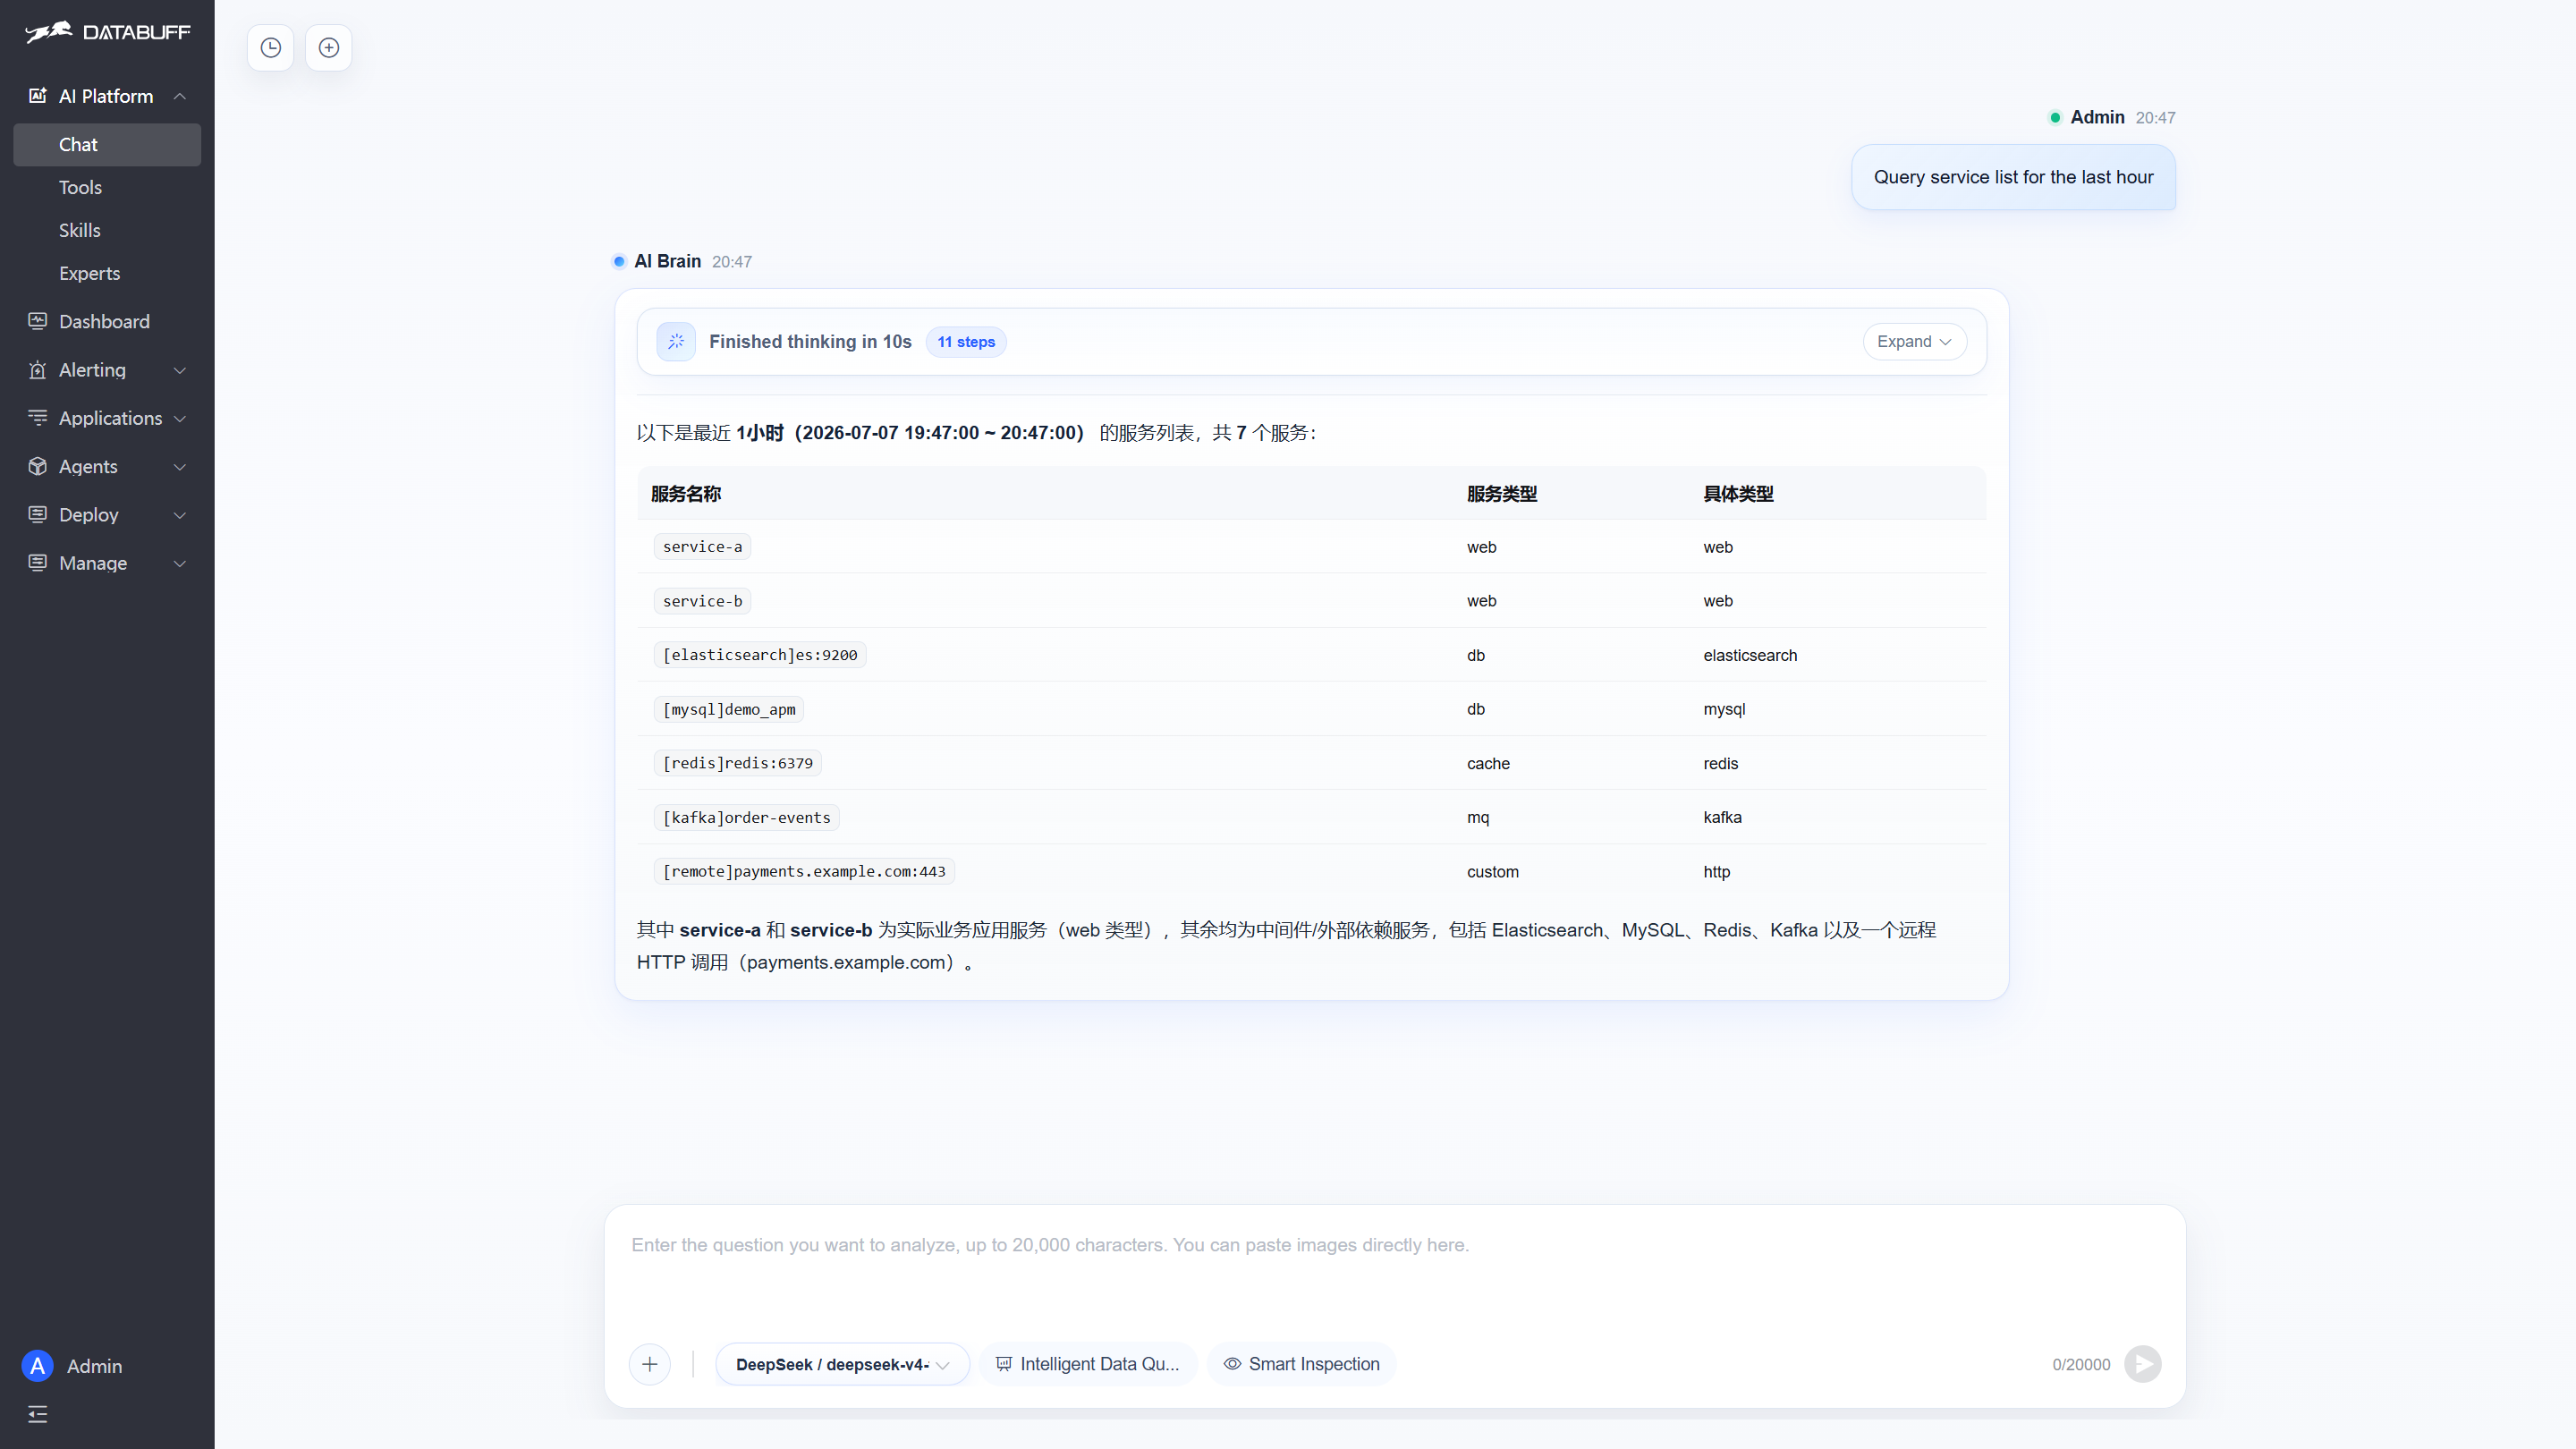
Figure 4-4 · After "Query service list for the last hour," AI completes 11 reasoning steps in ~10s, returning 7 services and dependency types including Elasticsearch, MySQL, Redis, Kafka—answers grounded in real telemetry, not empty generation.
Figure 4-4 · After "Query service list for the last hour," AI completes 11 reasoning steps in ~10s, returning 7 services and dependency types including Elasticsearch, MySQL, Redis, Kafka—answers grounded in real telemetry, not empty generation.
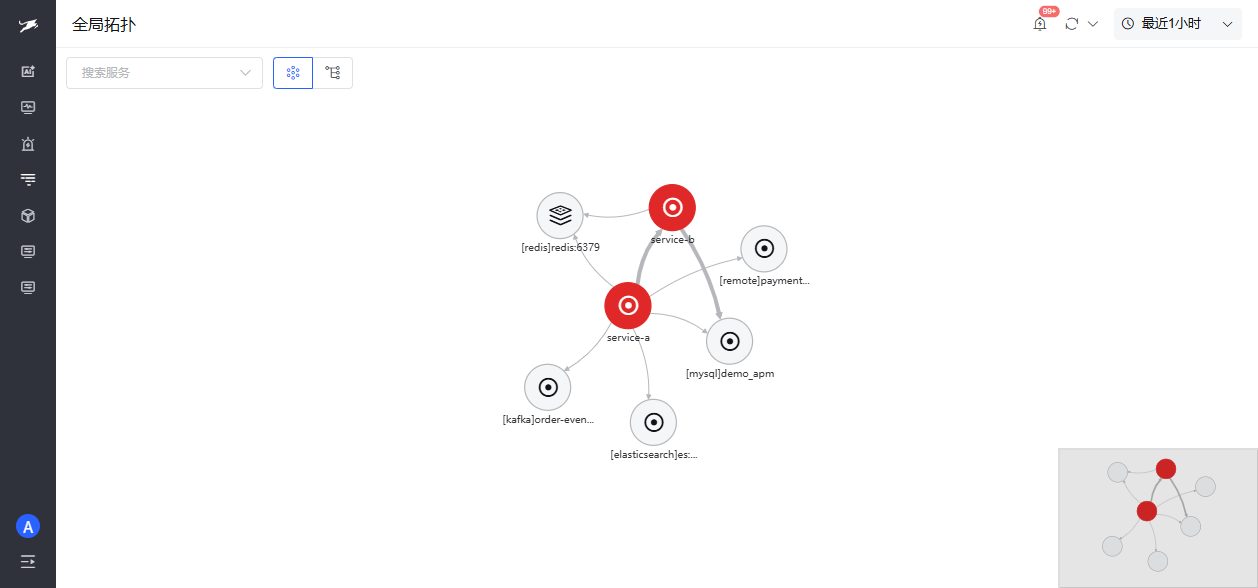
Figure 4-5 · Global topology shows inter-service call relationships, complementary to SkyWalking topology; AI Q&A can further ask about upstream/downstream and anomaly trends in natural language.
Figure 4-5 · Global topology shows inter-service call relationships, complementary to SkyWalking topology; AI Q&A can further ask about upstream/downstream and anomaly trends in natural language.
◆ ◆ ◆
5DataBuff vs SkyWalking Comparison
Same goal (understand distributed systems), different design trade-offs
| Dimension | Apache SkyWalking | DataBuff |
|---|---|---|
| Architecture | Probe + OAP + Storage + UI (four layers) | Ingest + Doris + Web (three layers) |
| Default ingestion | SkyWalking Java Agent (gRPC 11800) | OTLP 4317/4318 standard protocol |
| Backend deployment | OAP + ES/BanyanDB storage cluster | Docker script ~5 minutes to Demo |
| Java probe | skywalking-agent.jar + agent.config | OTel Java Agent + environment variables |
| Extension | OAL/MAL/LAL rule DSL | AI Tool / Skill / Expert + MCP |
| AI capabilities | — | Conversational Q&A, inspection, multi-agent orchestration |
| Better fit | Mesh/eBPF, four pillars in one, deep SkyWalking ecosystem | OTel unified ingestion, fast POC, AI-assisted on-call |
Practical tip If you completed SkyWalking backend + Java Agent setup from this article, keep existing traces; for new microservices, attach OTel Agent pointing at DataBuff in parallel and compare deployment steps, UI queries, and AI Q&A on the same traffic before scaling OTel share. The two are not mutually exclusive—SkyWalking OAP also supports OTLP Receiver.
◆ ◆ ◆
6Summary
From an industry view, Gartner's observability platform research highlights that rising system complexity and operational burden drive demand for proactive AI SRE agent management and reliability. SkyWalking's value lies in a mature probe ecosystem and OAP analysis pipelines: understand the four layers, start the backend with the official Docker script, attach Java with -javaagent—the shortest path to production. DataBuff represents another curve: OTLP standard + lightweight deployment + AI-native interaction—especially for teams pushing OpenTelemetry unified ingestion and wanting less Storage ops overhead. Run SkyWalking Quick Start and the DataBuff install script locally, generate Traces from a real Java service, then compare UI and AI Q&A before deciding.
◆ ◆ ◆
7References
1. https://skywalking.apache.org/docs/main/latest/readme/ 2. https://skywalking.apache.org/docs/main/latest/en/concepts-and-designs/overview/ 3. https://skywalking.apache.org/docs/main/latest/en/setup/backend/backend-docker/ 4. https://github.com/apache/skywalking/tree/master/docker 5. https://skywalking.apache.org/docs/skywalking-java/latest/en/setup/service-agent/java-agent/readme/ 6. https://github.com/apache/skywalking/tree/master/test/e2e-v2 7. https://www.databuff.ai/ 8. https://www.databuff.ai/databuff/ai-apm-install.sh 9. https://opentelemetry.io/ecosystem/vendors/ (OpenTelemetry official Vendors list · DataBuff entry) 10. https://www.gartner.com/reviews/market/observability-platforms (Gartner Observability Platforms market definition and AI observability discussion)
◆ ◆ ◆
◆ ◆ ◆