SkyWalking Quick Start Guide
SkyWalking · Open-Source APM · OpenTelemetry · DataBuff · Distributed Tracing
Many beginners treat SkyWalking as "another Zipkin"—it is actually a cloud-native observability platform covering Trace, Metrics, Logs, and Profiling. Below we start from the official four-layer architecture, use Docker scripts to start the backend quickly, attach Java Agent non-intrusively, then explain topology and trace queries against Demo console screenshots; finally a brief look at AI-native observability with DataBuff for later evolution.
1SkyWalking Overview
Apache SkyWalking is a complete application performance monitoring (APM) and observability analysis system. Unlike lightweight tools that only display traces, it aggregates five telemetry types on one platform:
Tracing: native Segment format, Zipkin v1/v2 compatible Metrics: native Meter, OpenTelemetry Metrics, Telegraf; integrates with Istio/Envoy Logging: disk or network collection; Agent auto-binds Trace context Profiling: language agents and eBPF agent for code-level hotspot analysis Event: records releases, config changes, and other key events linked to metrics/traces
1.1 Logical four-layer architecture
Official docs divide SkyWalking into four logical segments—understanding them is prerequisite for quick start:
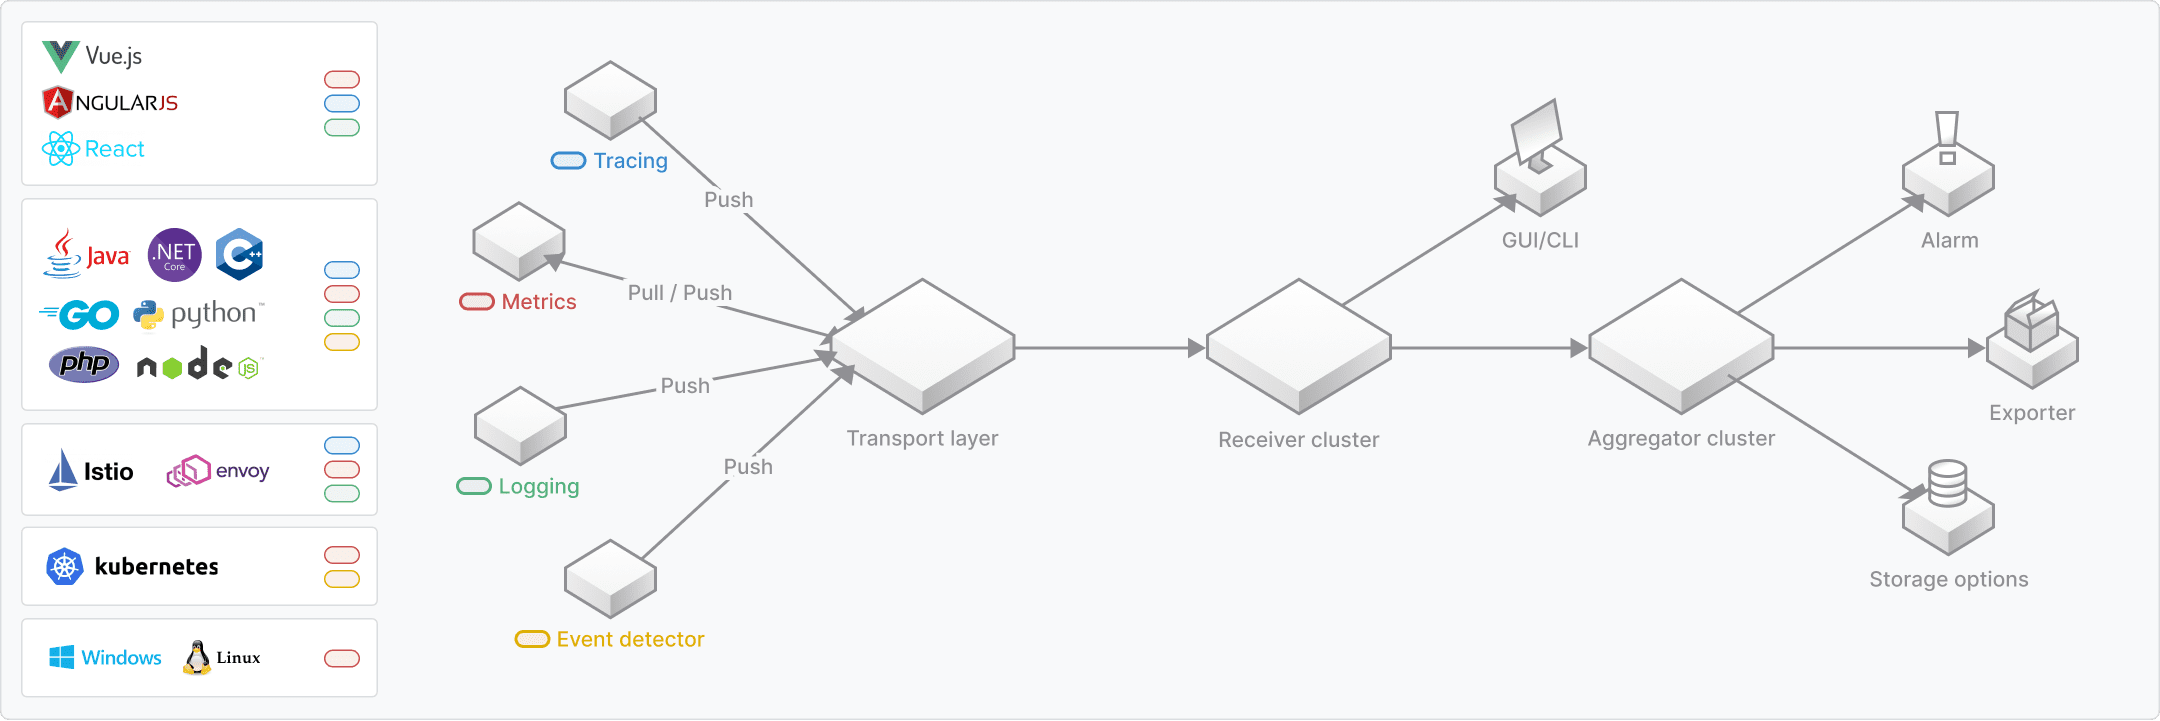
Figure 1-1 · Probes collect multi-protocol telemetry; OAP handles analysis and aggregation; Storage is pluggable; UI provides the visualization console. From v10.x, Booster UI evolves toward Horizon UI.
Figure 1-1 · Probes collect multi-protocol telemetry; OAP handles analysis and aggregation; Storage is pluggable; UI provides the visualization console. From v10.x, Booster UI evolves toward Horizon UI.
1.2 Core data model
SkyWalking describes observability objects as Service → Service Instance → Endpoint → Process:
Service: a group of workloads providing the same behavior (e.g. order-service) Service Instance: a single instance under a Service; in Java Agent scenarios, typically one OS process Endpoint: entry path such as HTTP URI or gRPC method signature Process: process-level metadata for linking to K8s Pods
Across K8s, Mesh, OS, and other layers, Service Hierarchy links views of the same logical service at different levels—why Horizon UI groups navigation by Layer on the left.
Rich probe forms: Beyond Java/C#/Go/Node.js/PHP/Python language agents, SkyWalking supports Service Mesh receivers, eBPF K8s monitoring, and third-party formats including OpenTelemetry, Prometheus, and Zipkin—suited to gradual adoption where legacy agents and new OTel data coexist.
◆ ◆ ◆
2SkyWalking Getting Started
Three steps: start backend → attach Java Agent → verify data in UI
For first practice, follow "get data flowing first, tune config later." Sections 2.1–2.3 cover backend deployment, Java probe installation, and console walkthrough. Commands come from SkyWalking 10.4 official docs and can be reproduced locally or in WSL.
◆ ◆ ◆
3.1 Backend Deployment
Docker Quick Start is the fastest path; production needs a separate Storage cluster plan
Official one-click script
The docs page provides an interactive script that prompts for Elasticsearch or BanyanDB as storage backend and starts OAP + UI.
Linux / macOS / WSL:
Windows PowerShell:
After the script completes, typical ports are:
Agent / gRPC reporting: 11800 (OAP default collector port) OAP HTTP REST: 12800 UI console: 8080 (browser access)
When done experimenting, tear down:
Custom compose configuration
To pin image versions or storage type, use profiles in the official repository:
Or run OAP alone with BanyanDB backend:
Ops note: Production commonly runs "OAP cluster + ES/OpenSearch or BanyanDB cluster + UI." Storage choice directly affects disk cost and Trace query latency; 10.x deepens BanyanDB integration—worth evaluating for greenfield projects.
◆ ◆ ◆
4.2 Java Probe Installation
Bytecode enhancement, non-intrusive integration; JDK 8–25 supported
Obtain the Agent package
From the Apache SkyWalking Java Agent release, extract the agent/ directory. Core file: skywalking-agent.jar; plugins in plugins/; config in config/agent.config.
Key configuration items
Edit agent.config (or override via environment variables):
In Docker Compose or K8s, common environment variable form:
Attach to the JVM
Executable JAR:
IDEA local debug: Run Configuration → VM options:
Tomcat (first line of catalina.sh):
Note: -javaagent must appear before -jar. After startup, wait tens of seconds; the corresponding Service node should appear in the UI "General Service" topology.
Plugin management
Plugins under plugins/ are enabled by default, covering Dubbo, Feign, HttpClient, JDBC, and common middleware; remove a jar to disable a probe. Optional plugins live in optional-plugins/—copy into plugins/ to activate.
◆ ◆ ◆
5.3 Console Views Explained
Horizon UI example, aligned with official Demo core views
After deployment and probe attachment, open the UI (default port 8080; Demo at demo.skywalking.apache.org). Horizon UI groups the left nav by Layer; "General Service" is the most common entry. Below, three core panels with live screenshots.
Service topology
The topology graph shows inter-service dependencies; node size reflects traffic, edge color indicates health. Click a Service to drill into instances, APIs, and Trace lists—the first step in "see the big picture, then pinpoint" troubleshooting.
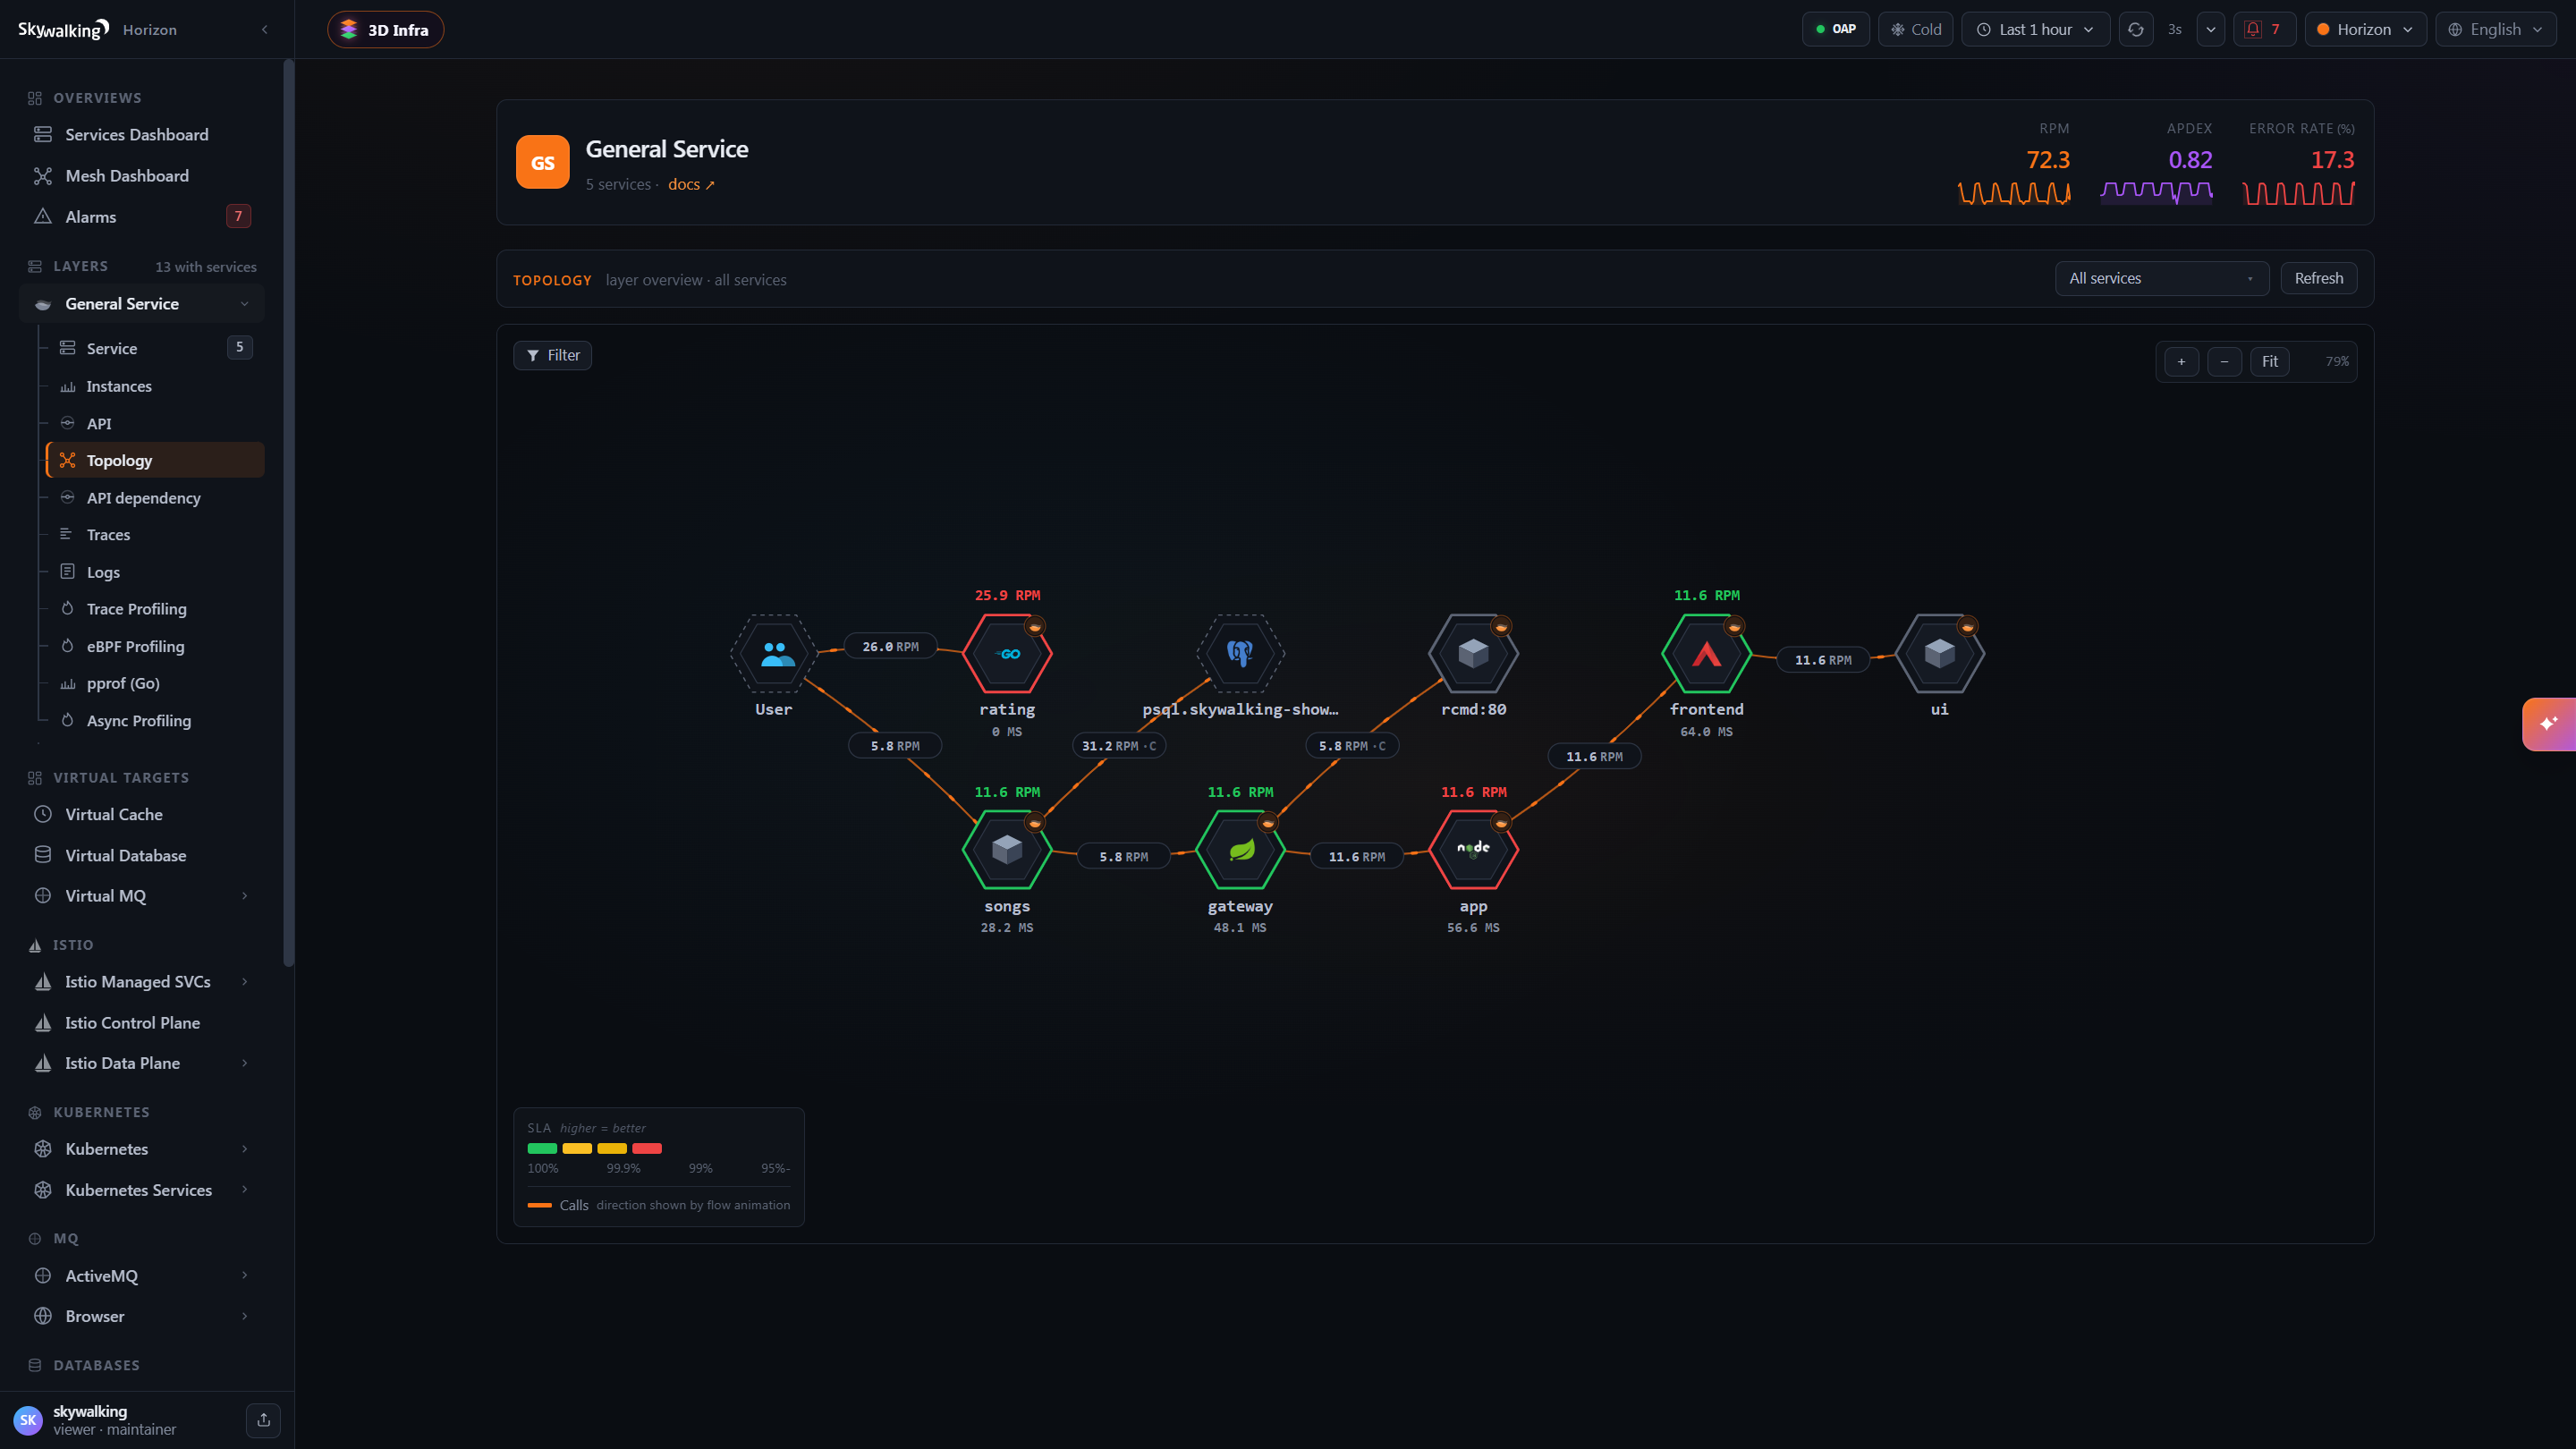
Figure 2-1 · Topology shows call relationships among gateway, app, user, etc., with RPM/error-rate metrics—anomalies stand out visually.
Figure 2-1 · Topology shows call relationships among gateway, app, user, etc., with RPM/error-rate metrics—anomalies stand out visually.
Services dashboard
The dashboard aggregates RED metrics (request volume, error rate, latency) per Service by Layer, sortable by APDEX, SLA, etc. On-call can quickly scan "which service slowed down today."
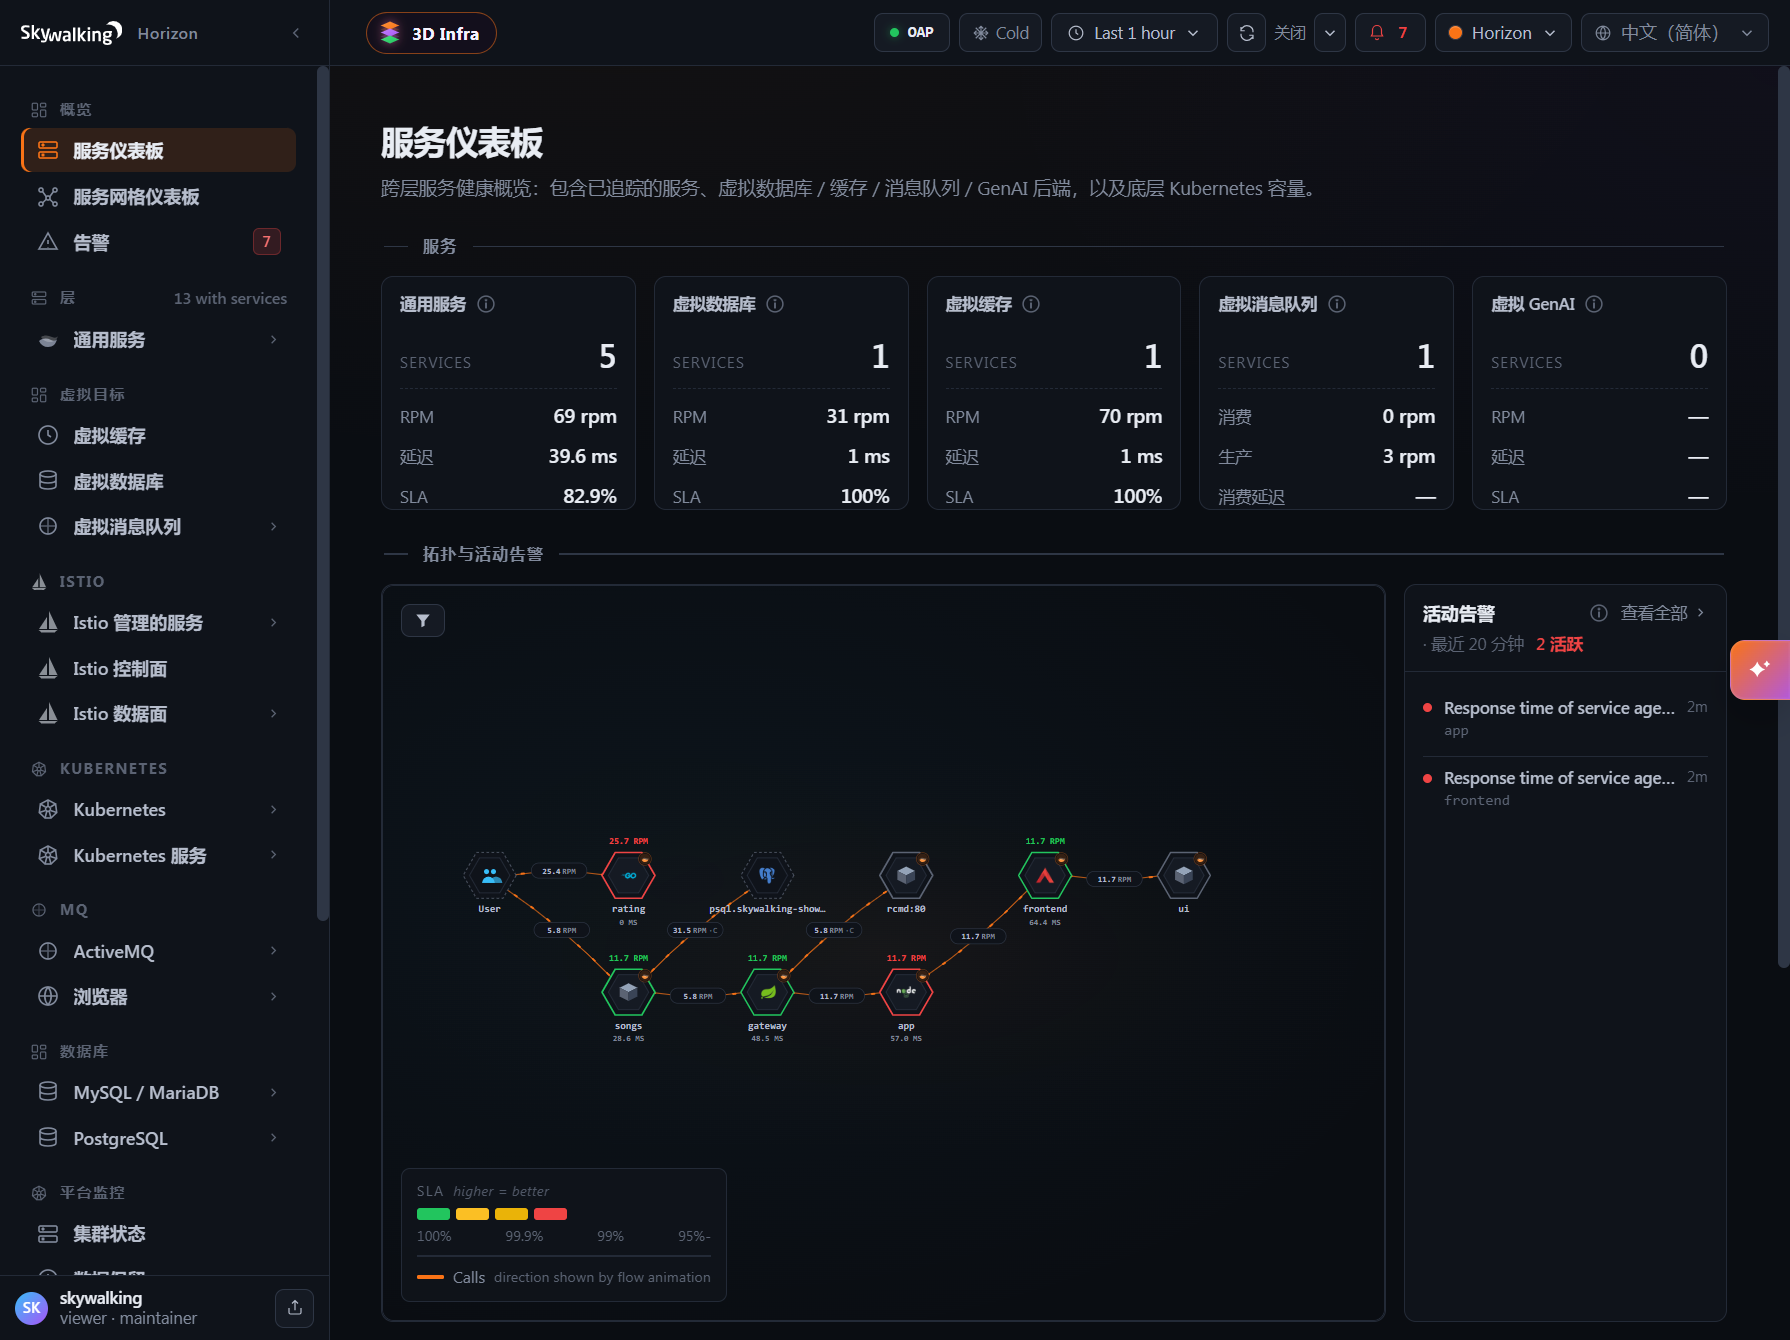
Figure 2-2 · Services dashboard lists RPM, success rate, P99 latency per Service; alert entry at top shows active alert count.
Figure 2-2 · Services dashboard lists RPM, success rate, P99 latency per Service; alert entry at top shows active alert count.
Distributed tracing (Traces)
The Trace panel filters by instance, Endpoint, status (success/error), duration range, Trace ID, etc. After "Execute query," the list shows Endpoint, duration bar, and status tag per Trace; the distribution chart on the right scatters normal vs error requests over time.
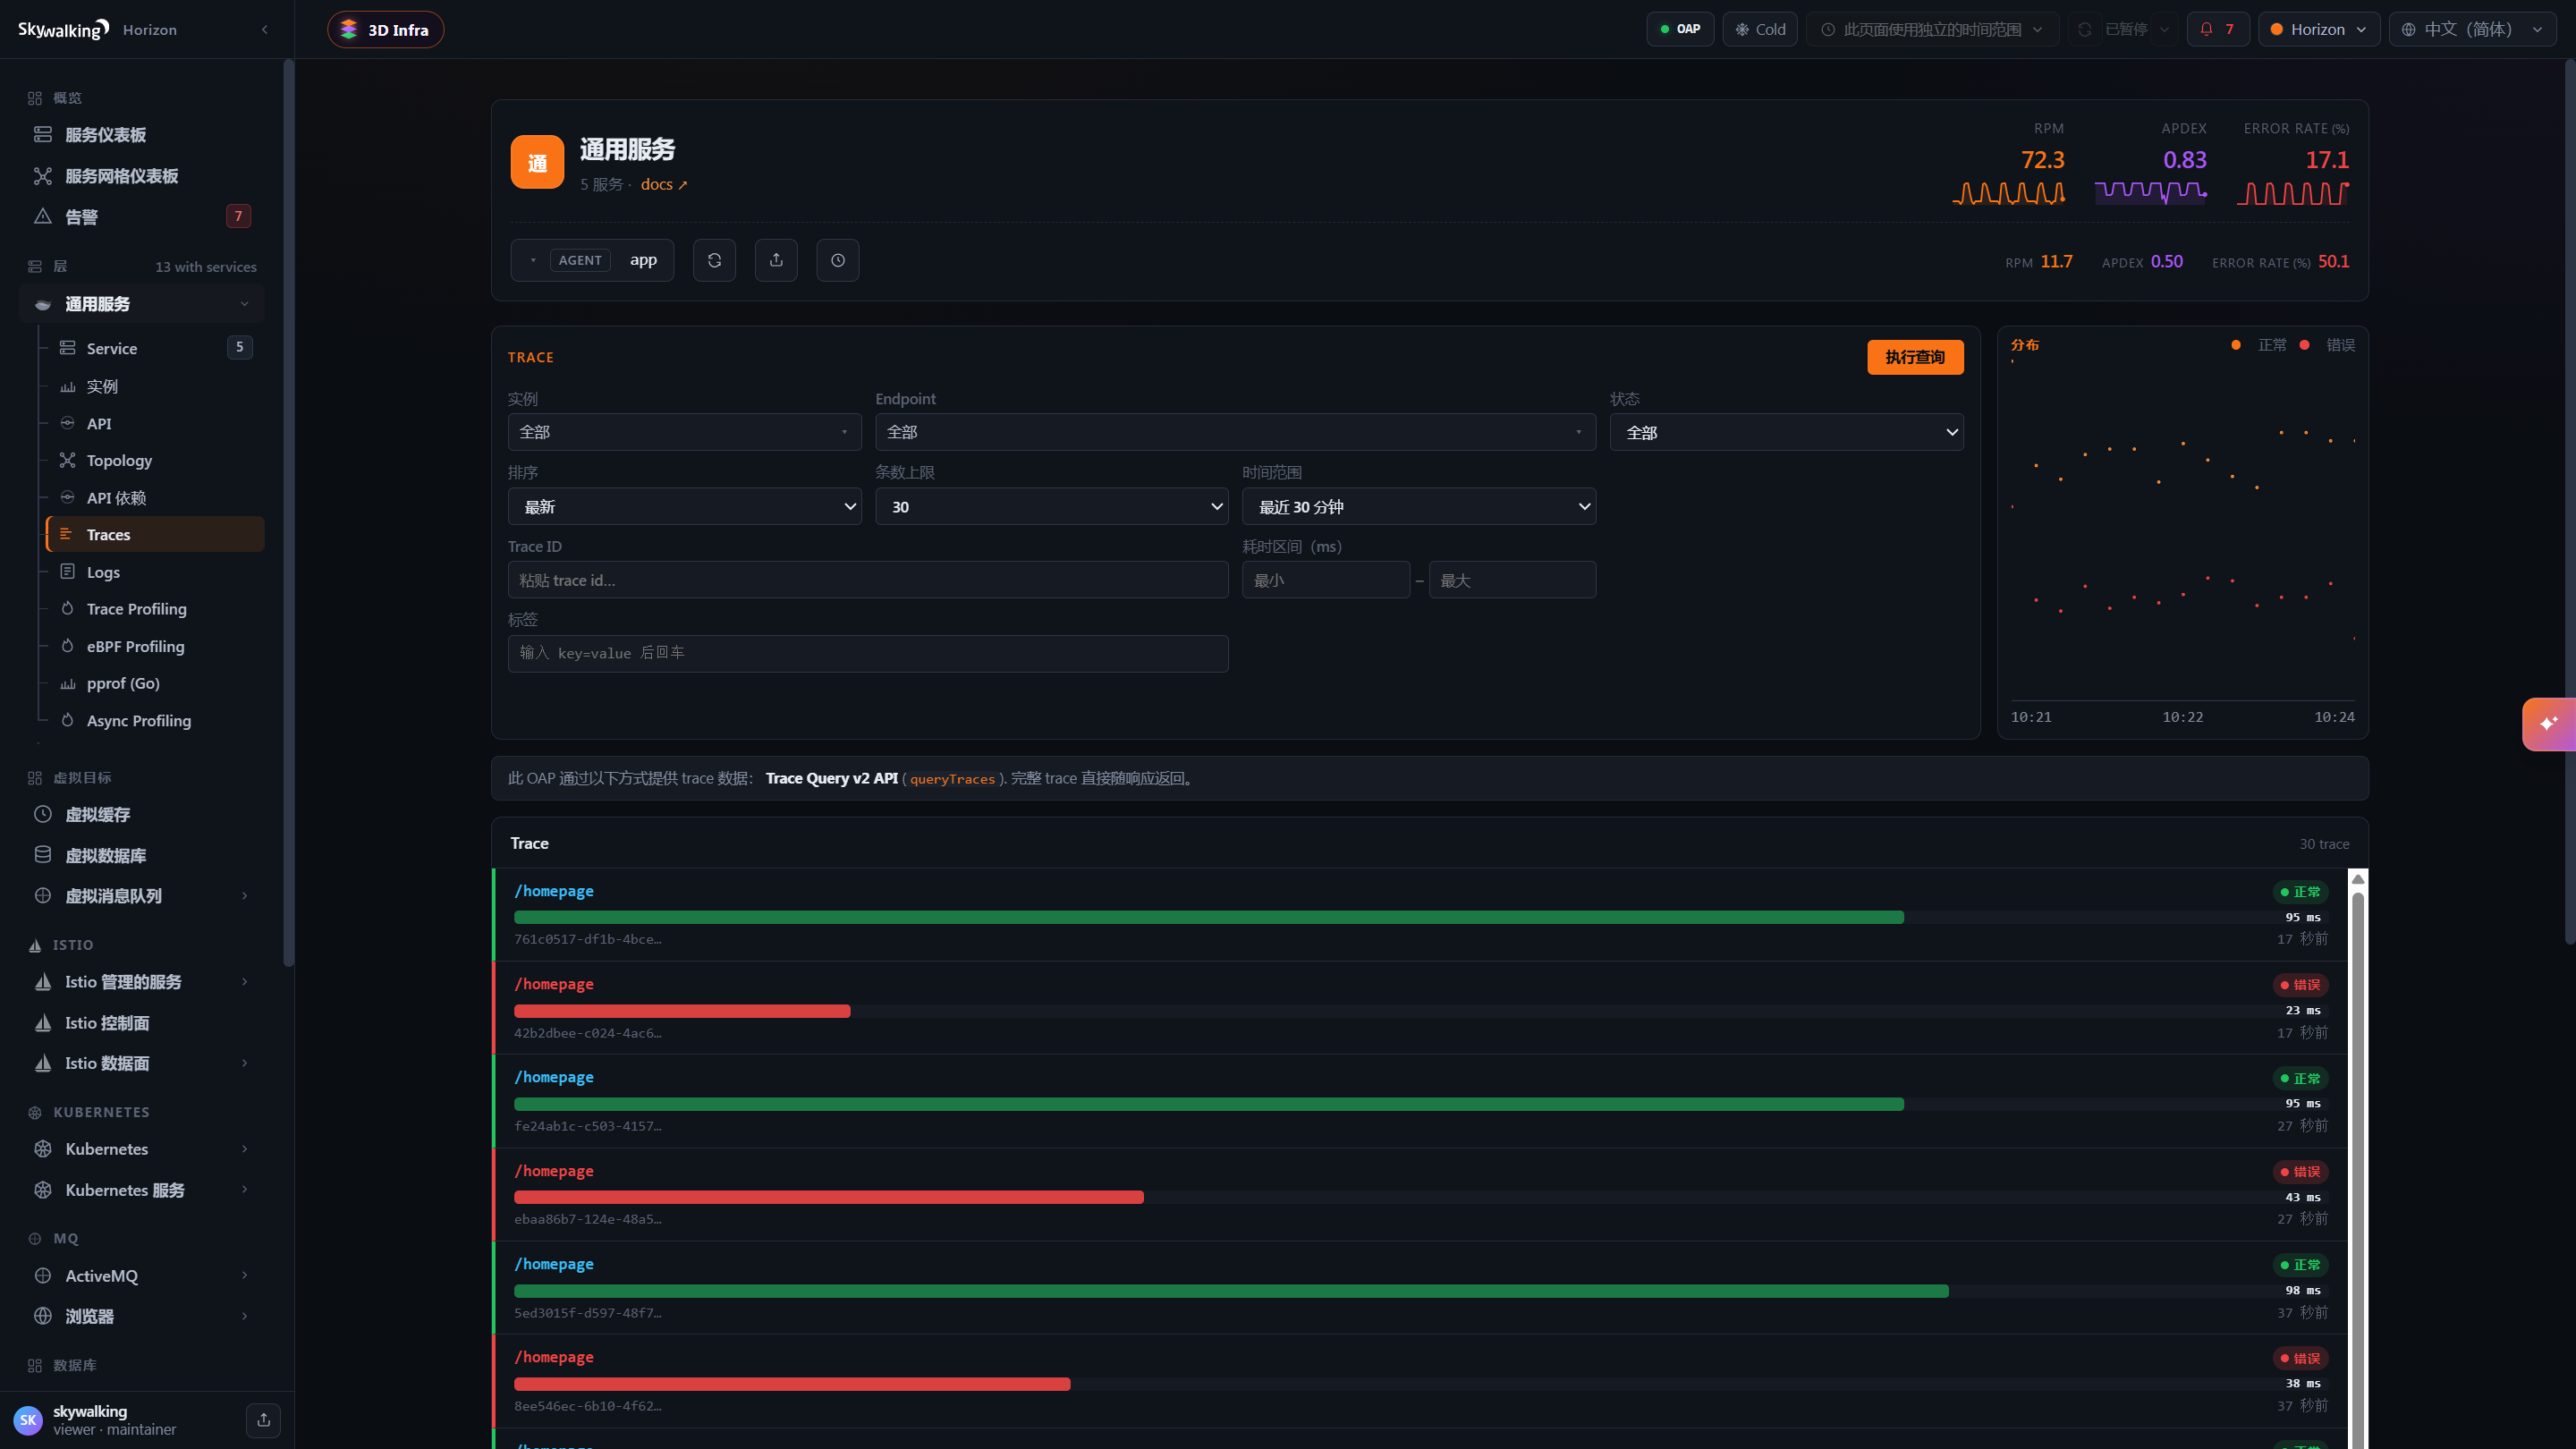
Figure 2-3 · Trace list shows duration bars for endpoints like /homepage (green normal, red error); open a row for Span waterfall to locate slow calls.
Figure 2-3 · Trace list shows duration bars for endpoints like /homepage (green normal, red error); open a row for Span waterfall to locate slow calls.
Beyond these three views, Horizon UI offers Logs (log–Trace correlation), Alerts (rule triggers and notifications), and Profiling (Trace Profiling / eBPF). For getting started, topology + Trace covers ~80% of daily troubleshooting.
◆ ◆ ◆
6AI-Native Capabilities

Figure 3-0 · The same probe can send gRPC 11800 to SkyWalking's four-layer stack, or OTLP 4318 to DataBuff's three-component stack with built-in AI Q&A on the Web platform.
Figure 3-0 · The same probe can send gRPC 11800 to SkyWalking's four-layer stack, or OTLP 4318 to DataBuff's three-component stack with built-in AI Q&A on the Web platform.
Important context: SkyWalking does not yet offer built-in AI agent capabilities—the console focuses on topology, Trace, metrics, and log visualization, not natural-language Q&A or multi-agent collaborative troubleshooting. If you want to explore AI-assisted on-call after SkyWalking is running, consider open-source DataBuff, which embeds an AI platform module on APM storage. Brief overview below.
3.1 DataBuff overview
DataBuff is an open-source APM for the OpenTelemetry standard: default OTLP Trace and Metrics ingestion, with query, alerting, and AI-assisted troubleshooting on unified storage. DataBuff is listed on the OpenTelemetry.io official Vendors ecosystem page, marked Native OTLP—verifiable on the OpenTelemetry site. Versus SkyWalking's four layers, DataBuff consolidates analysis and storage into a lighter three-component architecture:
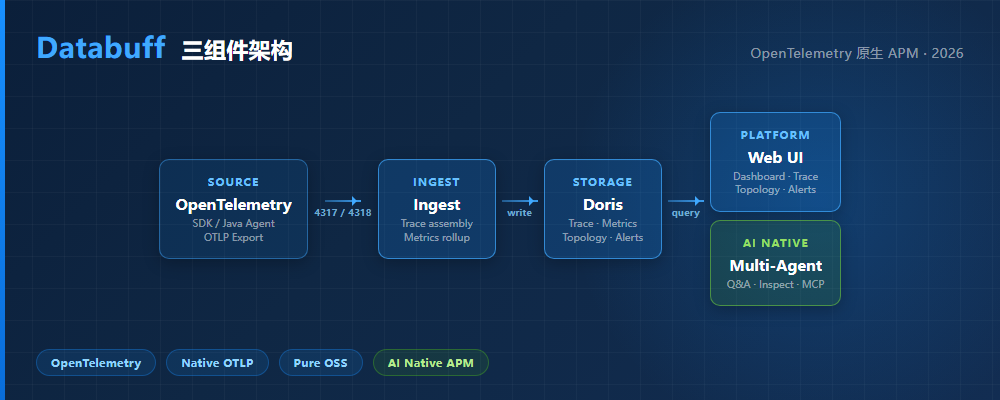
Figure 3-1 · OTel data enters Ingest; Doris stores Trace/metrics/topology; Web platform hosts APM UI and AI multi-agent layer.
Figure 3-1 · OTel data enters Ingest; Doris stores Trace/metrics/topology; Web platform hosts APM UI and AI multi-agent layer.
Applications use standard OTel environment variables—no proprietary Agent protocol. One install script brings up a Docker Demo:
3.2 DataBuff AI platform module
Many APM tools bolt on generic chat; DataBuff AI platform differs by using Skills to invoke platform tools and query OTel data already in Doris—not guessing from docs, but pulling real Traces, RED metrics, and topology before reasoning. Core modules include Brain (intent parsing), Query expert (metrics/trace queries), Inspection expert (anomaly inspection), and MCP extension (CMDB, ticketing, and adjacent systems).
Below, the same AI fault diagnosis scenario from the DataBuff official blog (https://databuff.ai/blog/en/databuff-joins-opentelemetry/) shows how on-call completes ask → deduce → act in natural language.
Scenario 1: Natural-language triage
In AI chat, enter something like "Topology node turned red—help diagnose why." AI Brain dispatches Query / Inspection experts to pull latency, error rate, and topology context from APM storage—compressing "hunt through dashboards" into one sentence.
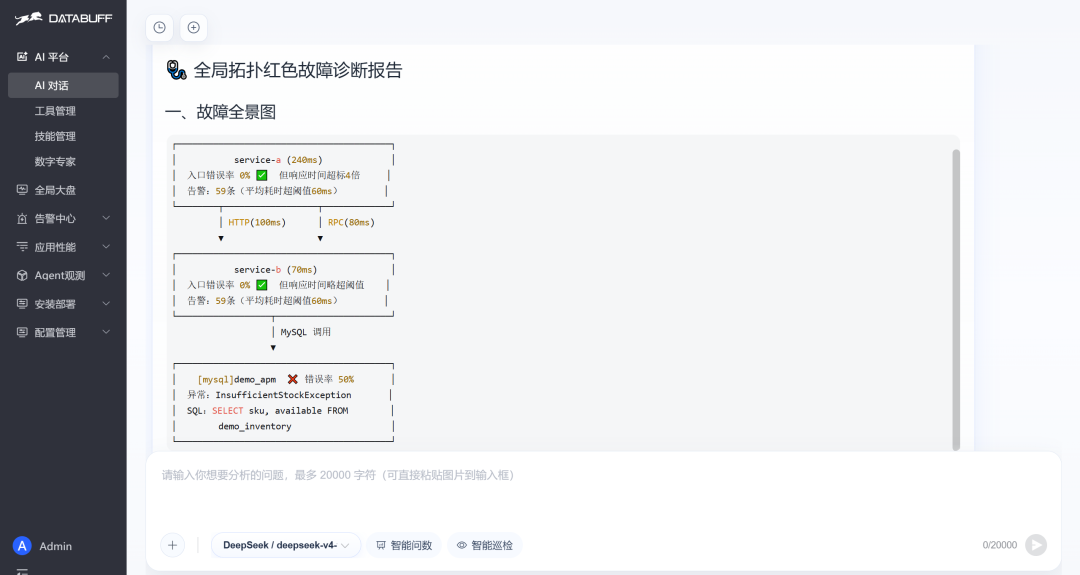
Figure 3-2 · Ask about service fault cause: chat UI shows user question and AI Brain starting multi-step reasoning.
Figure 3-2 · Ask about service fault cause: chat UI shows user question and AI Brain starting multi-step reasoning.
Scenario 2: Fault deduction tree
After experts pull service latency trends and cross-check topology and Traces, output a structured fault deduction tree: which node is abnormal, upstream/downstream impact, evidence from which metric or Span—troubleshooting path at a glance.
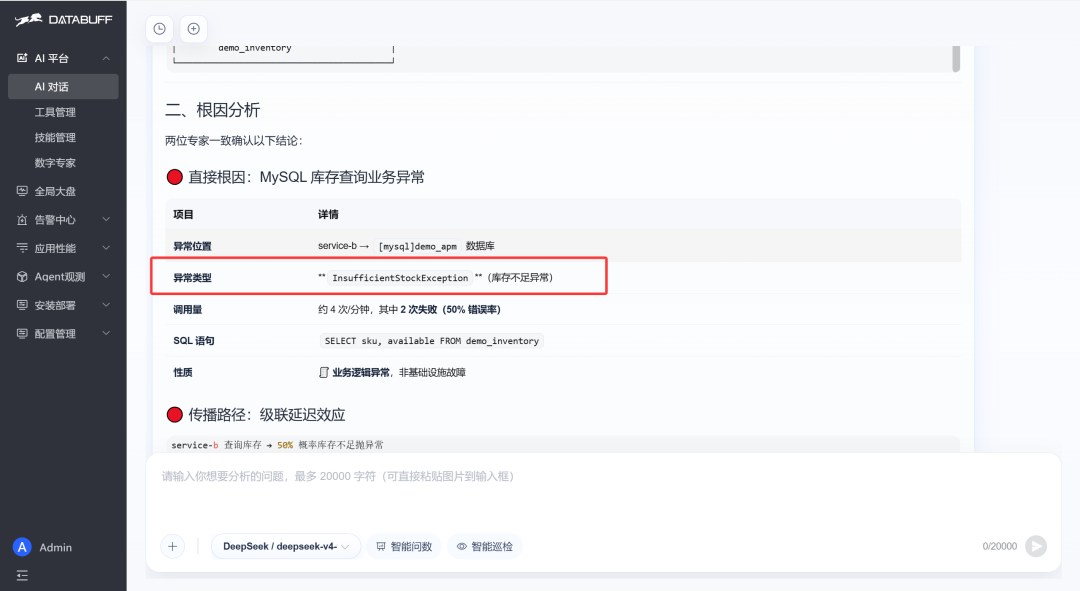
Figure 3-3 · AI fault deduction tree: organizes topology, metrics, and trace relationships from OTel storage into a follow-up-friendly reasoning path.
Figure 3-3 · AI fault deduction tree: organizes topology, metrics, and trace relationships from OTel storage into a follow-up-friendly reasoning path.
Scenario 3: Root cause and remediation
After deduction, AI provides root cause, remediation suggestions, and summary—translating distributed trace data into actionable on-call steps from "see the alert" to "know what to do next" in one session.
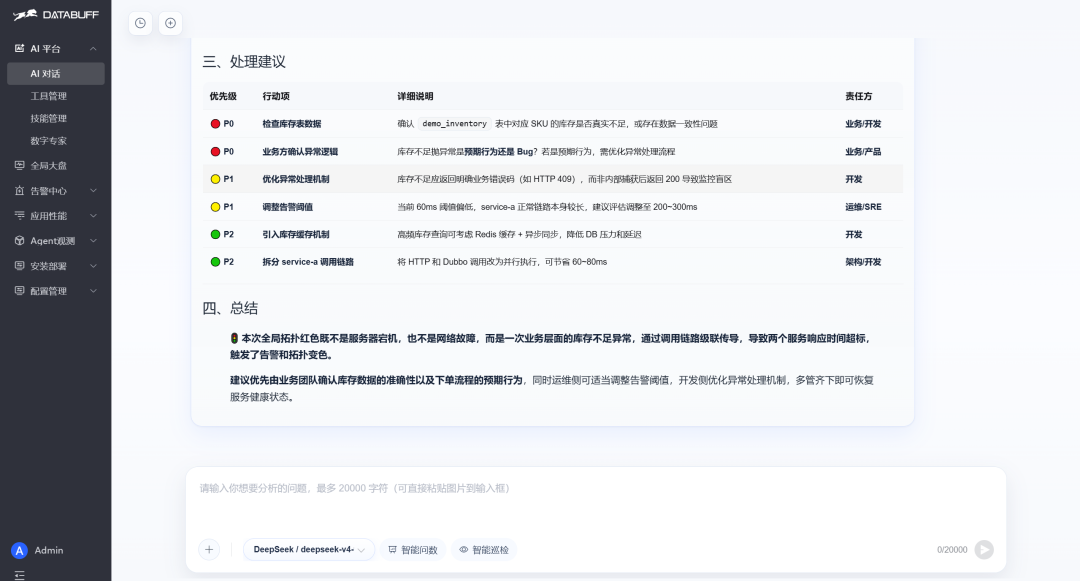
Figure 3-4 · AI root cause and remediation: structured report with root cause, suggested actions, and troubleshooting summary—all from real APM storage.
Figure 3-4 · AI root cause and remediation: structured report with root cause, suggested actions, and troubleshooting summary—all from real APM storage.
Evolution tip If you completed SkyWalking backend + Java Agent from this article, keep existing traces; for new microservices, attach OTel Agent pointing at DataBuff in parallel and compare deployment steps, UI queries, and AI Q&A on the same traffic. The two are not mutually exclusive—SkyWalking OAP also supports OTLP Receiver, suited to gradual evolution.
◆ ◆ ◆
7Summary
Gartner's observability platform research highlights that rising system complexity and operational burden drive demand for proactive AI SRE agent management and reliability. Observability tools are evolving from "manual dashboard hunting" toward "AI-assisted decisions."
SkyWalking quick start core path: understand four-layer architecture → Docker script for OAP + UI → -javaagent on Java → verify data in topology and Trace panels. Horizon UI integrates service dependencies, RED metrics, and trace detail in one console—enough for daily troubleshooting. When you need AI agent capabilities, explore DataBuff's OTLP three-component stack and AI Q&A module, comparing both on real traffic.
◆ ◆ ◆
8References
1. https://skywalking.apache.org/docs/main/v10.4.0/readme/ 2. https://skywalking.apache.org/docs/main/v10.4.0/en/concepts-and-designs/overview/ 3. https://skywalking.apache.org/docs/main/v10.4.0/en/setup/backend/backend-docker/ 4. https://github.com/apache/skywalking/tree/v10.4.0/docker 5. https://skywalking.apache.org/docs/skywalking-java/v9.6.0/en/setup/service-agent/java-agent/readme/ 6. https://www.databuff.ai/ 7. https://www.databuff.ai/databuff/ai-apm-install.sh 8. https://opentelemetry.io/ecosystem/vendors/ (OpenTelemetry official Vendors list · DataBuff entry) 9. https://www.gartner.com/reviews/market/observability-platforms (Gartner Observability Platforms market definition and AI observability discussion)
◆ ◆ ◆
◆ ◆ ◆