Self-Hosted SkyWalking vs Lightweight OTel APM: Application Performance Monitoring TCO Comparison
SkyWalking · Open-Source APM · OpenTelemetry · DataBuff · Distributed Tracing
Bottom line first: TCO is more than license fees—self-hosted SkyWalking’s hidden costs sit in Storage and OAP operations; lightweight OTel APM lowers the validation bar with three components + 8 GB demo. This article uses a qualitative matrix to help engineering leaders make actionable decisions.
1Commercial APM SaaS vs Self-Hosted Open Source: Three Decision Dimensions
“Buy a service” vs “install yourself” is not simply expensive vs cheap—it is a trade-off in cost structure, data boundaries, and evolution path
| Dimension | Commercial APM SaaS | Self-Hosted Open-Source APM |
|---|---|---|
| Direct costs | Subscription / usage billing with predictable budgets; scaling usually rises linearly with traffic | No commercial license fees; you provide servers, storage, and bandwidth |
| Hidden costs | Cross-border compliance, limited custom reporting, long-term vendor lock-in risk | SRE operations, version upgrades, storage expansion, alerting and HA setup |
| Scale effects | “Hands-off” advantage at moderate traffic; bills can grow sharply at very large scale | Storage and query pressure grow with traffic, but marginal license cost is zero |
| Qualitative conclusion | Suits teams that want fast launch, minimal ops headcount, and accept SaaS boundaries | Suits teams that must keep data on-prem, can invest in platform ops, and want deep customization |
This article does not publish unsourced “save XX%” TCO figures; selection should reflect actual headcount and compliance requirements.
Traces often contain URL parameters, user identifiers, and internal service names—for finance, government, healthcare, and similar sectors, whether data leaves the country or passes through third-party SaaS is often a hard requirement. Self-hosted open-source APM can deploy Ingest, storage, and query entirely inside a private VPC or air-gapped datacenter with a clear audit boundary.
Commercial SaaS: Relies on vendor SLA and DPA; cross-border transfer needs separate assessment Self-hosted open source: Full control of the data plane; compliance cost shifts to “self-hosted ops capability” investment
Commercial product roadmaps are vendor-driven; self-hosted options can integrate with the OpenTelemetry ecosystem, extend retention policies, and embed internal SSO and AI querying workflows. Ask during selection: Over the next 12–24 months, do we need a “standard APM console” or an “orchestrable observability data platform”?
◆ ◆ ◆
2Hidden Cost Checklist for Self-Hosted Open-Source APM
Zero software license does not mean “free”—these four cost categories are often overlooked during POC
| Cost category | Typical contents | Complexity (qualitative) | Selection implication |
|---|---|---|---|
| People · deploy and daily ops | Install, monitor component health, certificates and backups, incident troubleshooting | Medium–high (rises with component count) | Component count directly drives SRE headcount; minimal architecture lowers the bar significantly |
| Storage · retention and query | Trace sampling policy, hot/cold tiering, disk / object storage expansion | Medium (grows with traffic) | Prefer stacks that unify Trace + metrics in one store; avoid maintaining ES + Kafka in parallel |
| Upgrades · versions and compatibility | Major version migrations, OTel SDK and backend protocol alignment, storage schema changes | Medium | Prefer well-documented open source with active one-click install scripts |
| High availability · production grade | Ingest / storage / UI replicas, cross-AZ, alerting and drills | High | Demo validation and production HA are separate budgets; POC on single node, assess HA before launch |
Core conclusion: Self-hosted TCO is driven not by “license or not,” but by how many moving parts you maintain. Collapsing from “dozen microservices + message queue + search engine” to “three components” materially lowers hidden ops cost—this is the basis for comparing DataBuff with multi-component stacks below.
◆ ◆ ◆
3Open-Source APM Comparison: DataBuff vs SkyWalking vs Elastic Stack
High-level qualitative comparison to align technical reviews on architecture complexity vs capability coverage
| Dimension | DataBuff | Apache SkyWalking | Elastic Observability Stack |
|---|---|---|---|
| Positioning | AI-native OTel open-source APM; OTLP as sole ingestion | ASF top-level full-stack observability: Trace / Metrics / Logs / Events | Elasticsearch-centered Logs + APM + Metrics combination |
| Core component count (typical) | 3 Ingest + Doris + Web | Many Probe + OAP + Storage + UI (+ optional BanyanDB cluster) | Many ES cluster + APM Server + Kibana (+ common Kafka/Logstash) |
| Entry resources (qualitative) | ~8 GB for demo / dev validation | Production often 16 GB+, depending on storage backend | ES heap and node count requirements high; steeper bar for small teams |
| Ingestion protocol | OTLP gRPC 4317 / HTTP 4318 | Multiple probe formats + OTLP receiver (OAP 11800/12800, etc.) | Elastic Agent / OTel Collector → APM Server |
| Quick start | One curl install script | Docker / Helm / binary; storage chosen separately | Elastic Stack install and index lifecycle need dedicated ops |
| Open-source model | Full-stack open source | ASF top-level project with mature community | Elastic core components open source; some advanced features need commercial subscription |
| Better fit for | OTel unification · minimal self-host · AI-native ops · minute-level POC | Four-pillar full stack · Mesh/eBPF · existing SkyWalking footprint | Teams deep in ES logging wanting APM on the same platform |
DataBuff one-click install and OTLP ports (same in demo and production Compose):
After install, Web UI defaults to http://<host>:27403; point application Exporters at http://<host>:4318/v1/traces for application performance monitoring and distributed tracing.
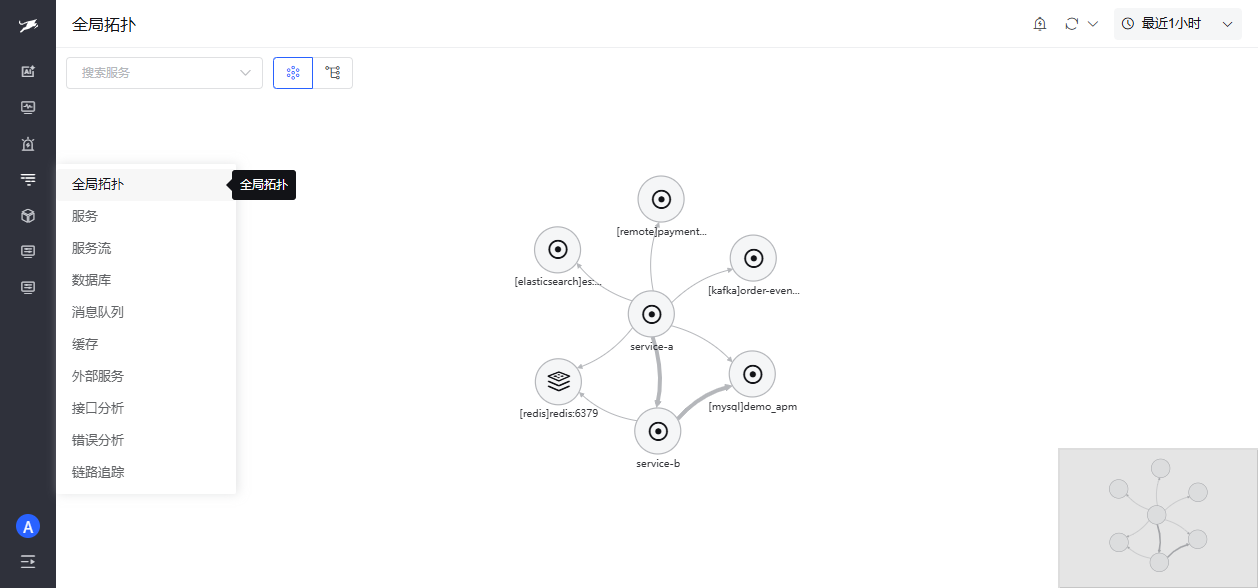
Figure 1 · Global topology — service dependency view after the three-component stack is running, comparable to multi-component APM topology
Figure 1 · Global topology — service dependency view after the three-component stack is running, comparable to multi-component APM topology
SkyWalking architecture and OTLP ingestion: official docs; Elastic APM architecture: Elastic official documentation.
◆ ◆ ◆
4DataBuff Full-Stack Open Source and Selection Decision Matrix
By organization size and compliance intensity, converge “buy SaaS vs self-host which open source” into one table
DataBuff from Ingest and storage (Apache Doris) through Web console and AI platform is full-stack open source—not a “closed core + open probe” hybrid. For teams evaluating self-hosted open-source APM, this means:
Full in-network audit of data flow and retention policies OTLP standard ingestion; applications are not bound to proprietary Agents 3 core components + ~8 GB memory enough for a working demo, lowering the cost of answering “is self-host worth it?”
Open-source repository: see references.
| Organization profile | Commercial SaaS | Self-host SkyWalking / Elastic | Self-host DataBuff |
|---|---|---|---|
| Small team · quick validation Engineering self-ops · no dedicated SRE | Low friction Fast launch; watch long-term bills | Higher bar Component and storage selection takes time | Evaluate first One-click script · three components · 8 GB demo |
| Growing company · OTel unification Polyglot microservices · planning AI ops | Limited customization and data export | Full capability; ops complexity rises with scale | Evaluate first OTLP 4317/4318 · AI-native querying |
| Large enterprise · existing ES / SW footprint Dedicated observability team | Can supplement edge scenarios | Continue investment Four pillars / unified ES stack | Parallel POC OTel new services gradually onboard |
| Strict regulation · data must stay in-domain Finance / government / healthcare | Strict SaaS boundary assessment required | Viable Fully self-hosted; high ops cost | Viable Full-stack open source · fewer components · short audit chain |
◆ ◆ ◆
5Scenario-Based Selection Guidance
A decision tree for “in our situation, what is the lower-friction direction?”—scenarios, not spreadsheets
Strategy is OpenTelemetry unified ingestion; applications maintain one OTel SDK / Collector set Team size is limited; need three components, 8 GB demo, one curl command to quickly prove application performance monitoring value Data must stay on-prem and you want full-stack open source with the shortest audit chain Exploring AI-native operations (conversational Trace/metrics search, multi-agent inspection) Existing SkyWalking footprint; new services on OTLP with parallel transition rather than big-bang migration
Must cover Trace + Metrics + Logs + Events four pillars at once, with existing ES / BanyanDB ops practice Heavy reliance on Service Mesh (Istio/Envoy) or eBPF K8s monitoring for zero-code infrastructure coverage Logs and APM already unified on Elasticsearch; expanding APM module is cheaper than a new stack (qualitative judgment)
No dedicated ops team and compliance allows Trace through third parties Traffic is volatile; capacity planning fully outsourced to vendor SLA Short project or extremely tight PoC window where self-hosting any stack cannot meet timeline
| Scenario | Background | Selection lean |
|---|---|---|
| A · 15-person backend team first APM | No SRE; must prove “can see traces and find slow requests” within two weeks | Self-host DataBuff — curl install + demo traffic; 4318 ingest for existing Spring / Node services |
| B · Existing SkyWalking · new microservices OTel | Legacy systems keep SkyWalking Agent; new services unified on OTel | Parallel — new services to DataBuff; legacy unchanged, switch service by service |
| C · Group already on ES logging platform | Logs in Kibana; want APM correlated with logs | Elastic APM or unified ES stack; if OTel + AI ops is new priority, run separate DataBuff POC for comparison |
Selection should not stop at architecture slides—after POC, on-call lives in the global dashboard and service list. Below is real DataBuff UI (demo environment) showing actionable views after self-hosted open-source APM deployment.
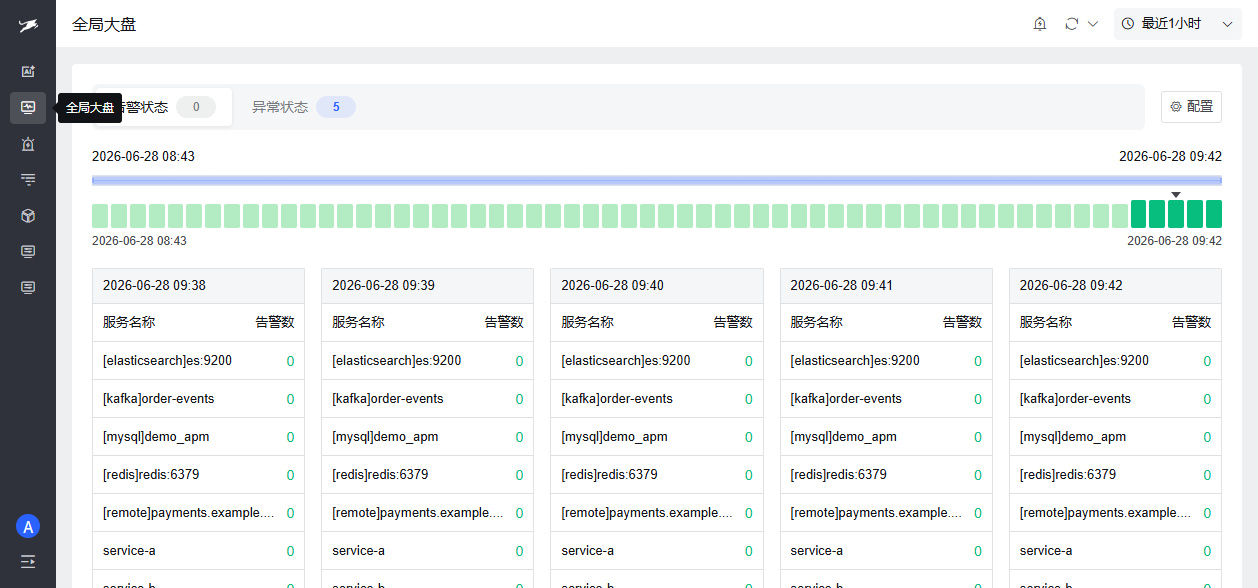
Figure 2 · Global dashboard — minute-level health timeline for on-call first screen and POC acceptance
Figure 2 · Global dashboard — minute-level health timeline for on-call first screen and POC acceptance
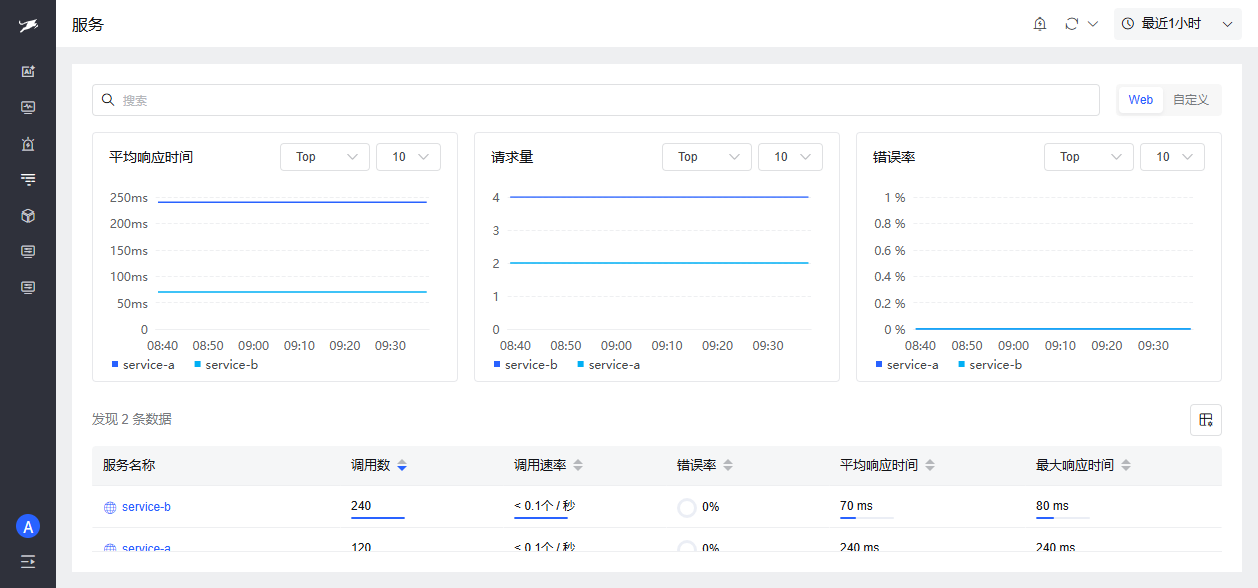
Figure 3 · Service list — call count / error rate / latency; core entry point for application performance monitoring
Figure 3 · Service list — call count / error rate / latency; core entry point for application performance monitoring
◆ ◆ ◆
6FAQ
| Question | Brief answer |
|---|---|
| What is the biggest hidden cost of self-hosted SkyWalking? | Storage cluster ops, index/TTL management, OAP and storage version alignment. |
| Who is lightweight OTel APM for? | OTel unification strategy, small/medium teams, minute-level POC validation. |
| Must SkyWalking be decommissioned for TCO comparison? | No. Run parallel dual-stack and switch primary after cross-check. |
◆ ◆ ◆
From an industry perspective, Gartner holds that observability platform investment should deliver revenue loss avoidance and brand perception gains; TCO assessment must include Storage and SRE hidden costs, not software license alone.
◆ ◆ ◆
7References
[1] : https://databuff.ai/databuff/ai-apm-install.sh [2] : https://skywalking.apache.org/docs/main/latest/en/concepts-and-designs/overview/ [3] : https://skywalking.apache.org/docs/main/latest/en/setup/backend/otlp-trace/ [4] : https://www.elastic.co/guide/en/apm/get-started/current/index.html [5] : https://github.com/databufflabs/databuff?utm_source=article&utm_medium=web&utm_campaign=viral-09 [6] : https://www.gartner.com/reviews/market/observability-platforms (Gartner Observability Platforms market definition and capability overview)
◆ ◆ ◆
◆ ◆ ◆