After July's "SkyWalking, but with AI" post, the most frequent comment was:
Yes, and it's worth trying. SkyWalking is already mature at collecting traces; DataBuff adds AI question-answering, multi-expert diagnosis, and service-flow / call analysis on top of the same Segment data — the things you actually reach for on call.
- Business side — keep the Agent jar, leave
collector.backend_serviceunchanged, no rolling restart of Pods; Agents keep talking to the sameoap-host:11800. - Platform side — deploy
databuff-proxyon the original SkyWalking OAP host, let it take over:11800, and rebind OAP to a new port; proxy fans the same traces out to both OAP and DataBuff. - Comparison period — watch both UIs side by side; once you're happy, turn off SkyWalking ingestion in the admin page.
Below is a comparison from running SkyWalking and DataBuff in parallel on the same demo workload. Topology, traces, and logs exist on both sides; what's worth experiencing in parallel falls into two buckets.
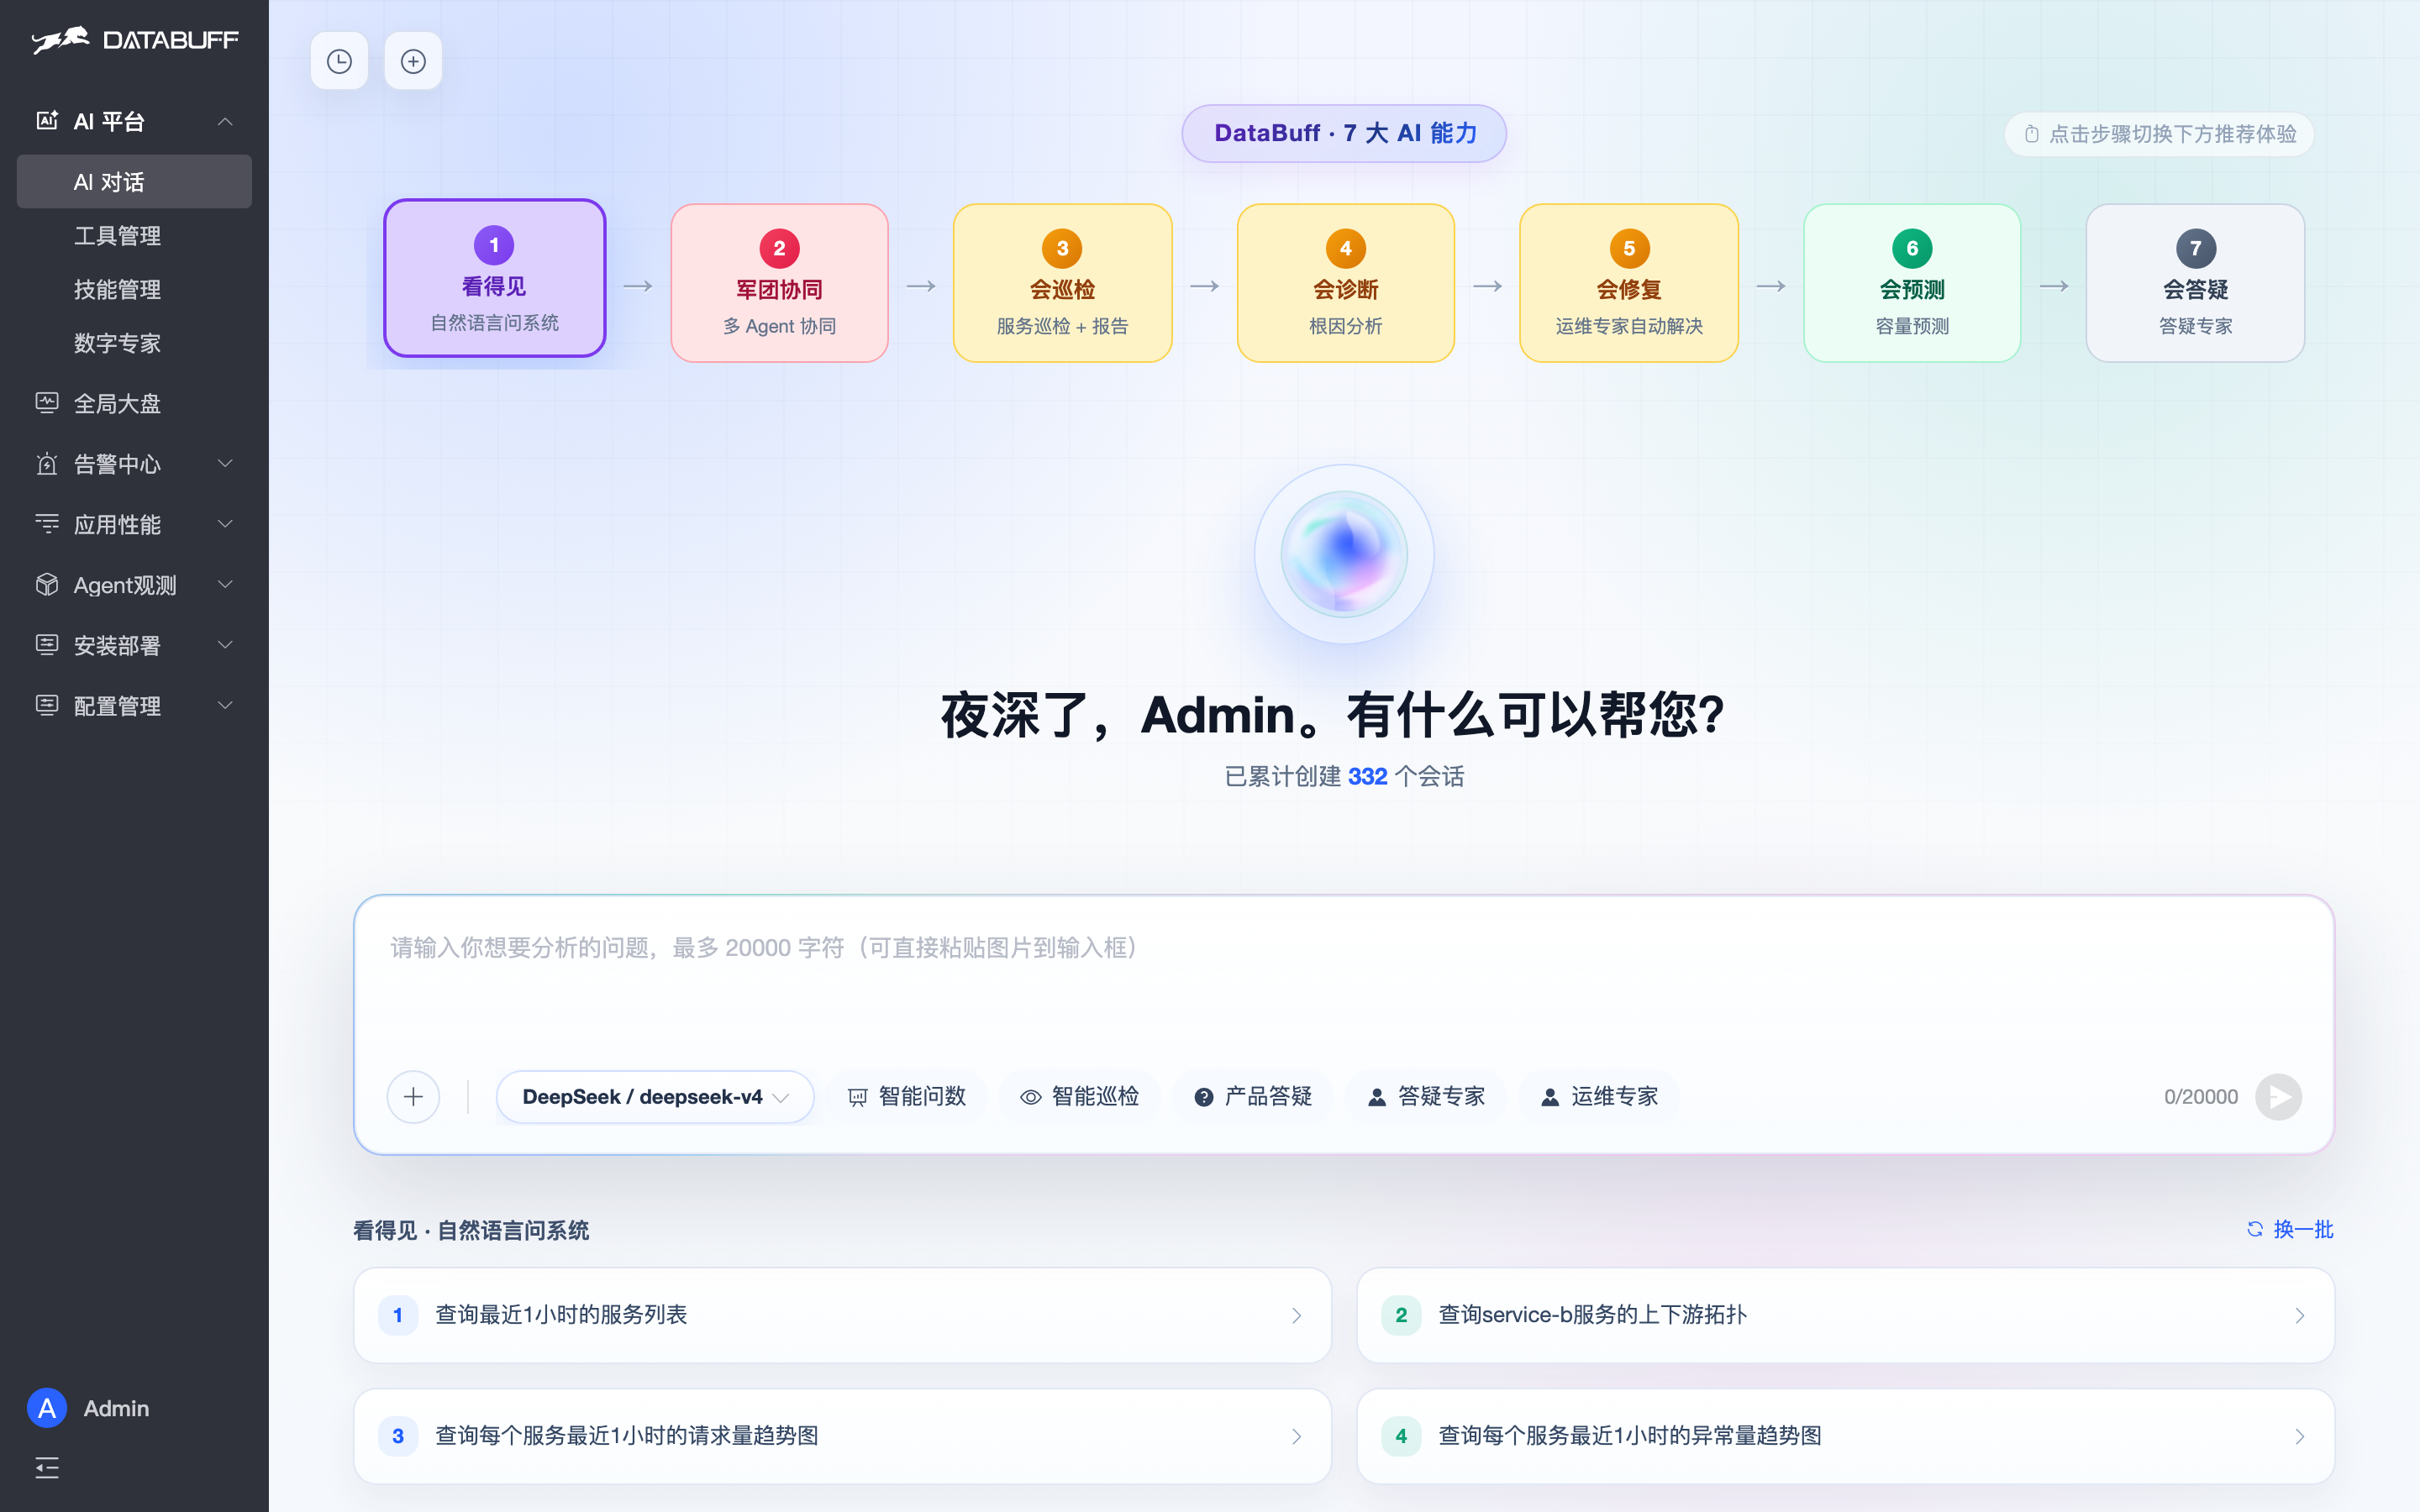
7 AI capabilities (same-env measurement · SW 10.4.0 vs DataBuff v0.1.7)
| Capability | SkyWalking | DataBuff |
|---|---|---|
| Natural-language querying | — | ✅ Ask services / topology / anomalies in plain language |
| Multi-agent collaboration | — | ✅ Parallel evidence-gathering by multiple experts |
| One-line inspection report | — | ✅ With evidence and remediation suggestions |
| Root-cause evidence chain | — | ✅ Stitches trace / metric / topology into evidence |
| Controlled remediation | — | ✅ Policy + human approval |
| Capacity / trend forecasting | — | ✅ Proactive prediction |
| Product Q&A + MCP / Skill | — | ✅ Extensible digital experts |
APM capabilities (same-env measurement · sourced from compare-vs-skywalking)
| Capability | SkyWalking | DataBuff |
|---|---|---|
| Global topology | ✅ incl. middleware nodes | ✅ health color-coding + drill-down |
| Service list / golden signals | ✅ Apdex / latency / load | ✅ service charts + list |
| Service-level topology | ✅ | ✅ |
| Service-level call analysis + linked trace | — | ✅ upstream/downstream structure, one click to trace |
| Instance-level golden signals | ✅ load / latency / success rate | ✅ instance charts + list |
| Instance-level topology | — | ✅ standalone instance topology |
| Instance-level call analysis + linked trace | — | ✅ per-instance upstream/downstream, drill to trace |
| Endpoint-level topology | — | ✅ standalone endpoint topology |
| Endpoint-level call analysis + linked trace | — | ✅ per-endpoint caller/callee, drill to trace |
| Service flow (entry response contribution) | — | ✅ expand by entry, service / endpoint-level chains |
| DB / cache / MQ / external calls | ✅ Dashboard / middleware dashboards | ✅ dedicated pages + linked trace |
| Error analysis | — | ✅ stats + endpoint-level drill-down |
| Trace list / search | ✅ service / endpoint / status / duration | ✅ chart + list, multi-dim filters |
| Trace detail | ✅ span timeline / tags | ✅ waterfall + span attributes |
| Trace ↔ logs | ✅ span can link logs | ✅ trace / span log tab |
| Log list / search | ✅ | ✅ |
| Log → trace | ✅ can jump to trace | ✅ can land on a specific span |
| Profiling (Tracing / AsyncProfiler / eBPF) | ✅ all three | — |
| Customizable dashboards / middleware dashboards | ✅ built-in multi-layer dashboards | — |
| Alerting config & events | mostly OAP YAML / hooks | ✅ alert center + smart alerts + drill-back to APM |
| SkyWalking Agent | ✅ native | ✅ gRPC :11800 compatible |
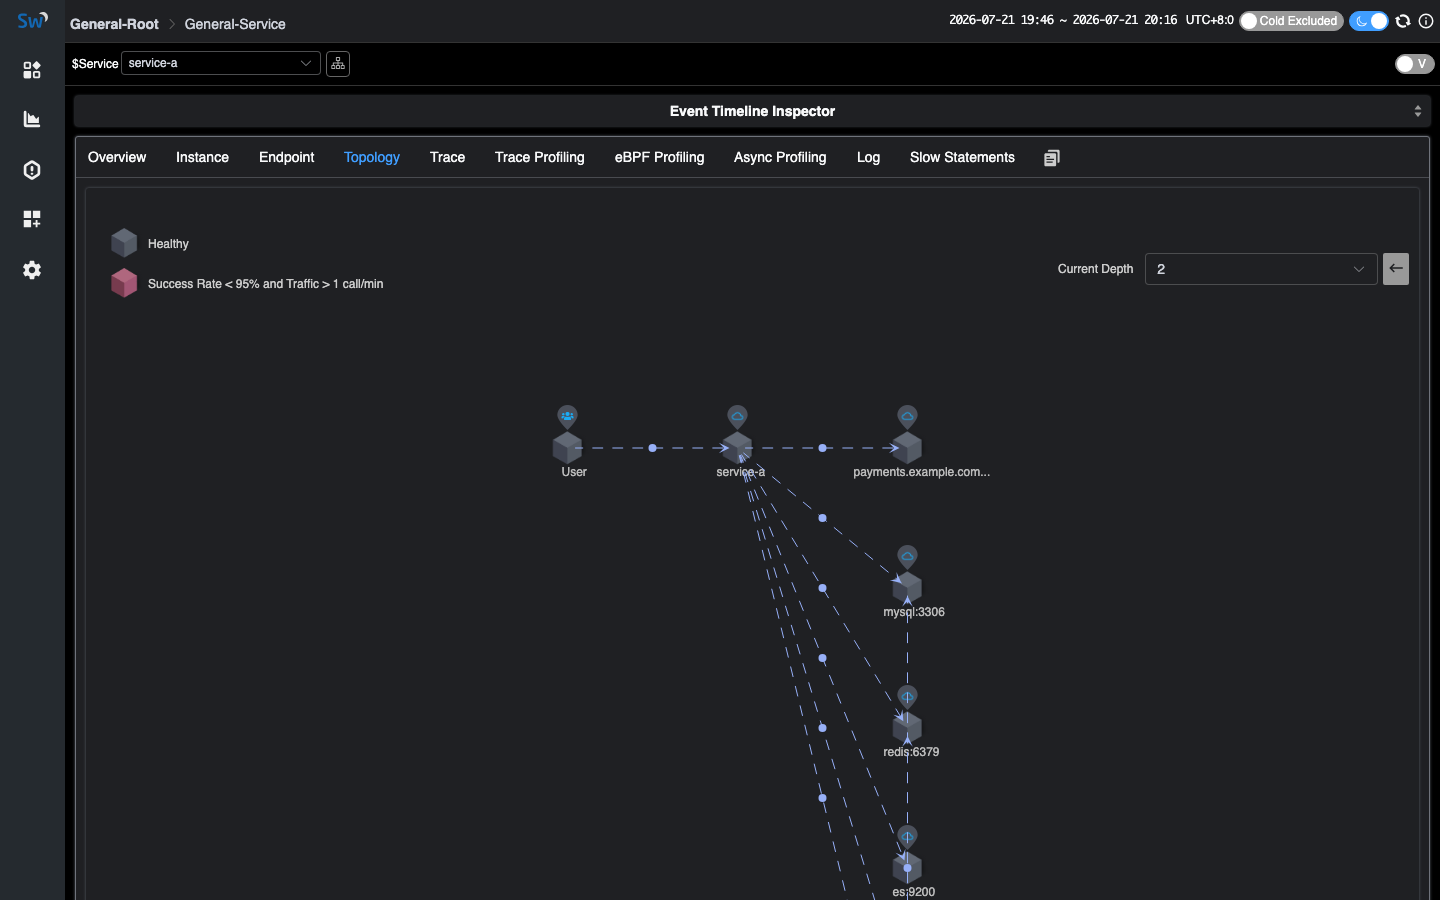
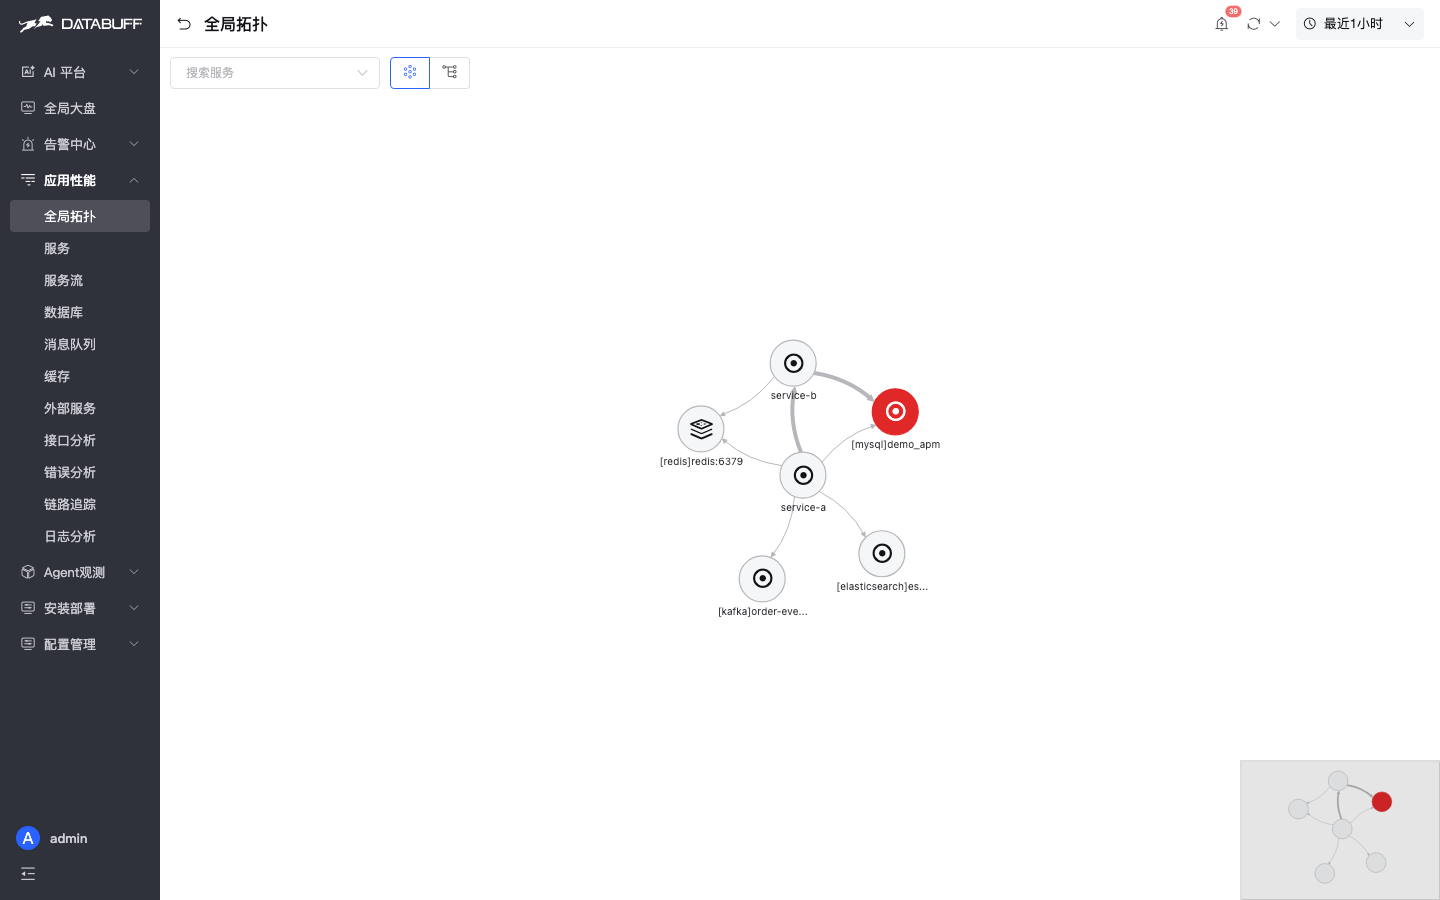
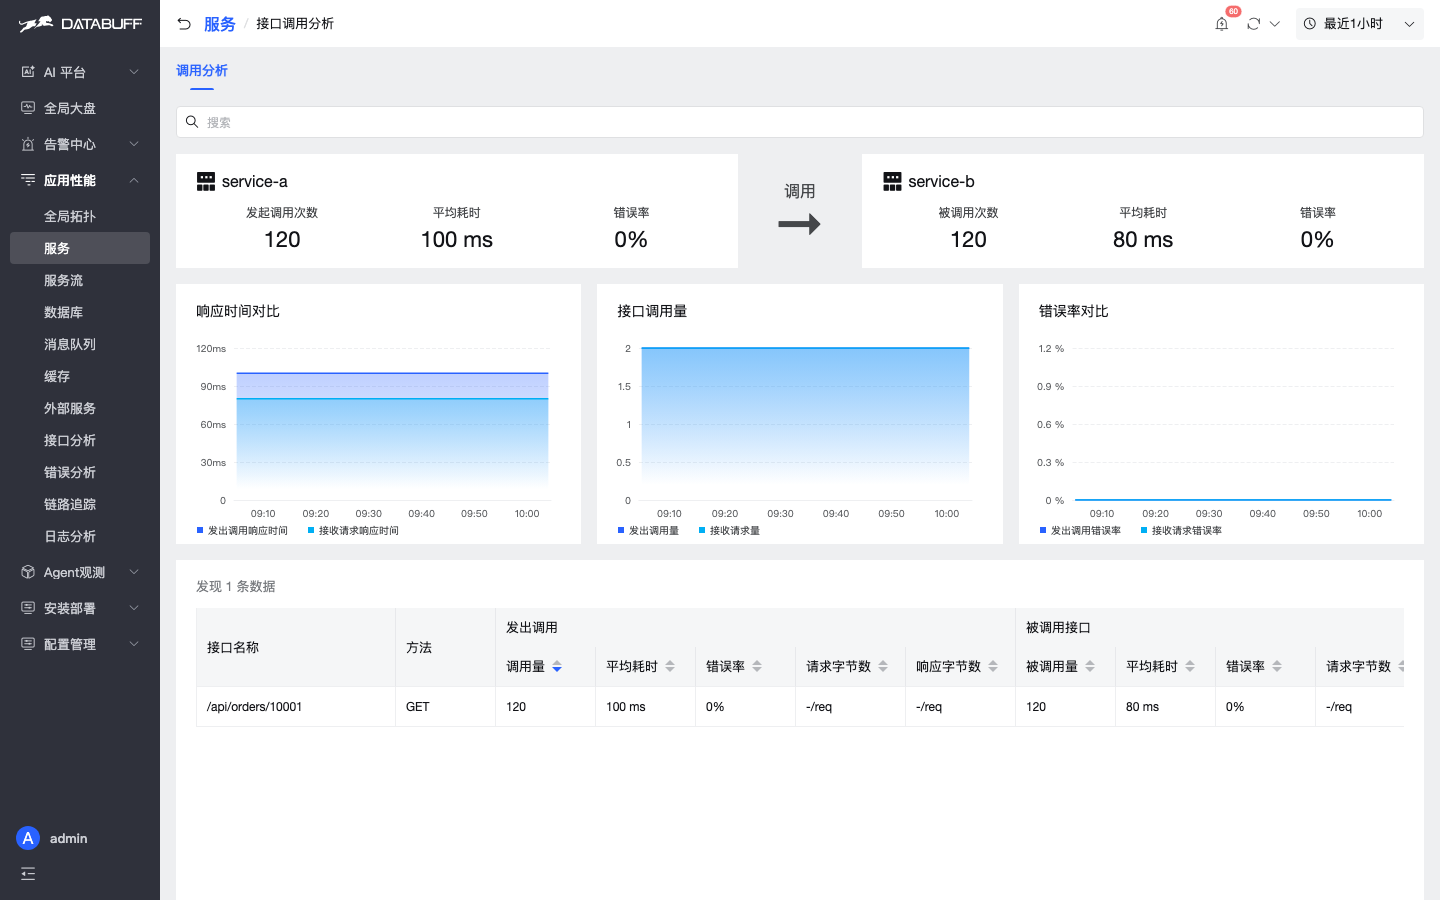
Caveat: side-by-side on the same demo workload. Topology, traces, and logs exist on both sides; DataBuff's extras are AI, service-flow / call analysis, and the alert center. Teams already on SkyWalking usually keep the Agents and run both in parallel first.
To have the same Agents report into both OAP and DataBuff at once, use databuff-proxy: a Go gRPC fan-out sidecar that listens on the OAP address :11800 Agents already point to, and symmetrically forwards trace / JVM / log to both backends with no protocol conversion.
collector.backend_service to point at the proxy — instead let proxy take over :11800 on the OAP host and move OAP to another port. Agents stay unchanged; traffic dual-writes naturally.Business cluster (Agents still point to oap-host:11800 — no config change, no restart)
│
▼
[Original OAP host] databuff-proxy :11800 ← takes over the original OAP port
├──→ SkyWalking OAP :new port (e.g. host 21800)
└──→ DataBuff Ingest :11800
Four steps to get going (platform-side only, zero business restart):
- Deploy proxy on the OAP host — extract from Releases, write
config.yamlfirst:skywalking= OAP's new address after it moves (e.g.127.0.0.1:21800),databuff= DataBuff Ingest address, bothenabled: true. - Rebind OAP's port, free 11800 — e.g. in docker-compose change OAP mapping from
11800:11800to21800:11800; after recreate, confirm OAP is healthy on the new port. - Start proxy on :11800 —
./start.sh, open the admin page in a browser (default:9090), confirm both backends' healthz are green. - Business does nothing — Agents still connect to the old
oap-host:11800, which is now the proxy; the same traces flow into both OAP and DataBuff — no ConfigMap change, no rolling restart of Pods.
Turning off SkyWalking ingestion = the first step of shifting traffic to DataBuff; both on = comparison period. The toggle takes effect immediately and is written back to config. Rollback is just as simple: stop proxy, let OAP reclaim :11800.
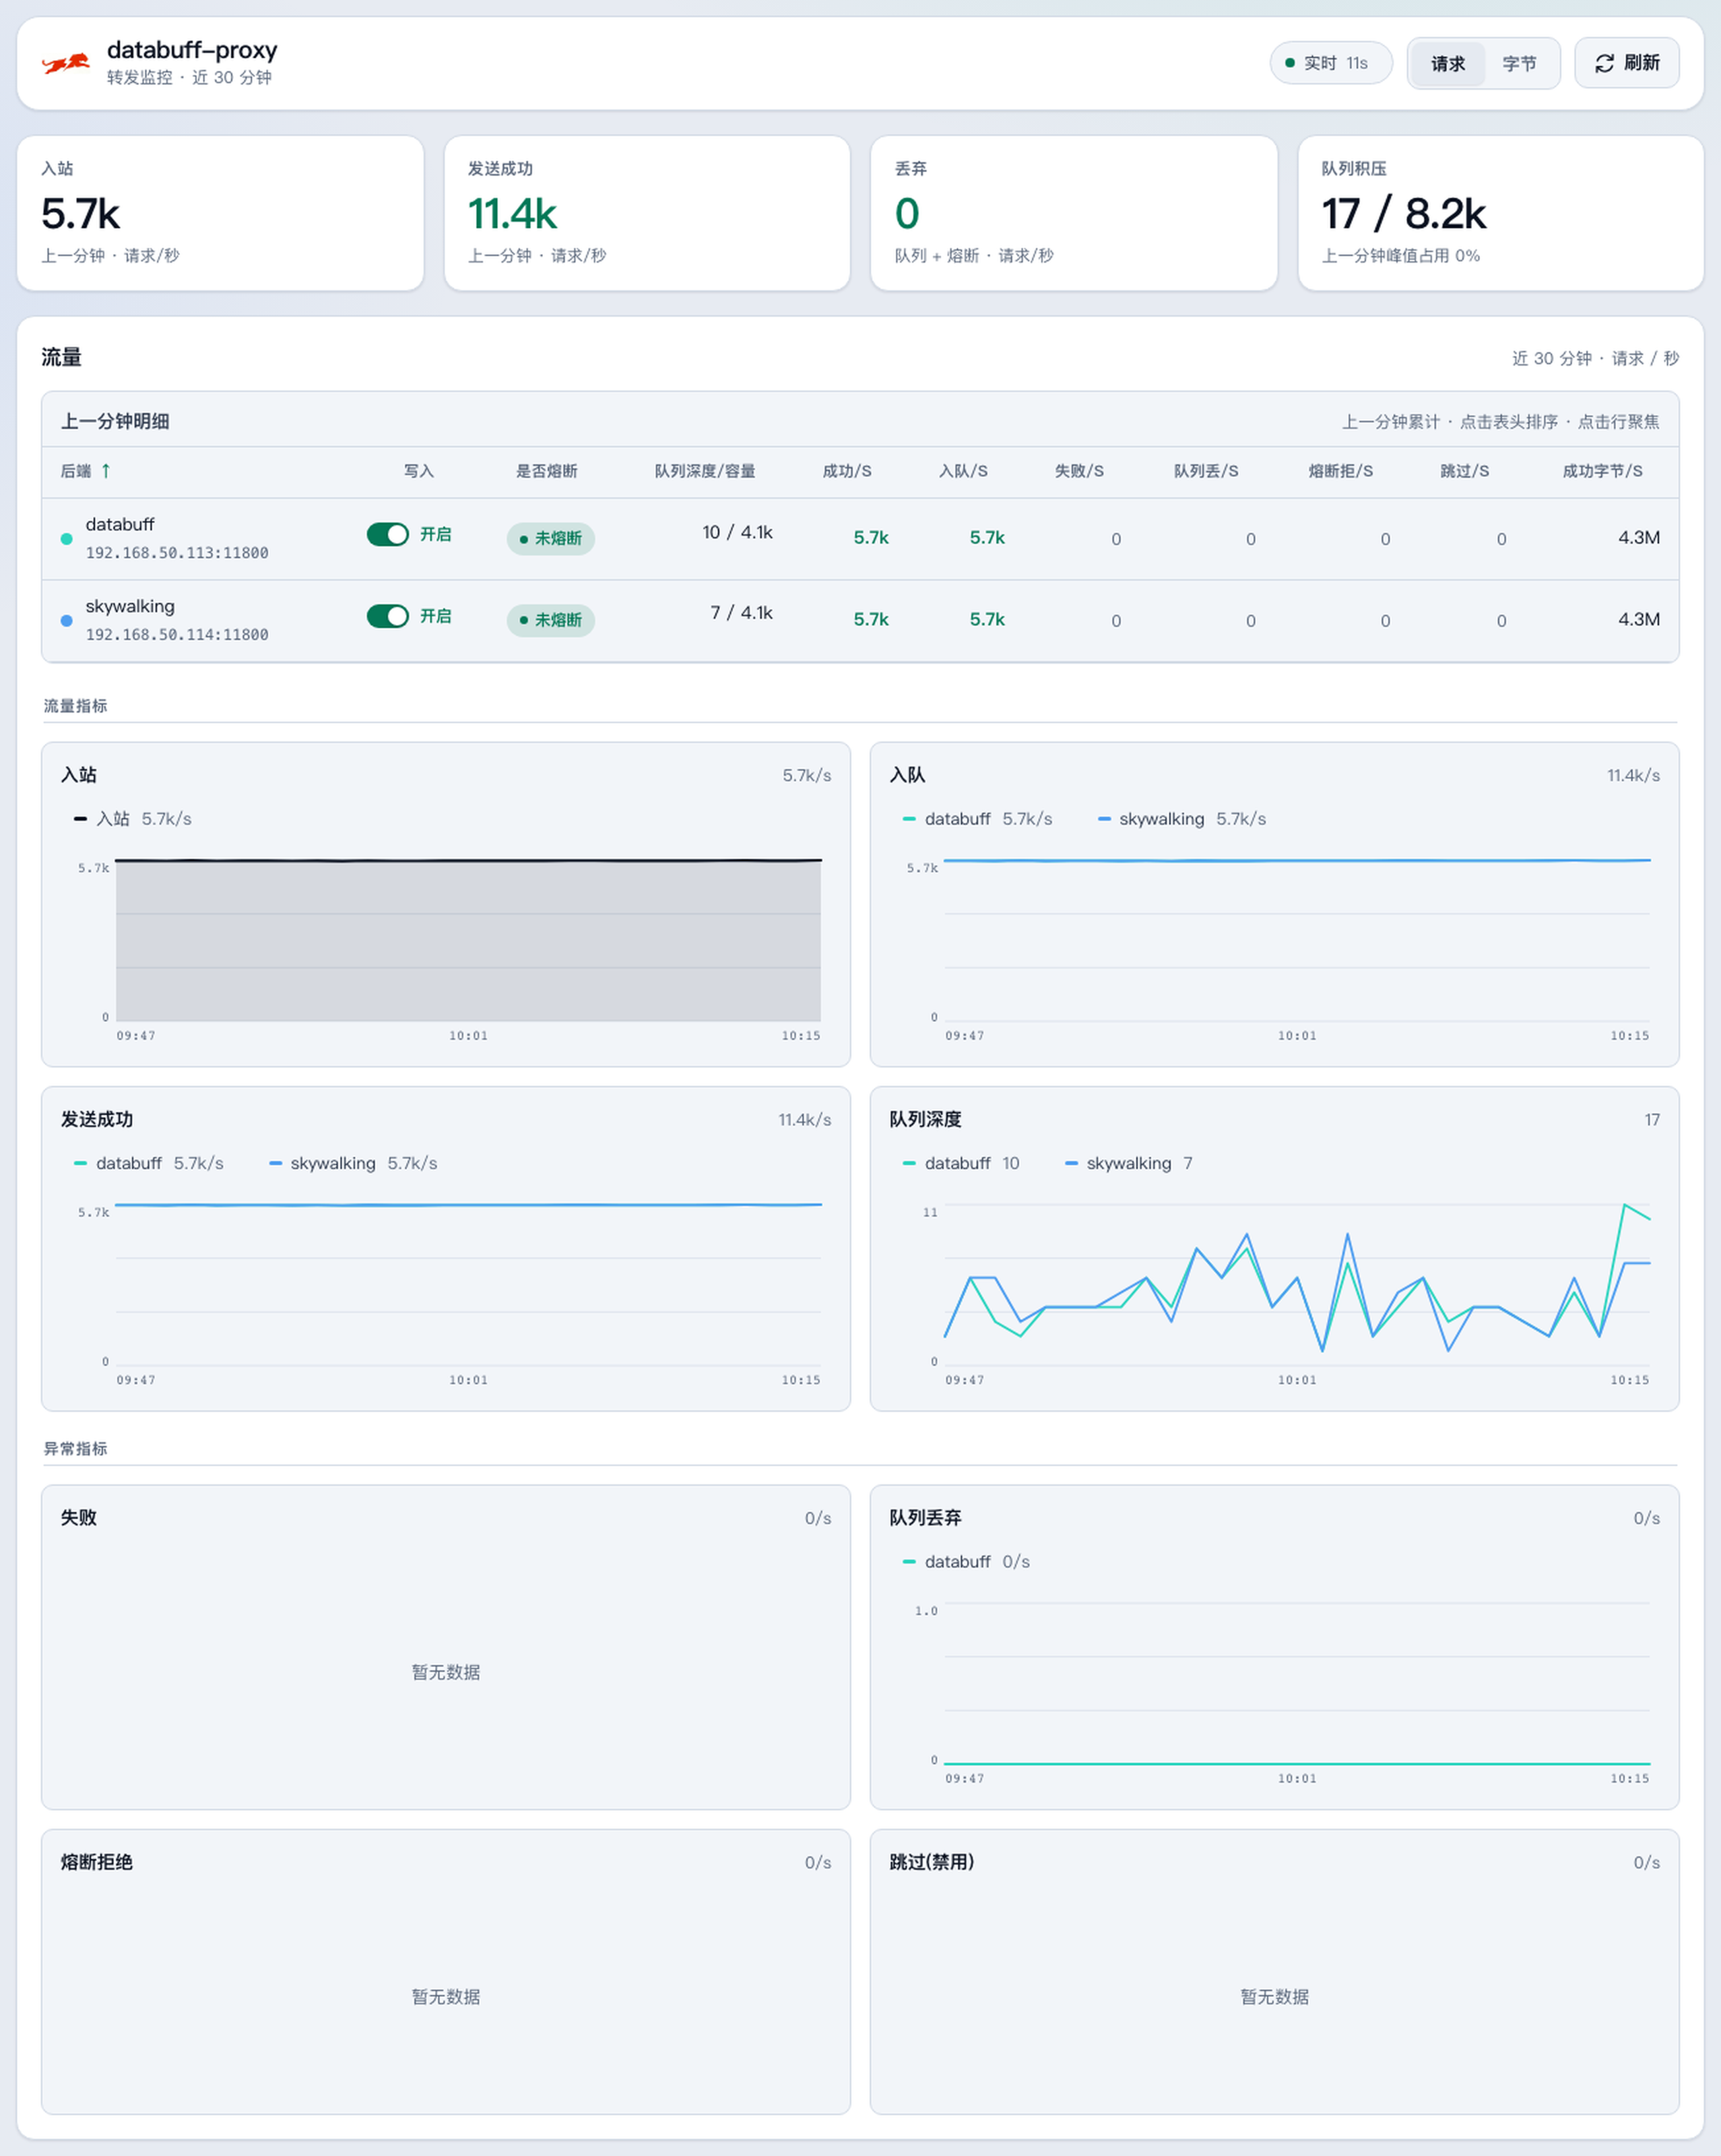
We validated dual-write in a load-test environment (workload QPS=35, 43 Pods):
- Each sink forwarded about 5,800 segments/s successfully, sent_err=0, dropped=0
- Call counts across four services aligned ≥99.98%
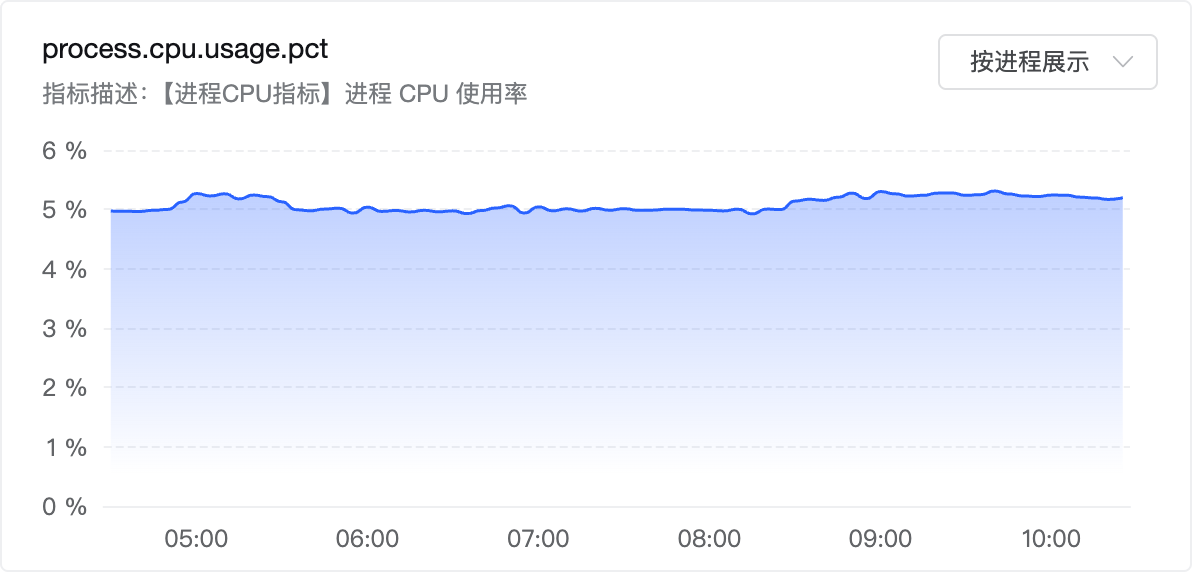
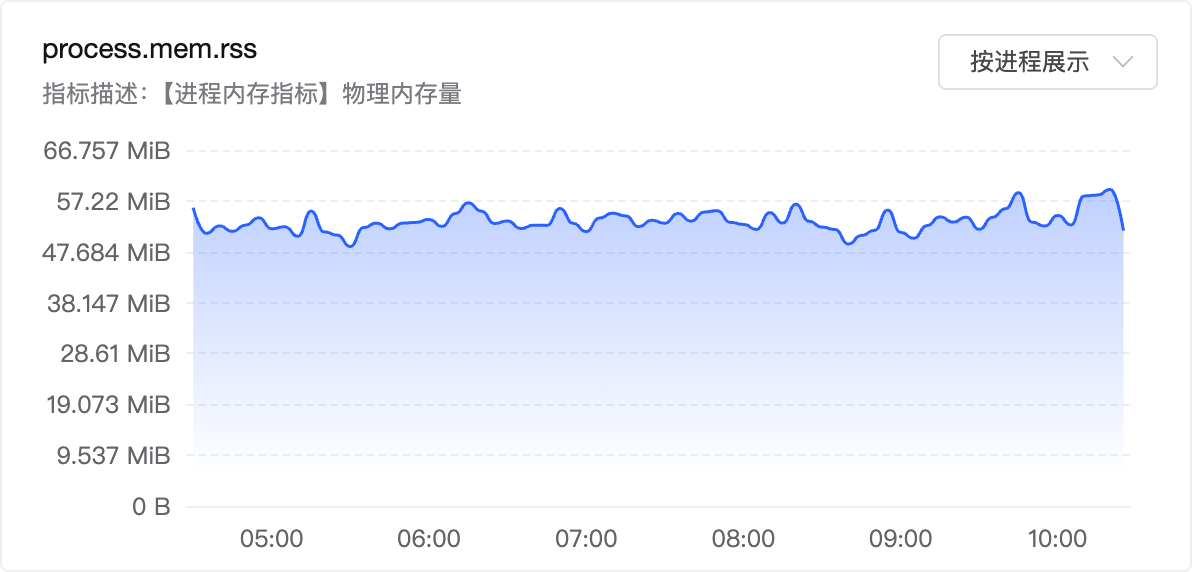
- proxy used <1 core, ~63MB memory, stable for 10+ hours overnight
- One backend down → the bad sink circuit-breaks, the other continues; turn one off in admin → writes stop immediately
- 🔀 Dual-write — same traces, compared on both sides
- 🛡️ Rollbackable — turn off either sink in seconds from admin
- ⚡ Lightweight — proxy <1 core · ~63MB
Do we have to replace the Agents? Change the report address?
Neither. Keep your existing SkyWalking Agents; since collector.backend_service already points at OAP's :11800, once proxy takes over that port there's zero change on the business side. When the comparison period ends and you keep only DataBuff, you can then decide to point Agents directly at DataBuff or keep going through proxy as a single sink.
Do business Pods need a rolling restart?
No — through comparison, traffic shift, and OAP retirement, you never need to rolling-restart business Pods for this. Agents keep connecting to oap-host:11800; once proxy takes over on the platform side, business config is untouched. Only the OAP host changes: OAP moves port, proxy takes :11800.
Do we have to stop OAP right away?
Not required. During dual-write, OAP is your control group; once you're satisfied with DataBuff's querying, inspection, and service-flow, turn off SW ingestion in the admin page — no need to retire OAP immediately.
What about historical traces and alerts?
Historical data and old alert rules in OAP won't migrate automatically; they need to be reconfigured in DataBuff — this is independent of dual-write and is a step in any backend switch.
How would you suggest trying it?
- Run proxy dual-write for a week; follow the same slow request on both sides
- Ask DataBuff "any anomalies for service-a in the last hour" and run an inspection
- Open service-flow / call analysis and see if entry-to-trace takes fewer clicks