1. Theoretical Foundations of Full-Link Tracing
Align concepts before implementation: Dapper supplies the model, OTLP the interchange, Trace/Span the actionable causal chain
1.1 Google Dapper
Modern distributed tracing is usually traced back to Google’s Dapper paper[1]. The problem is simple: after a user request crosses dozens of processes and middleware, where is the “slowness,” and who called whom? Host-local logs cannot answer. Engineers can grep each machine, yet struggle to reassemble those fragments into one business transaction on a single timeline.
Dapper’s key abstractions: a globally unique Trace identifies one end-to-end request; a Span describes one operation (RPC, DB, local method, etc.); parent-child edges stitch Spans into a tree or DAG. Troubleshooting shifts from “search logs on N hosts” to “fetch the call tree by TraceId.” The paper also stresses low-overhead sampling, coexistence with production traffic, and cross-language propagation—constraints that still shape sampling policy and Agent design.
Later systems such as Zipkin, Jaeger, and SkyWalking differ in formats and storage, but the narrative remains Dapper-aligned: without a stable Trace identity there is no aggregable topology; without Span boundaries there is no accountable latency. Understanding Dapper is like getting the shared dictionary behind every APM product guide.
1.2 The OTLP Standard
OpenTelemetry Protocol (OTLP) is the telemetry transport defined by the OpenTelemetry project for Traces, Metrics, and Logs between apps, collectors, and backends[2]. Common ports are gRPC 4317 and HTTP 4318. Its value is not “another binary format,” but converging proprietary reporting channels into an interchangeable standard entry so swapping backends does not require rewriting business probes.
For evaluators: the app side can migrate toward OTel SDK/Agent, while backends consume OTLP and/or historical protocols. Apache SkyWalking itself accepts multiple probes and third-party formats; platforms that treat Native OTLP as the default data plane (such as DataBuff) put OTLP first. Understanding OTLP means understanding that probe protocols and analysis platforms can evolve independently—the key step from “bound to one Agent” to “standardized signals” in cloud-native observability.
Note: OTLP solves how to transmit, not automatic semantic completeness. Without shared service naming, resource attributes, and propagation conventions, a standard protocol still yields “duplicate same-named services” and cross-language broken chains. That is why service name and backend address—humble-looking settings—keep showing up when discussing SkyWalking and DataBuff ingest.
1.3 Core Principles of Trace Linking
Whether SkyWalking Segments or OTel Spans, on-call engineers rely on the same mechanisms—distributed “causal bookkeeping”: record first, aggregate next, then visualization and intelligent Q&A.
- TraceId: global ID across the request lifecycle; primary key for aggregation. Without it, cross-process events cannot merge into one transaction.
- SpanId / parent-child: identify the current and parent operations; across processes the parent Span is upstream and the child downstream, joined by injected context headers. Parent edges decide whether the waterfall restores the real path.
- Sampling: full retention at high QPS is unrealistic; the entry decides whether to sample and propagates that decision to avoid half-chains. Error or forced sampling is common in incident reviews.
- Context propagation: restore ThreadLocal across threads with snapshots; across processes write TraceId/SpanId into HTTP headers, RPC attachments, or MQ properties (SkyWalking Java often uses the
sw8header). Async pools and message queues are hotspots for broken chains. - RED metrics: Rate / Errors / Duration often derive from Traces or companion meters—the statistical base for topology coloring, alert thresholds, and AI Q&A.
An end-to-end chain: entry creates TraceId and root Span → in-process child Spans → outbound injects context → downstream extracts and continues → backend assembles the tree by TraceId. Any failure may show as a blank UI, missing topology edges, or AI answering “no data.” Master these five steps before reading SkyWalking’s Agent and OAP, or you stay at “I can click the UI.”
Engineering intuition: Traces answer “what happened this time”; service-level RED from Trace/Meter answers “how did this window look overall.” Full-link monitoring needs both granularities—waterfalls alone drown on-call in detail; dashboards alone miss the root Span. AI Q&A essentially routes natural language between those two levels.
As a troubleshooting checklist, verify in order: (1) entry generates TraceId; (2) outbound injects propagation headers; (3) downstream extracts and continues; (4) sampling decisions are consistent end-to-end; (5) the backend can assemble a complete tree by TraceId. Failure at any step makes topology, waterfalls, and AI Q&A “look broken,” while the root cause is still propagation or sampling.
2. SkyWalking Architecture Walkthrough
Probe → OAP analysis → Storage → UI query; layered duties define extension and troubleshooting paths
Apache SkyWalking organizes observability into probe, OAP, storage, and UI layers[3]. Versus lightweight “store Zipkin Spans only” designs, it covers tracing, metrics, logs, profiling, and events in one platform—suited as a daily on-call entry, not a one-off script. Layering lets collection vary by language, analysis scale horizontally, storage trade cost for query performance, and UI iterate independently.
2.1 Probe (Agent): Non-intrusive Bytecode Enhancement and Reporting
The Java Agent loads via -javaagent before the app starts, using JVM Instrumentation and bytecode enhancement (commonly ByteBuddy) to intercept framework entry points, create Spans, record latency and tags without business code changes, then report asynchronously[4]. Plugins split by framework (HTTP, RPC, JDBC, MQ, etc.); trimming plugins shrinks the enhancement surface. For ops, “non-intrusive” means the release pipeline only appends JVM flags and config—no business repo edits.
Classic reporting uses SkyWalking native gRPC to the collector (default port 11800). The Agent also ships JVM metrics, optional logs, and instance metadata so the same instance shows traces plus heap/GC signals in the UI. Service name and backend address are the minimum required: wrong agent.service_name yields hard-to-read instances; wrong backend address means data never reaches the analysis plane.
Bytecode enhancement has a real cost: more enhanced classes mean higher class-load and intercept CPU; niche plugins can conflict with app dependencies. Production practice: validate the plugin set in staging, enable sampling by traffic, and trim non-critical middleware. “Non-intrusive” lowers change cost; it does not equal “zero performance impact.”
2.2 OAP: Analysis, Storage, Query, and UI
OAP (Observability Analysis Platform) is SkyWalking’s analysis core: receive probe data, parse Segments/metrics, build service topology and aggregates, fire alerts, and expose query APIs; the UI (e.g. Horizon) talks via GraphQL and related protocols[3]. Think “streaming analysis + metadata management”: not mere Span forwarding, but correlating Segments into dependency graphs and rolling Endpoint stats.
Storage is pluggable (Elasticsearch, BanyanDB, etc.), directly affecting Trace search latency, retention, and ops cost. Topology and short-window metrics need freshness; long-window Trace search eats indexes and disk. Choose storage for whether on-call queries return within acceptable latency—not only “can it store.”
Two most intuitive views: topology (who depends on whom, which edge turns red) and Traces (filter single requests by Endpoint, status, duration). The former answers blast radius; the latter answers which request. The screenshots below are from the official Demo (logged-in capture) to show what the UI shows after OAP finishes computing.
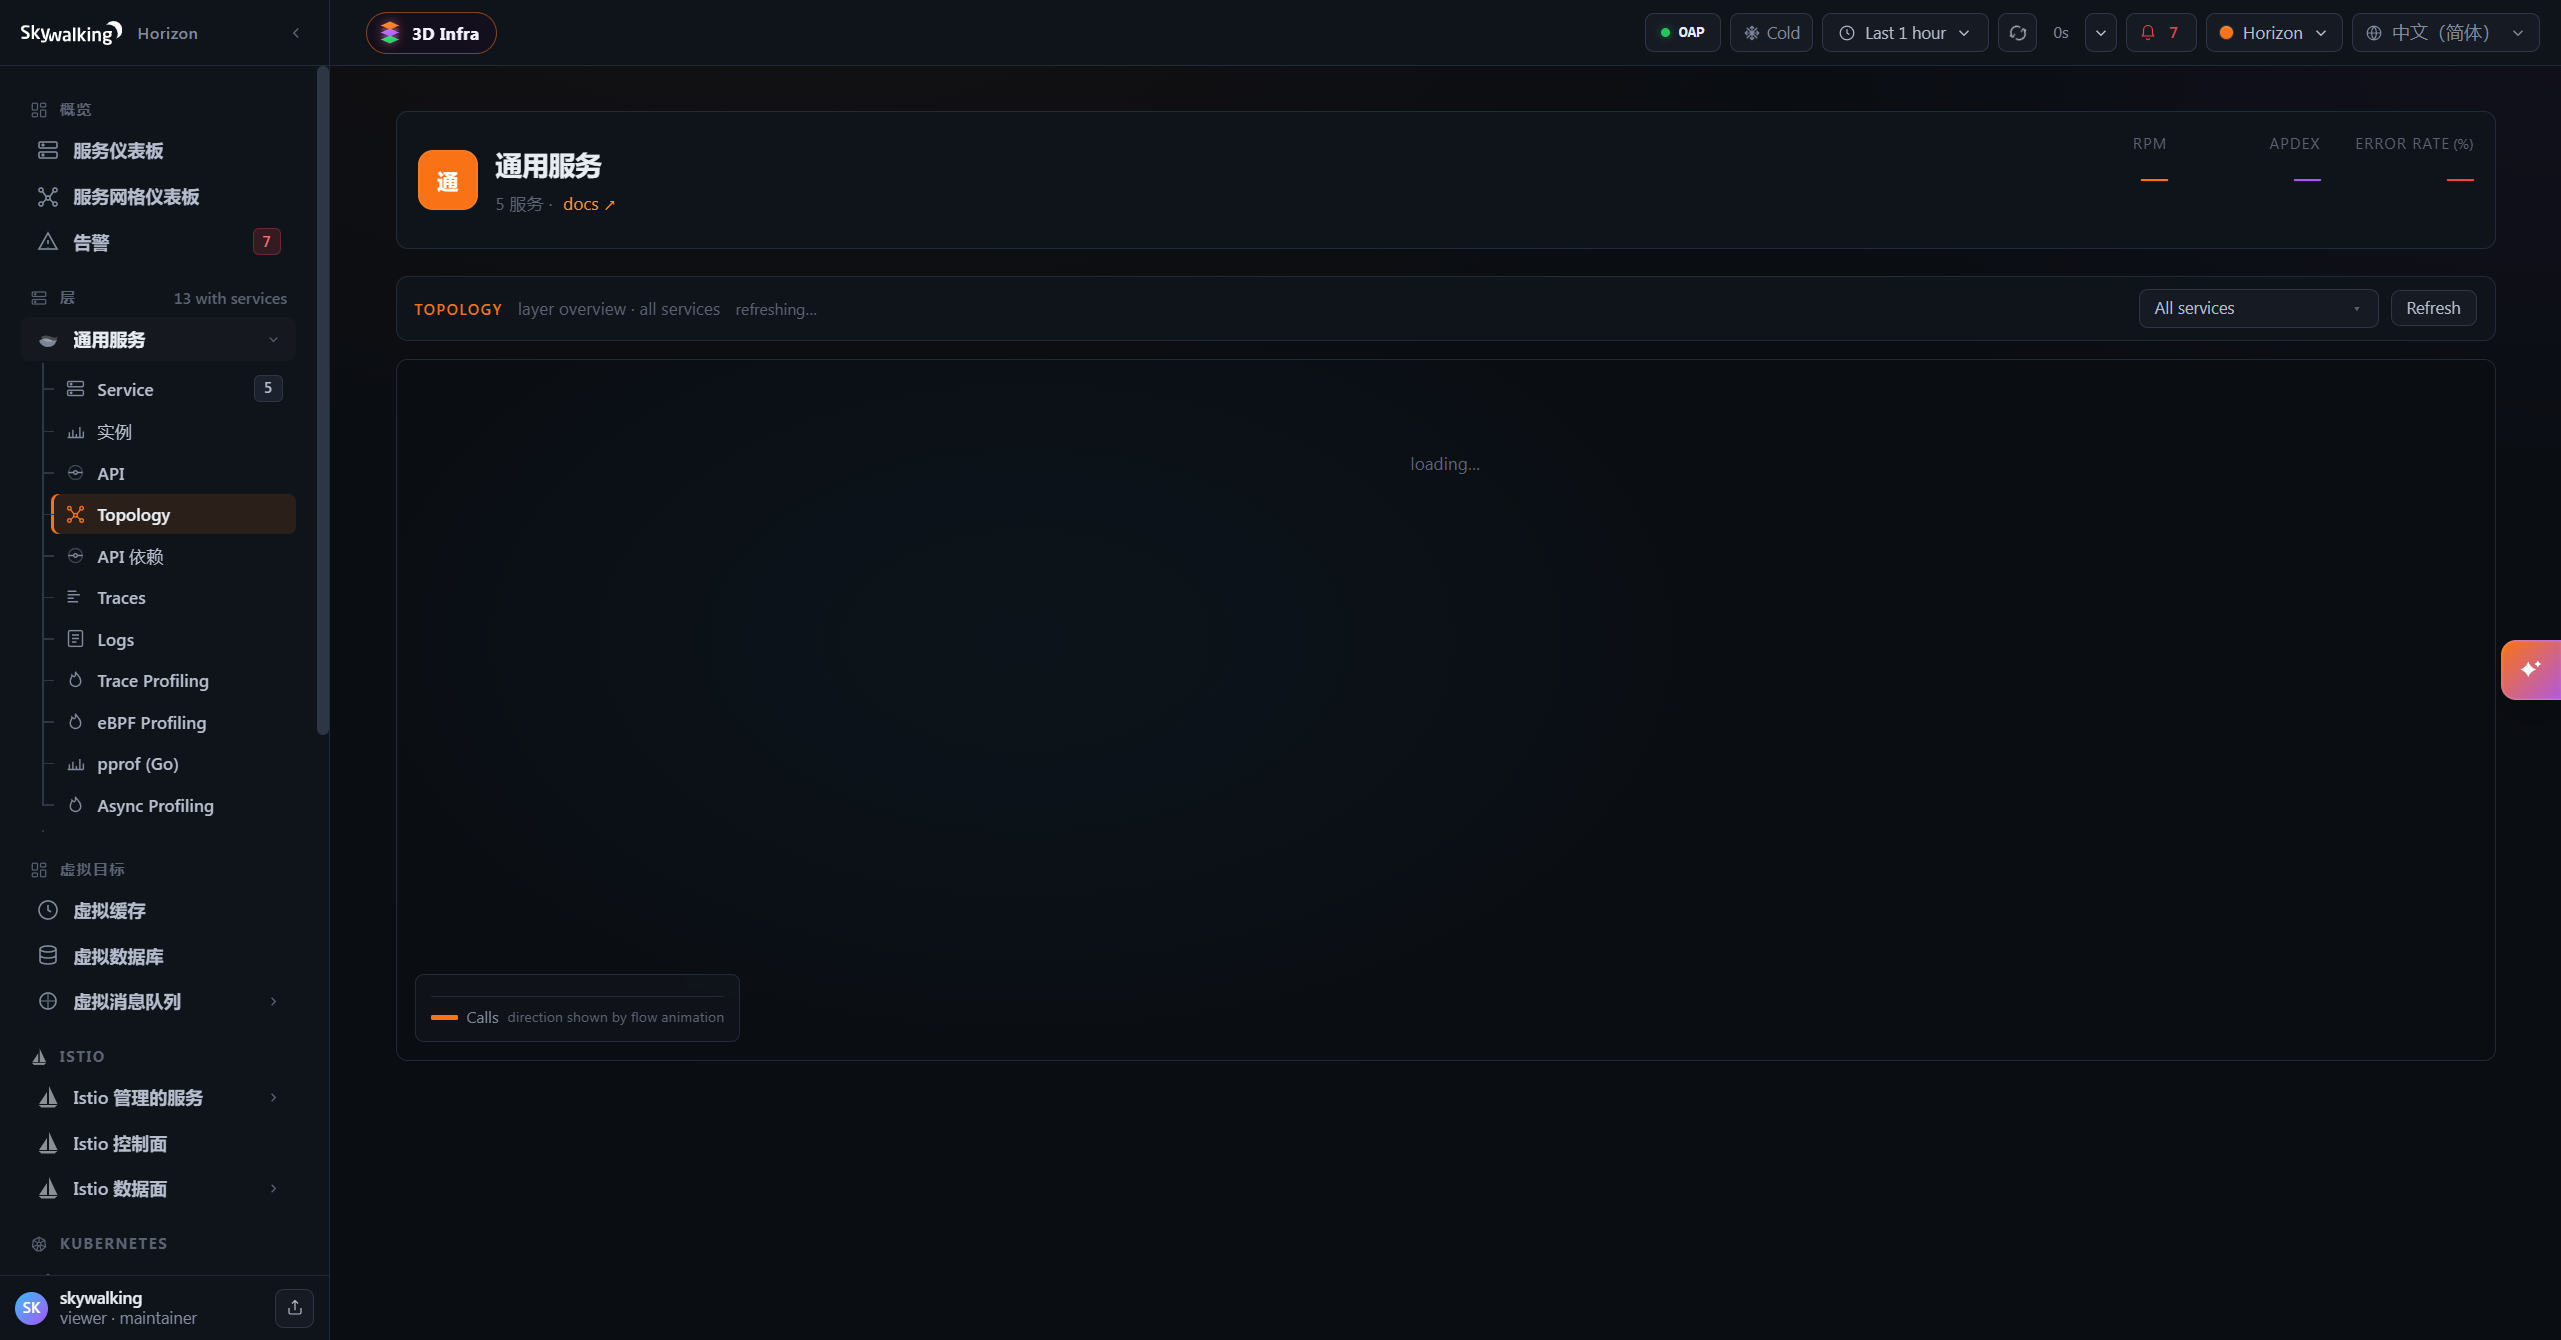
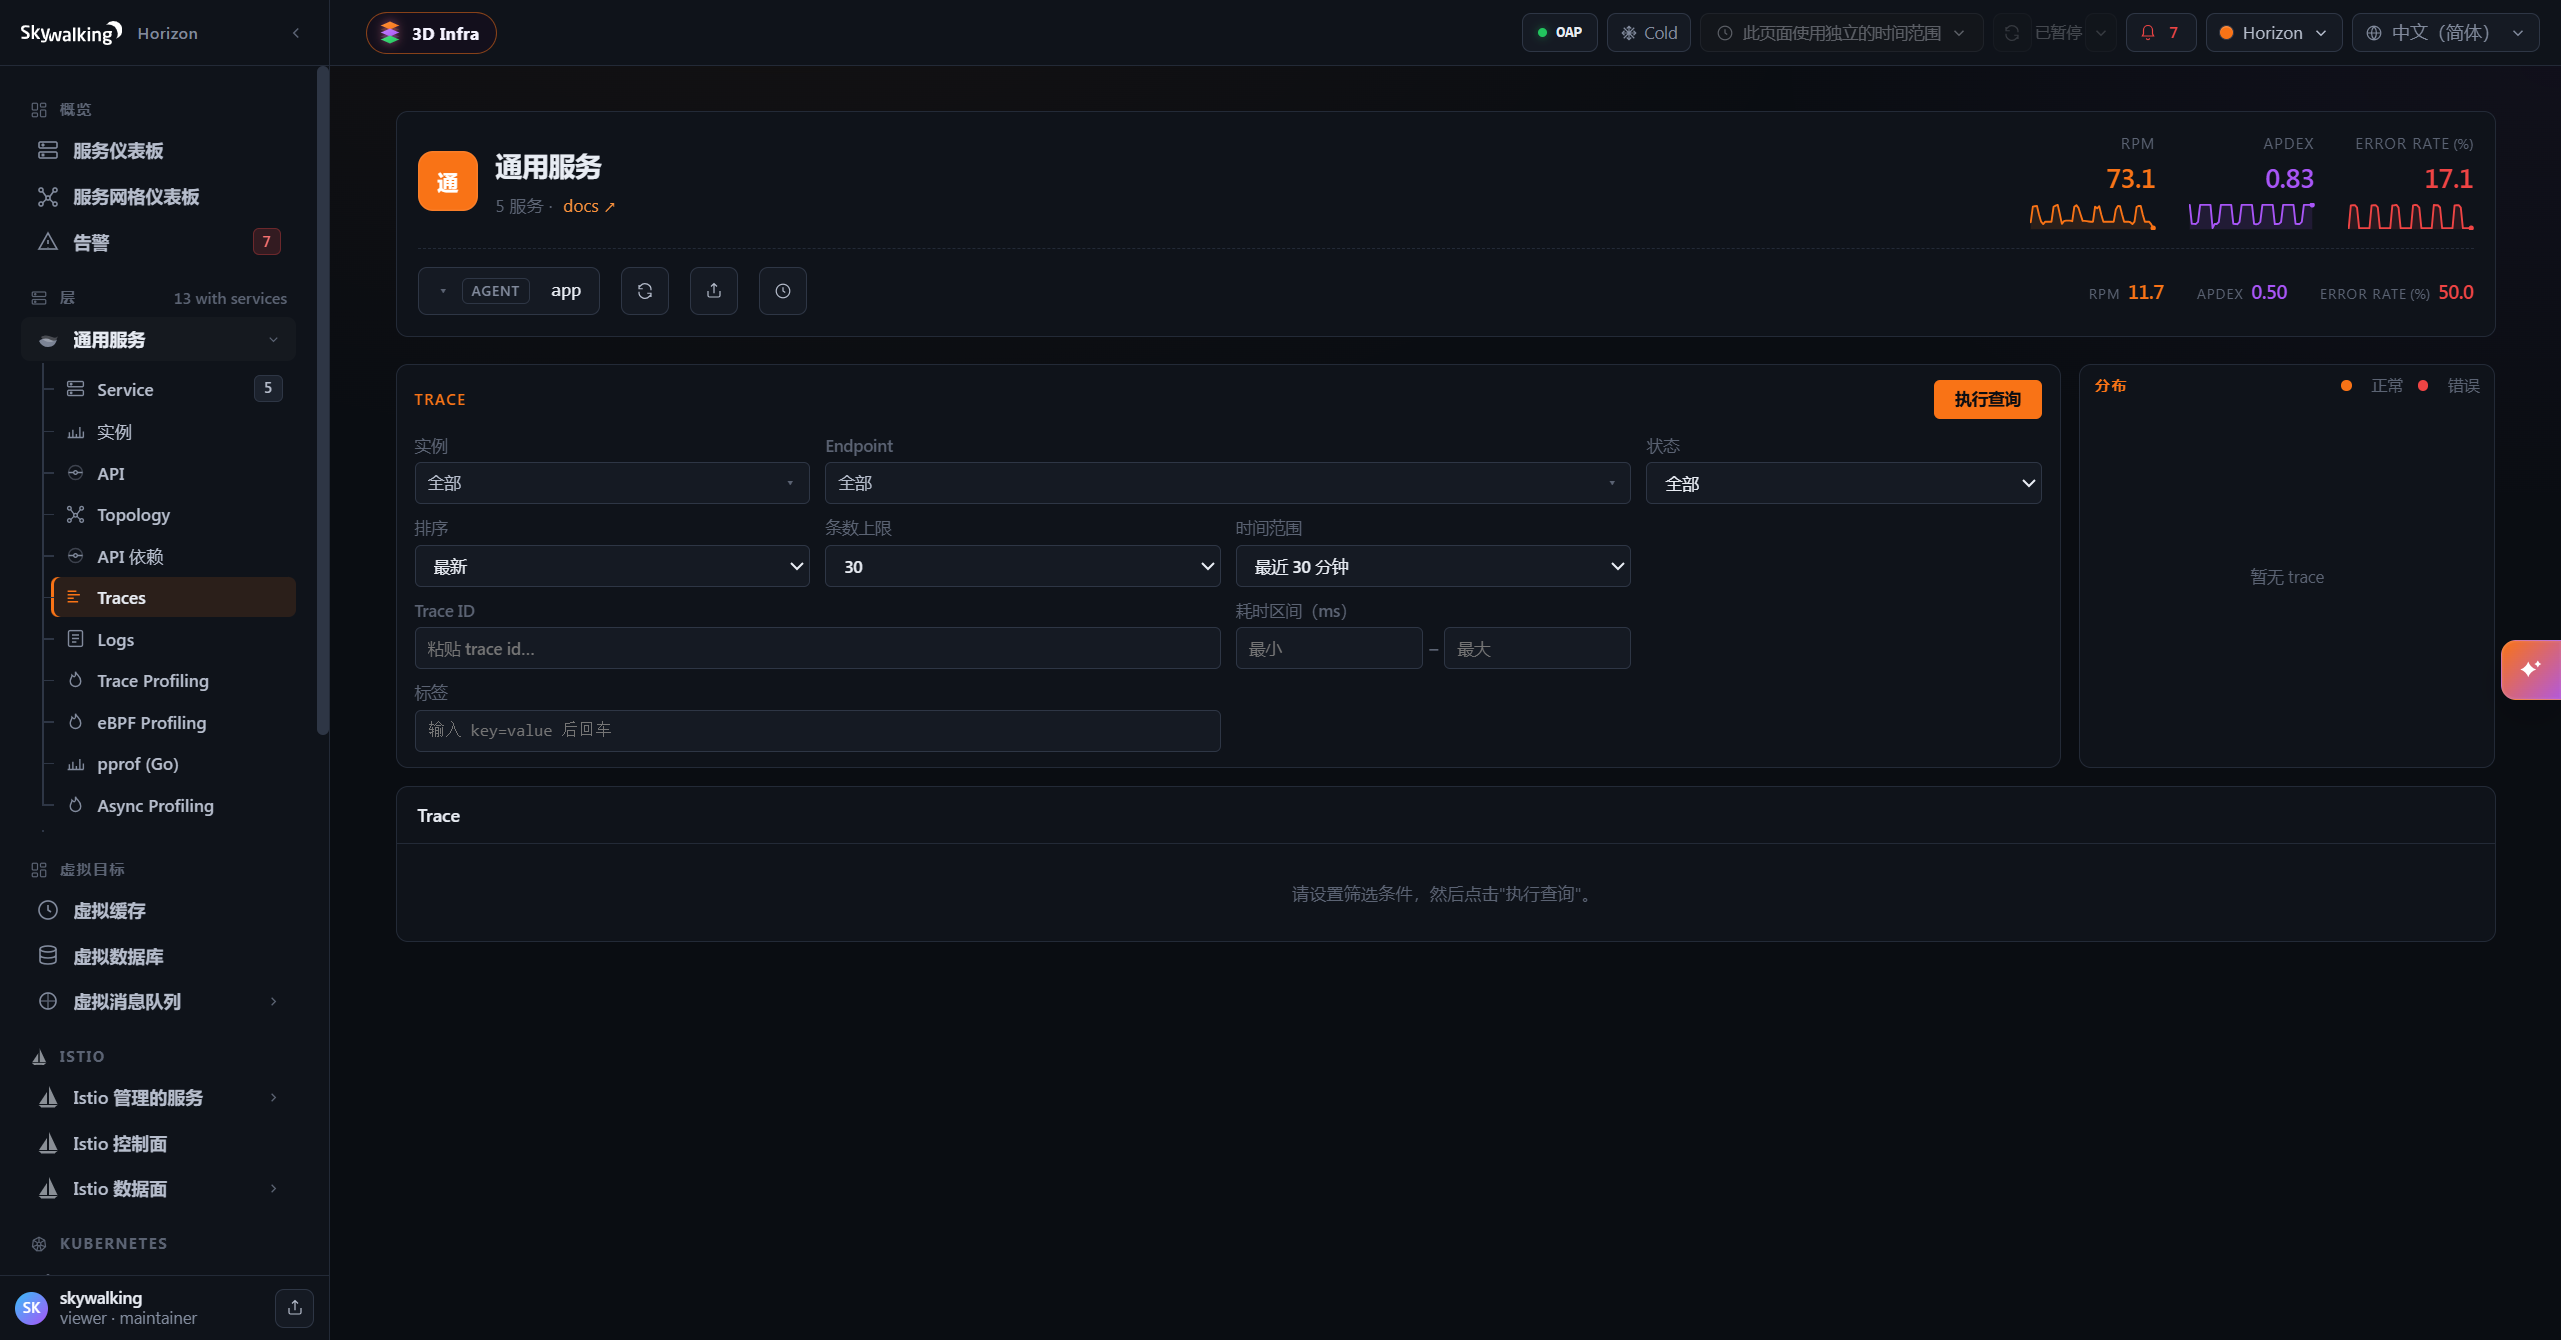
Remember the split for troubleshooting: Agent “collects fully and transmits correctly”; OAP “computes accurately and stores enough”; UI “queries fast.” Misconfiguration in any layer shows as blank topology or incomplete Traces—check Agent backend address and sampling first, then OAP/storage health. With that mental model, §3’s AI Q&A is clearer: AI does not replace OAP; it changes how humans interact with already-analyzed stored data.
Use the official Demo to build a baseline of “what healthy looks like”: identify gateway, business, and dependency nodes in topology, then filter Traces by Endpoint and duration and open a full waterfall. With that muscle memory, when you point the Agent at another analysis backend (e.g. DataBuff Ingest), you can tell “data never arrived” from “arrived with different semantic mapping” faster.
3. How AI Understands and Uses Trace Data
Focus chapter: mapping natural-language questions to Service/Trace/RED, and seamless SkyWalking Agent ingest into DataBuff
Traditional APM leaves humans to “flip” panels; the next question is whether machines can understand on-call language—“which services ran in the last hour, and what is average latency?”—and return verifiable structured results. Generic LLM guessing has limited value; binding answers to real storage queries upgrades full-link monitoring from a visualization tool to a conversational analysis plane. This section uses live DataBuff AI Q&A to show how AI consumes Service, Trace, and RED semantics aligned with SkyWalking, then gives the minimal config to point the native Agent at DataBuff Ingest, plus industry context.
3.1 DataBuff AI Platform — Intelligent Q&A Demo
DataBuff provides an AI platform on unified storage: chat is not open-ended banter—it answers after tool queries against ingested observability data[5]. For traces, the model side needs at least three object types, aligned one-to-one with §1 and §2:
- Service: logical workload name; topology node and metric aggregation dimension. “Which services exist?” is a service catalog / active set query for a time window.
- Trace / Span: causal chain and latency breakdown for one request—“why is it slow?” should land on a concrete TraceId and Span waterfall.
- RED metrics: rate, error rate, latency (mean/percentiles)—“how slow / how many errors?” usually maps to Duration aggregates, not a single Span.
In the live demo, open the AI platform home and ask in natural language, e.g. “Which services ran in the last hour, and what is each average response time?” Intent parsing splits time window, entity type (service list), and measure (average latency) into executable queries, then returns service-dimension aggregates as a table or list—equivalent to opening the service list and scanning the latency column, compressed into one sentence. For on-call, night alerts no longer require recalling menu paths to get the first facts table of service × latency.
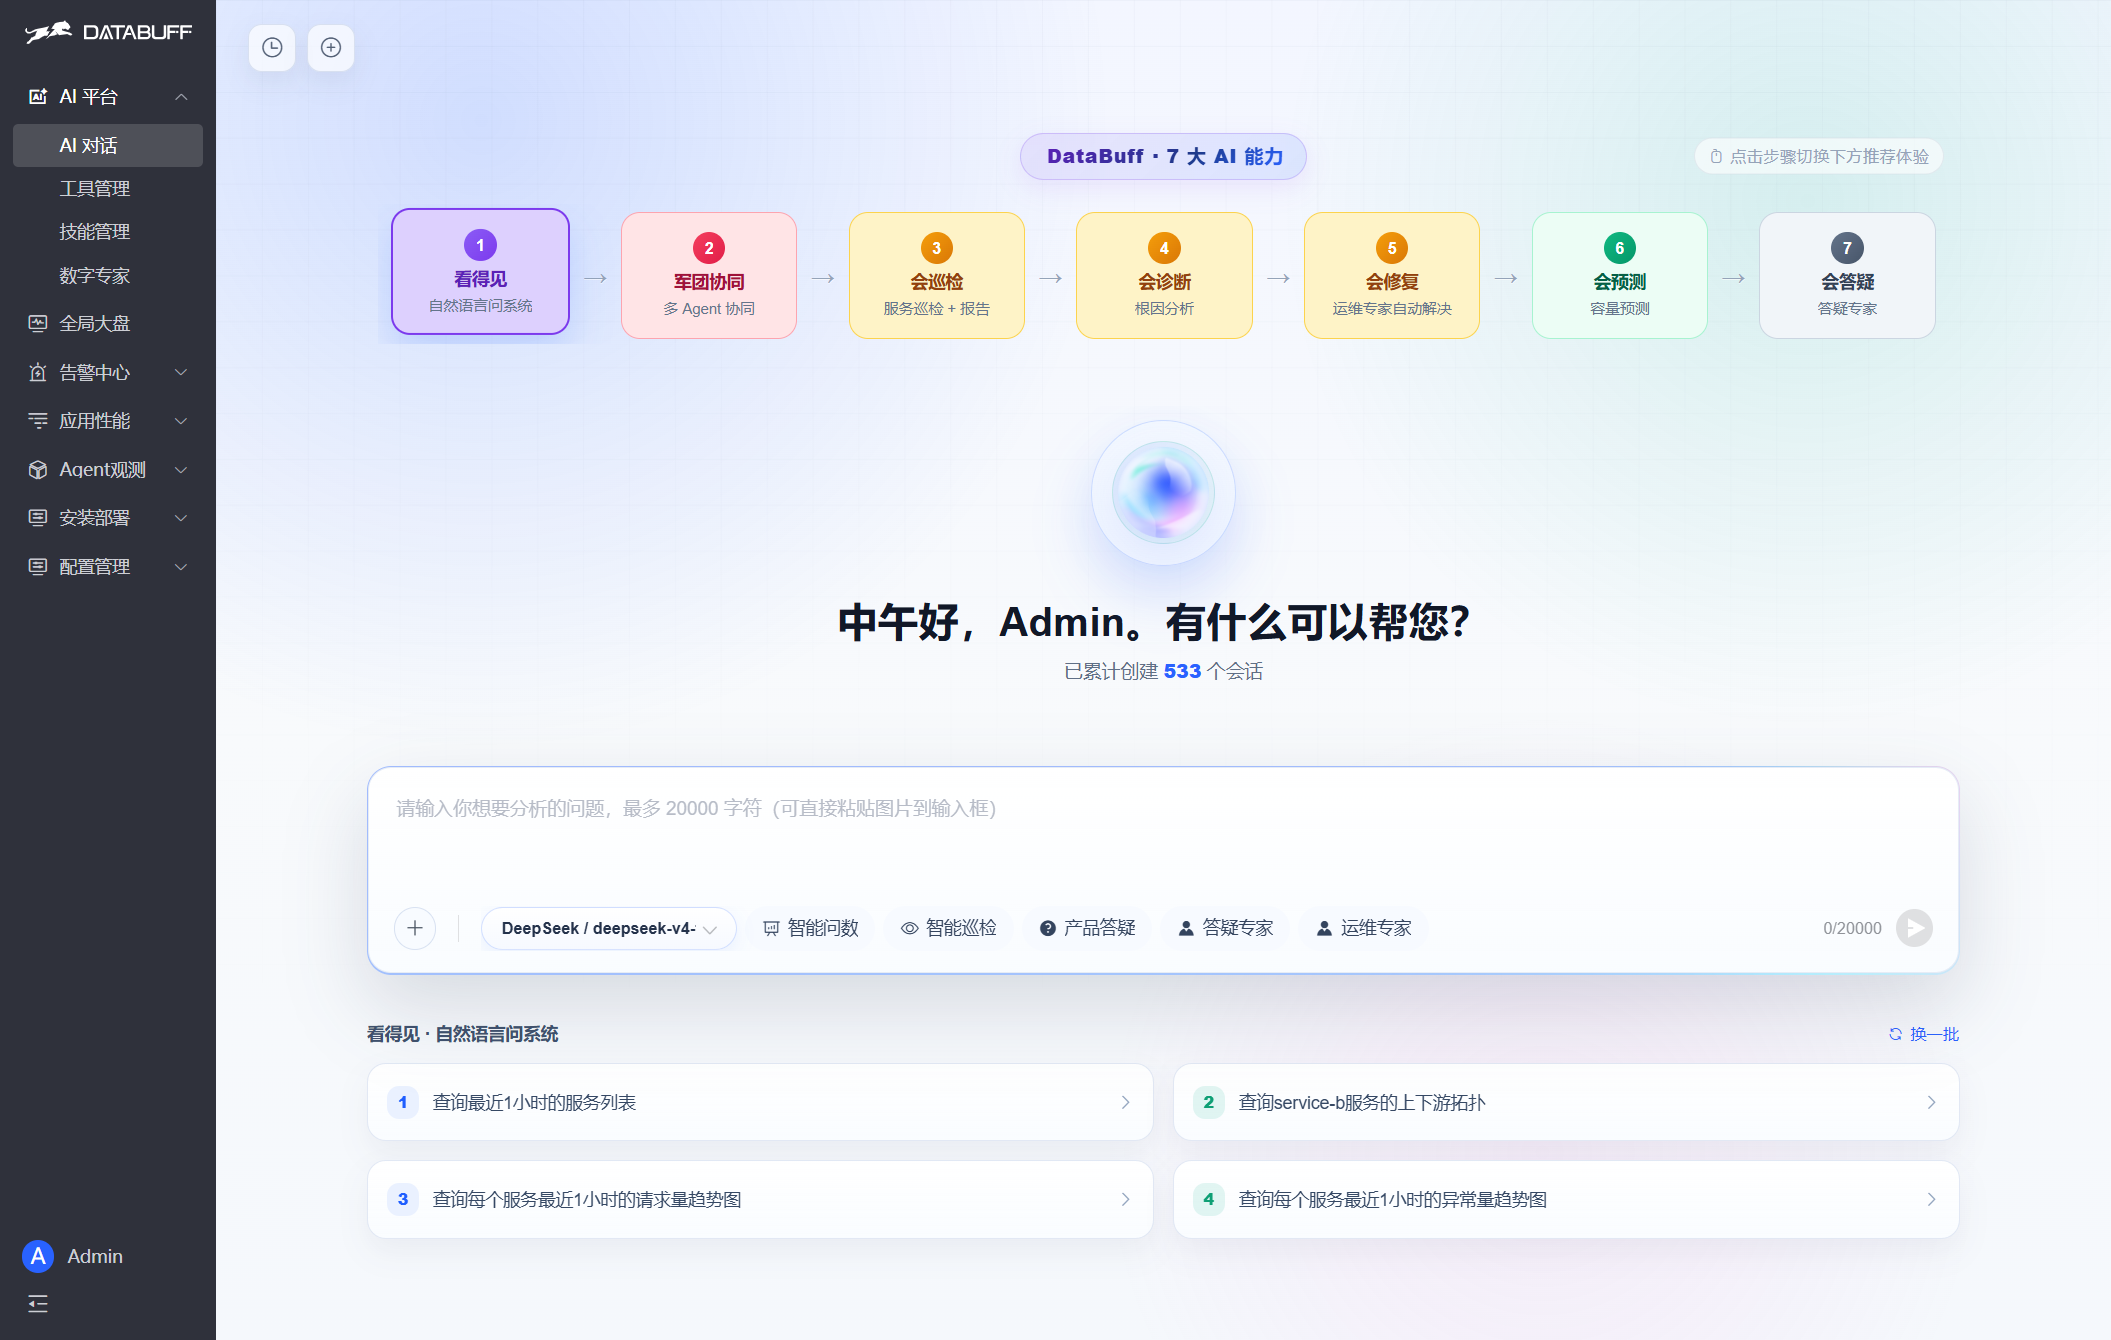
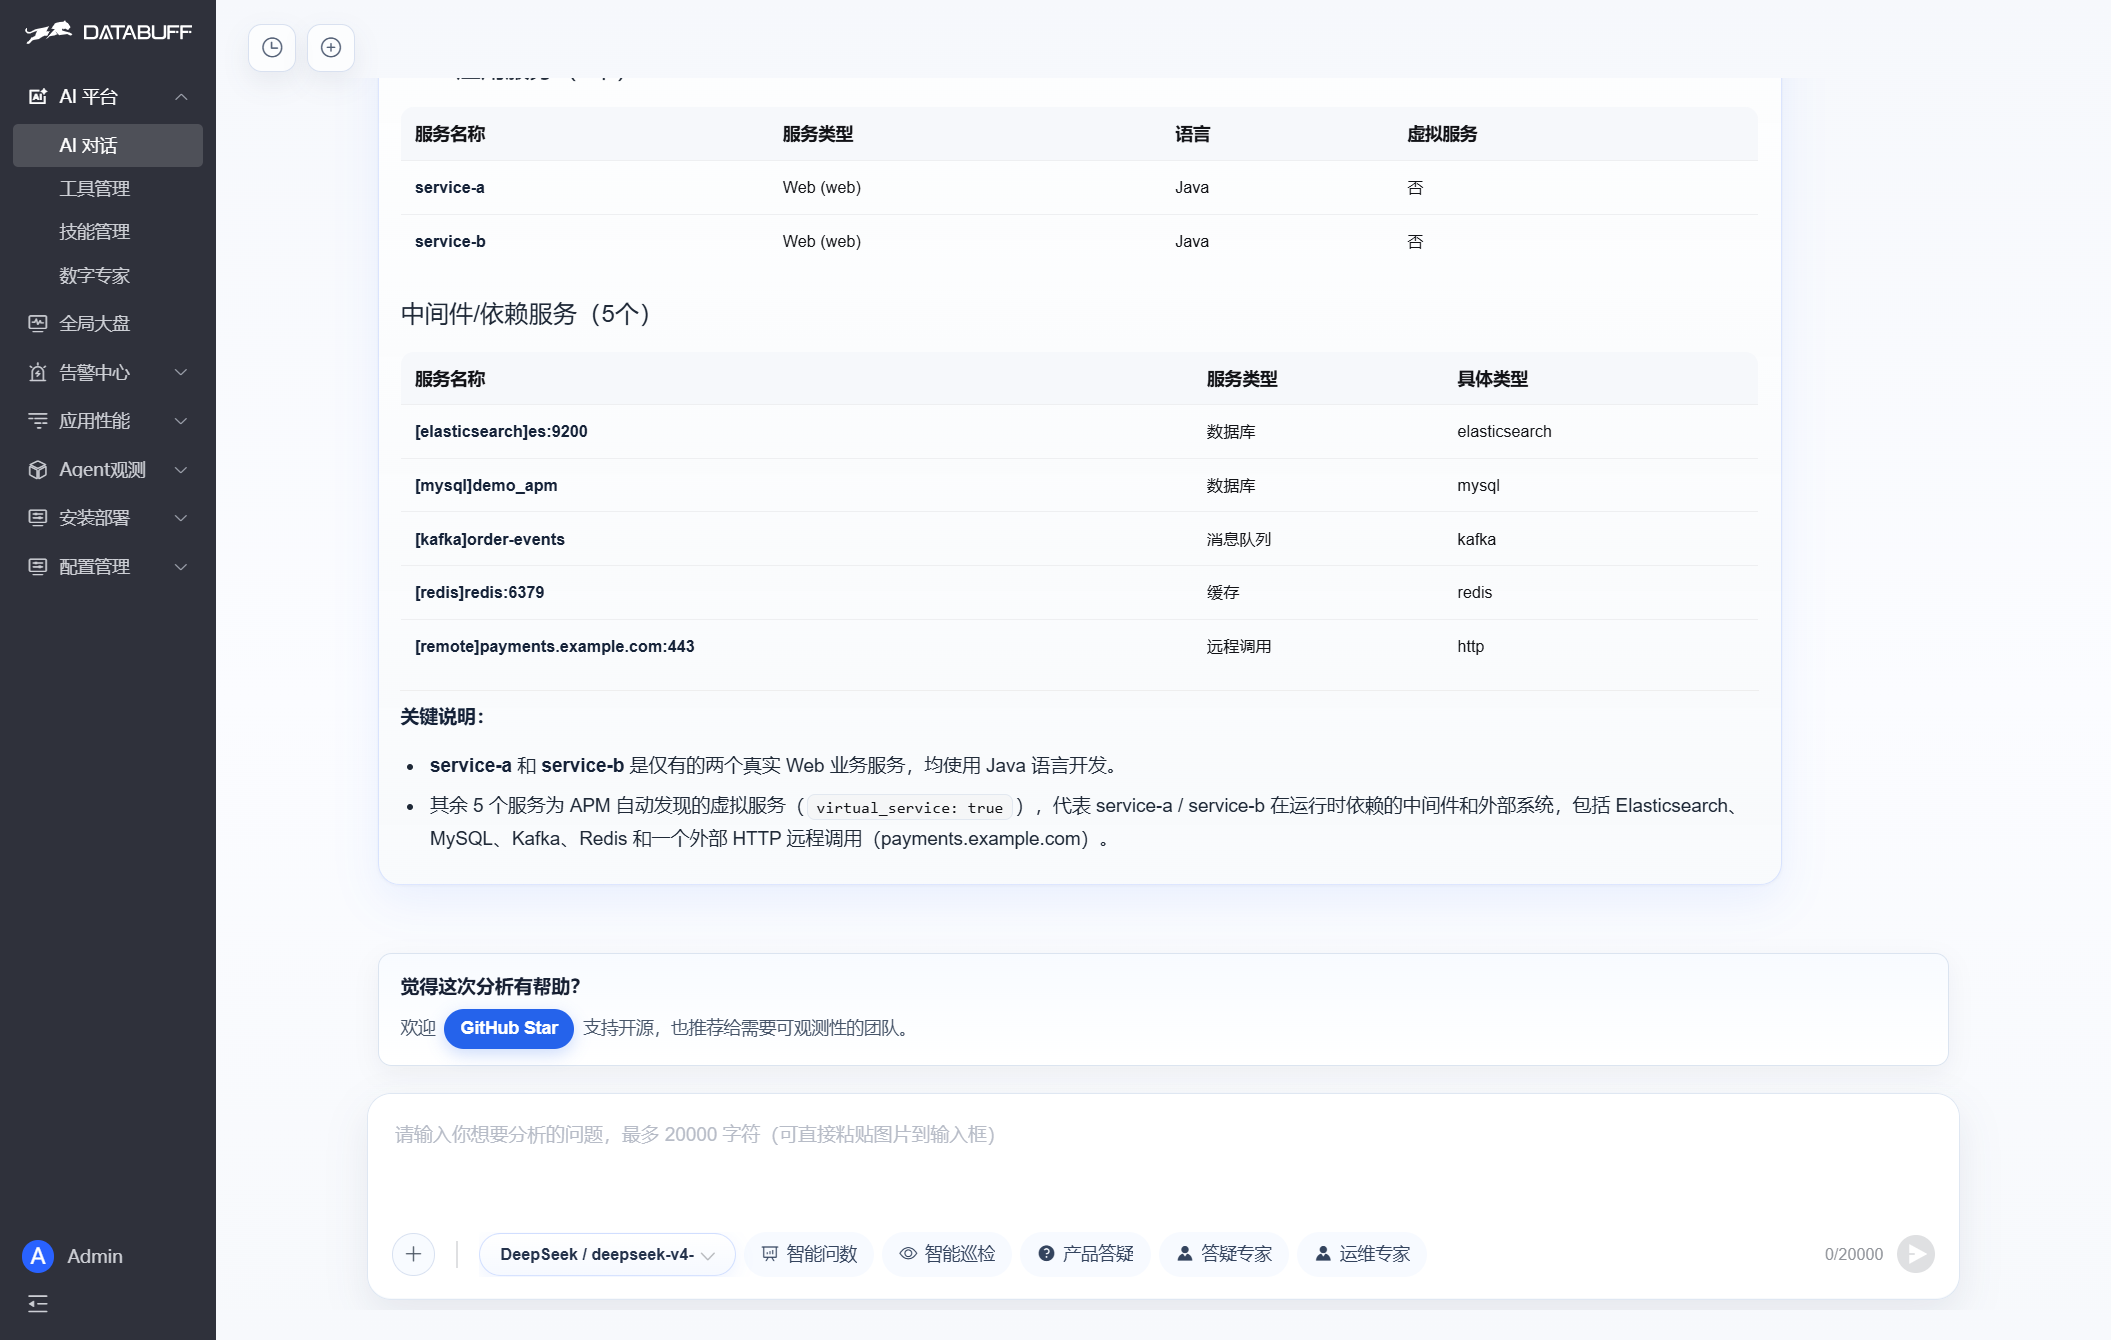
A practical acceptance bar for high-quality Q&A: service names and latency from AI must cross-check against panels in the same window. Compare the service list and trace list under application performance: the former gives service health/latency overview; the latter provides openable Trace detail. If AI claims a service slowed, you should find evidence in both views for the same window—the quality gate that keeps LLMs on observability facts, and the line between “intelligent” and “hallucination.”
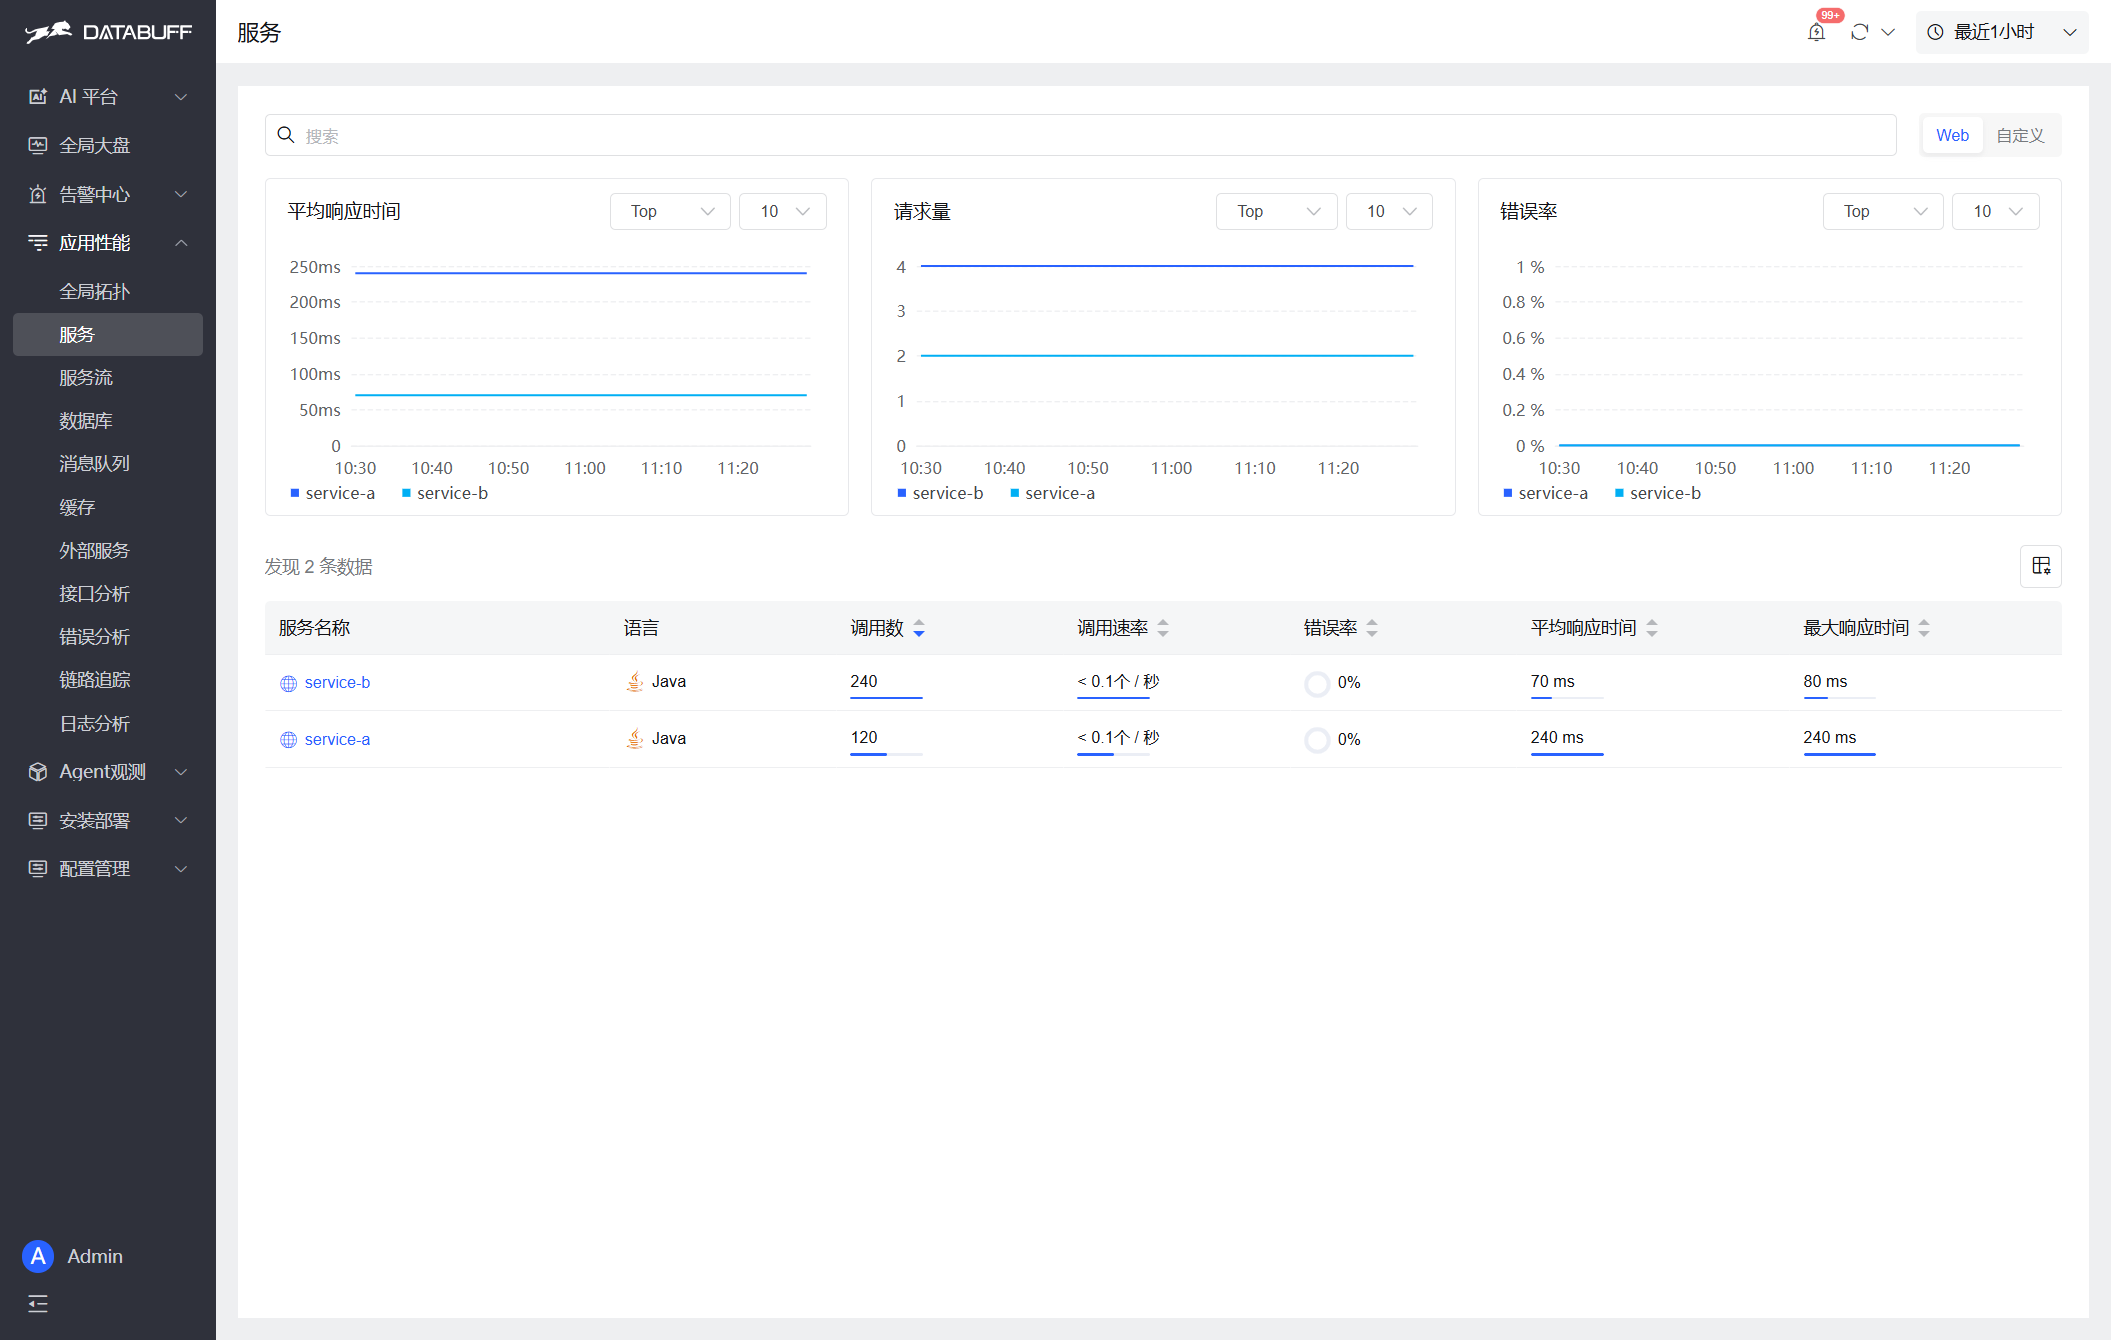
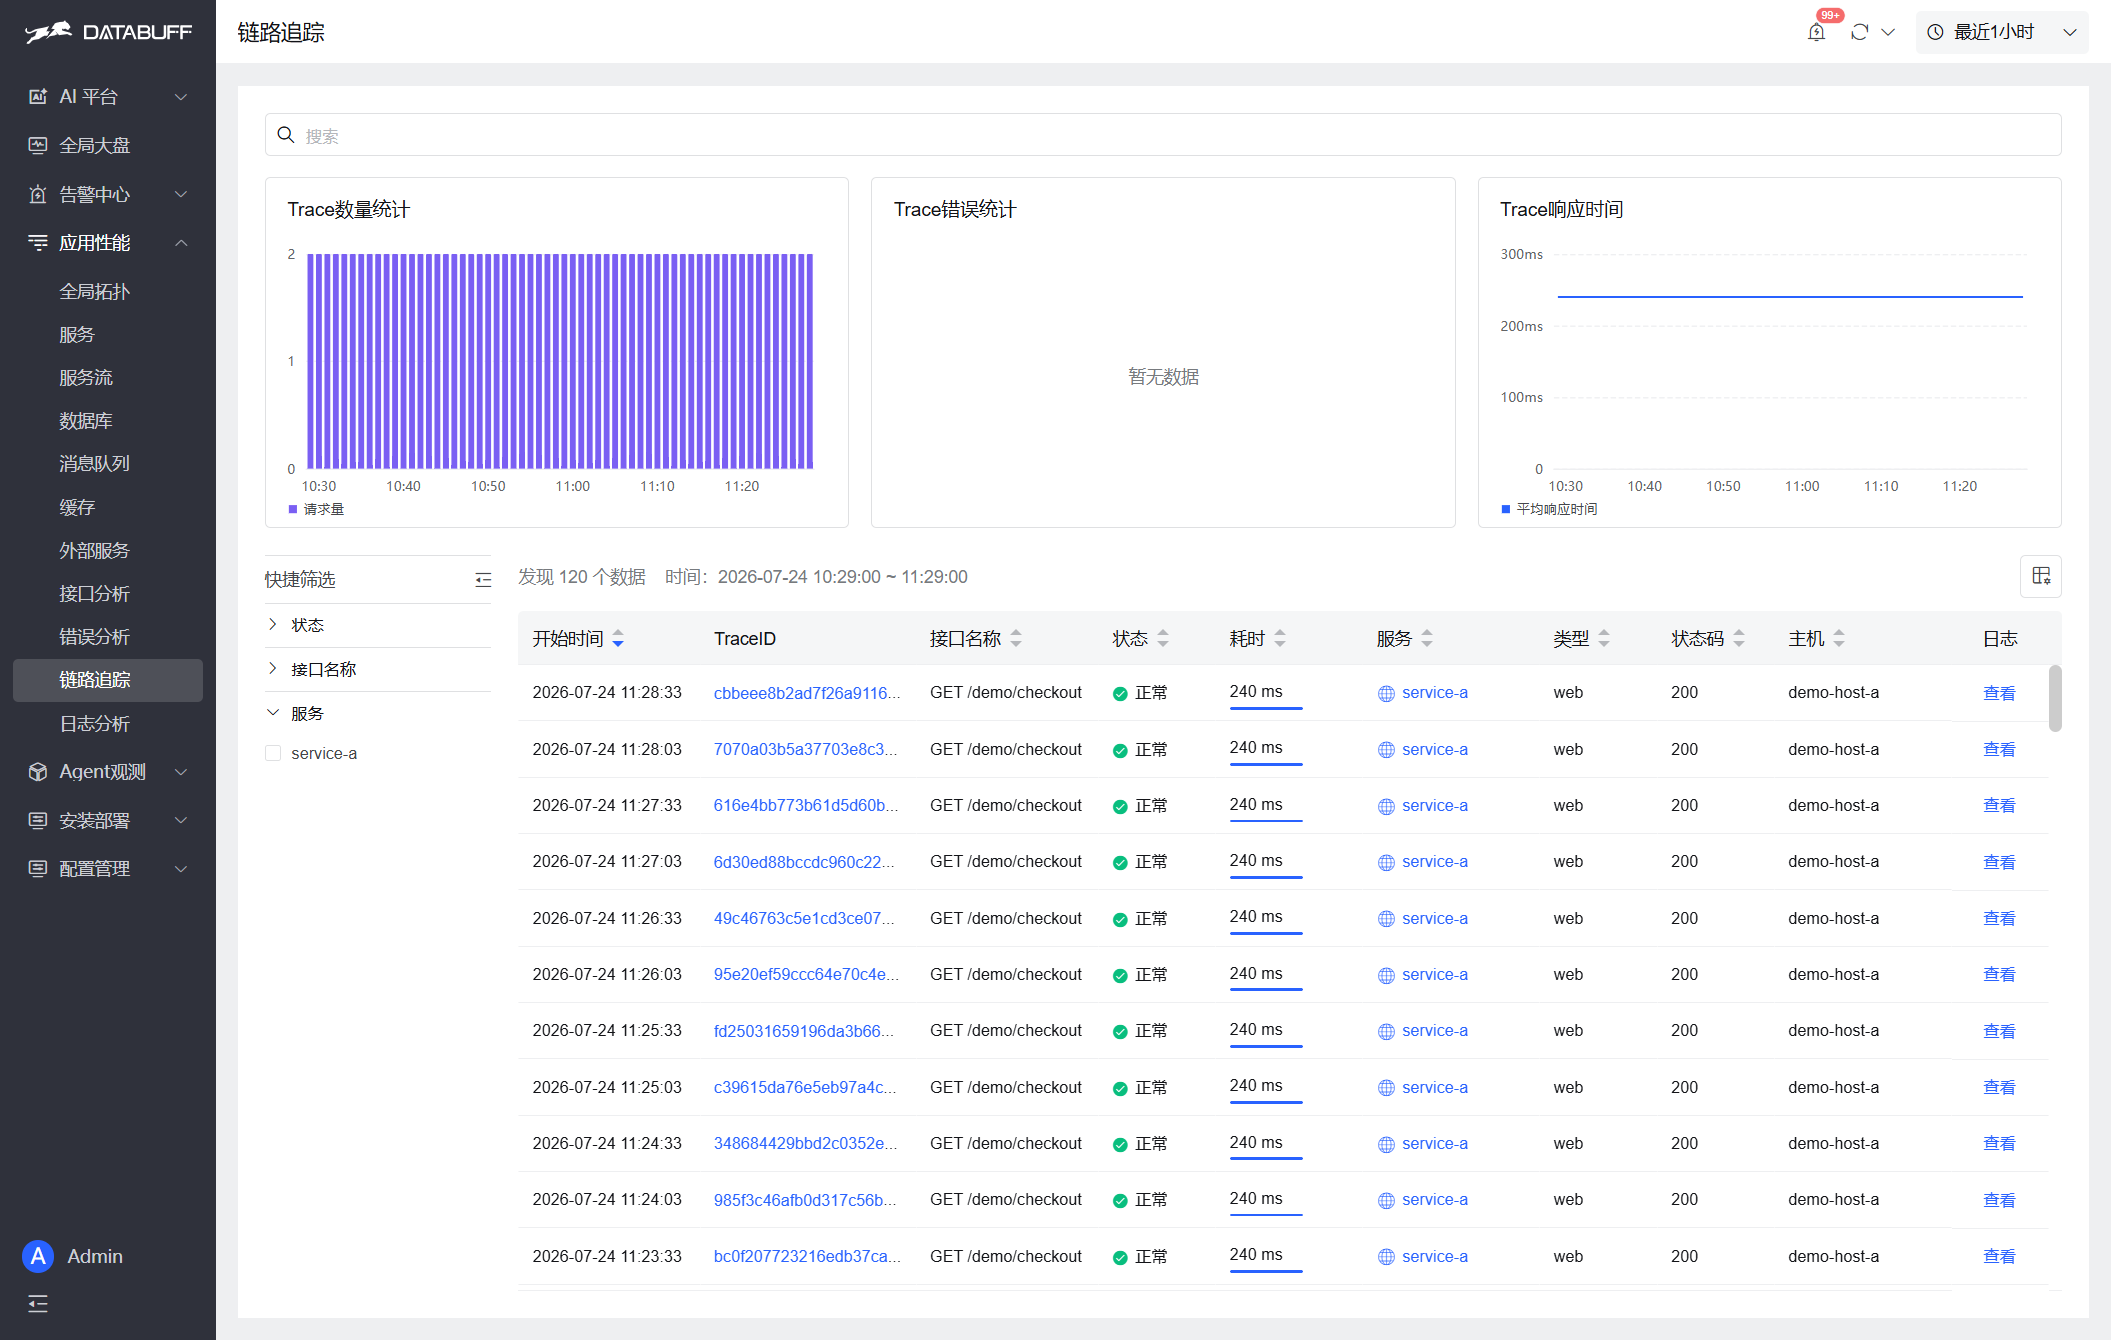
Back to theory: §1’s TraceId/Span tree solves “causality inside one request”; service-level RED solves “overall experience over a window.” AI must use both layers—chat without query hallucinates; query without explanation stays a classic dashboard. DataBuff binds Q&A experts to real storage tools so answers can be traced to a service row or Trace record. In the Demo, run the triad “Q&A → service list → Trace list.”
Q&A is best for opening the case, topology for blast radius, Trace waterfall for pinning the root hop—the three together are the complete workflow.
3.2 Seamless SkyWalking Ingest into DataBuff (Config Guide)
Many teams already attach a SkyWalking Java Agent on the JVM and prefer not to rewrite to OTel immediately. DataBuff Ingest can directly receive SkyWalking native gRPC v3 signals (Trace Segment, JVMMetric, Log) on the same default collector port: 11800. Existing Agents often only need a backend address change—no self-hosted OAP, no separate Elasticsearch/BanyanDB—to send traces plus JVM and log signals into the DataBuff analysis plane. OTLP (4317/4318) can coexist; the platform can distinguish SkyWalking vs OTel via data.source for gradual migration in mixed-probe environments.
This matters for teams with heavy SkyWalking Agent investment: adding AI Q&A need not rip out the probe stack. Point data at an Ingest that can analyze intelligently, then verify Q&A against panels in one product surface—far lower risk than a full Agent swap.
Signal and port mapping:
| Signal | Protocol notes | Ingest port |
|---|---|---|
| Trace Segment | SkyWalking native gRPC v3 | 11800 |
| JVMMetric | Same native gRPC channel | 11800 |
| Log | Same native gRPC channel | 11800 |
| OTLP Trace/Metrics (optional coexistence) | OTLP gRPC / HTTP | 4317 / 4318 |
Minimum config emphasizes two items: service name, and Agent backend address (often agent.backend_service / official agent.config collector.backend_service) pointing to <ingest-host>:11800. Prefer stable English service names; stuffing env or version into the name fragments “same business, many services” in AI Q&A and panels.
Copyable agent.config fragment:
Startup examples (executable JAR):
Environment variables are equally common in containers:
-javaagent before -jar; (3) stable service name matching team conventions; (4) after new data appears in DataBuff service/Trace lists, cross-check with AI Q&A. Completing these four steps realizes seamless switch or dual-write evaluation of “existing SkyWalking Agent → DataBuff.”If the team also collects OTel, keep some services on native :11800 and others on 4317/4318; analysis and AI Q&A stay on one product surface—avoiding two UIs and two on-call dialects. That is the engineering landing of §1’s point that OTLP and historical protocols can coexist. In mixed ingest, use data.source (or equivalent) to separate SkyWalking and OTel so duplicate probe traffic is not misread as business doubling.
3.3 Industry Context
Market research commentary on APM / Observability consistently notes that cloud-native microservices expand failure domains and raise the cost of manual panel flipping, increasing demand for intelligent analysis and AI SRE—from passive alert display toward assisted decisions that correlate metrics, traces, and change context[6]. That judgment does not depend on a single page of numbers; it neutrally summarizes “complexity up → machine-readable telemetry and automated reasoning.” For engineering teams: trace data must not only “fit in storage,” but also “be askable and correlatable.”
On open standards, OpenTelemetry maintains a Vendors ecosystem list marking OTLP support[7]. The list publicly includes both Apache SkyWalking and DataBuff, with OSS and Native OTLP related markings. Meaning for readers: whether you deepen the SkyWalking four-layer stack or adopt an AI-native analysis platform strong at OTLP/multi-protocol ingest, you stay in the same open telemetry context—not a closed proprietary probe island.
Back to the main line: Dapper gives the theory of “linking,” SkyWalking the engineering of “collect and see,” AI Q&A the interface of “ask and verify,” and native :11800 ingest lowers switching cost. Full-link monitoring competitiveness is shifting from “do we have topology” to “can trace data be reliably computed and conversed with.”
Summary
Full-link tracing rests on TraceId, Span parent-child edges, sampling, and context propagation. SkyWalking productizes those principles with a non-intrusive Agent and OAP analysis stack; topology and Trace query are the primary human interfaces. When on-call questions become natural language, platforms must map Service, Trace, and RED into executable queries—DataBuff AI Q&A plus native gRPC :11800 ingest offer an evolutionary path without a rip-and-replace. Suggested path: validate topology/Trace mental models on the SkyWalking Demo, experience the same class of questions on the DataBuff Demo, then open Ingest in a test environment with the minimal Agent config.
References
- 1. https://research.google/pubs/pub36356/ (Google Dapper paper entry)
- 2. https://opentelemetry.io/docs/specs/otlp/
- 3. https://skywalking.apache.org/docs/main/next/en/concepts-and-designs/overview/
- 4. https://skywalking.apache.org/docs/skywalking-java/next/en/setup/service-agent/java-agent/readme/
- 5. https://www.databuff.ai/
- 6. https://www.gartner.com/reviews/market/observability-platforms
- 7. https://opentelemetry.io/ecosystem/vendors/
- 8. https://demo.skywalking.apache.org/
- 9. https://demo.databuff.ai/