Top 10 Open Source APM Tools in 2026: A Practical Guide
Open Source APM · OpenTelemetry · Jaeger · DataBuff · SkyWalking · Zipkin · SigNoz · Grafana
Summary: When evaluatingopen source APM tools in 2026, first clarify whether you need an instrumentation standard, trace backend, assembled observability stack, or unified platform. This guide walks through ten common names when searching foropen source APM — OpenTelemetry, Jaeger, DataBuff, SkyWalking, Zipkin, Grafana, Elastic APM, Pinpoint, SigNoz, ClickHouse — with UI screenshots and a comparison table, so you can make verifiable selections without copying vendor rankings.
When data sovereignty, portable instrumentation, and self-hosting matter, application performance monitoring under open-source licenses still has clear advantages. OpenTelemetry is the common thread across every entry below: most modern backends accept OTLP, but the real question is whether a tool was OTel-native from the start or bolted OTLP onto a legacy data model. Each section stays neutral; a summary table at the end maps capability boundaries.
1Top 10 Open Source APM Tools
These are the ten projects or architecture patterns that appear most often on 2026 open source APM tool shortlists — spanning the standard layer, trace specialists, full-stack platforms, assembled stacks, storage engines, and unified backends, because production teams rarely pick just one layer.
OpenTelemetry
OpenTelemetry is not an APM product — it is the CNCF-backed standard for generating and exporting telemetry. SDKs, auto-instrumentation libraries, and the OpenTelemetry Collector form the shared ingestion layer for every backend. When engineers say "OpenTelemetry APM," they usually mean an OTel SDK exporting OTLP to Jaeger, SigNoz, or a unified platform.
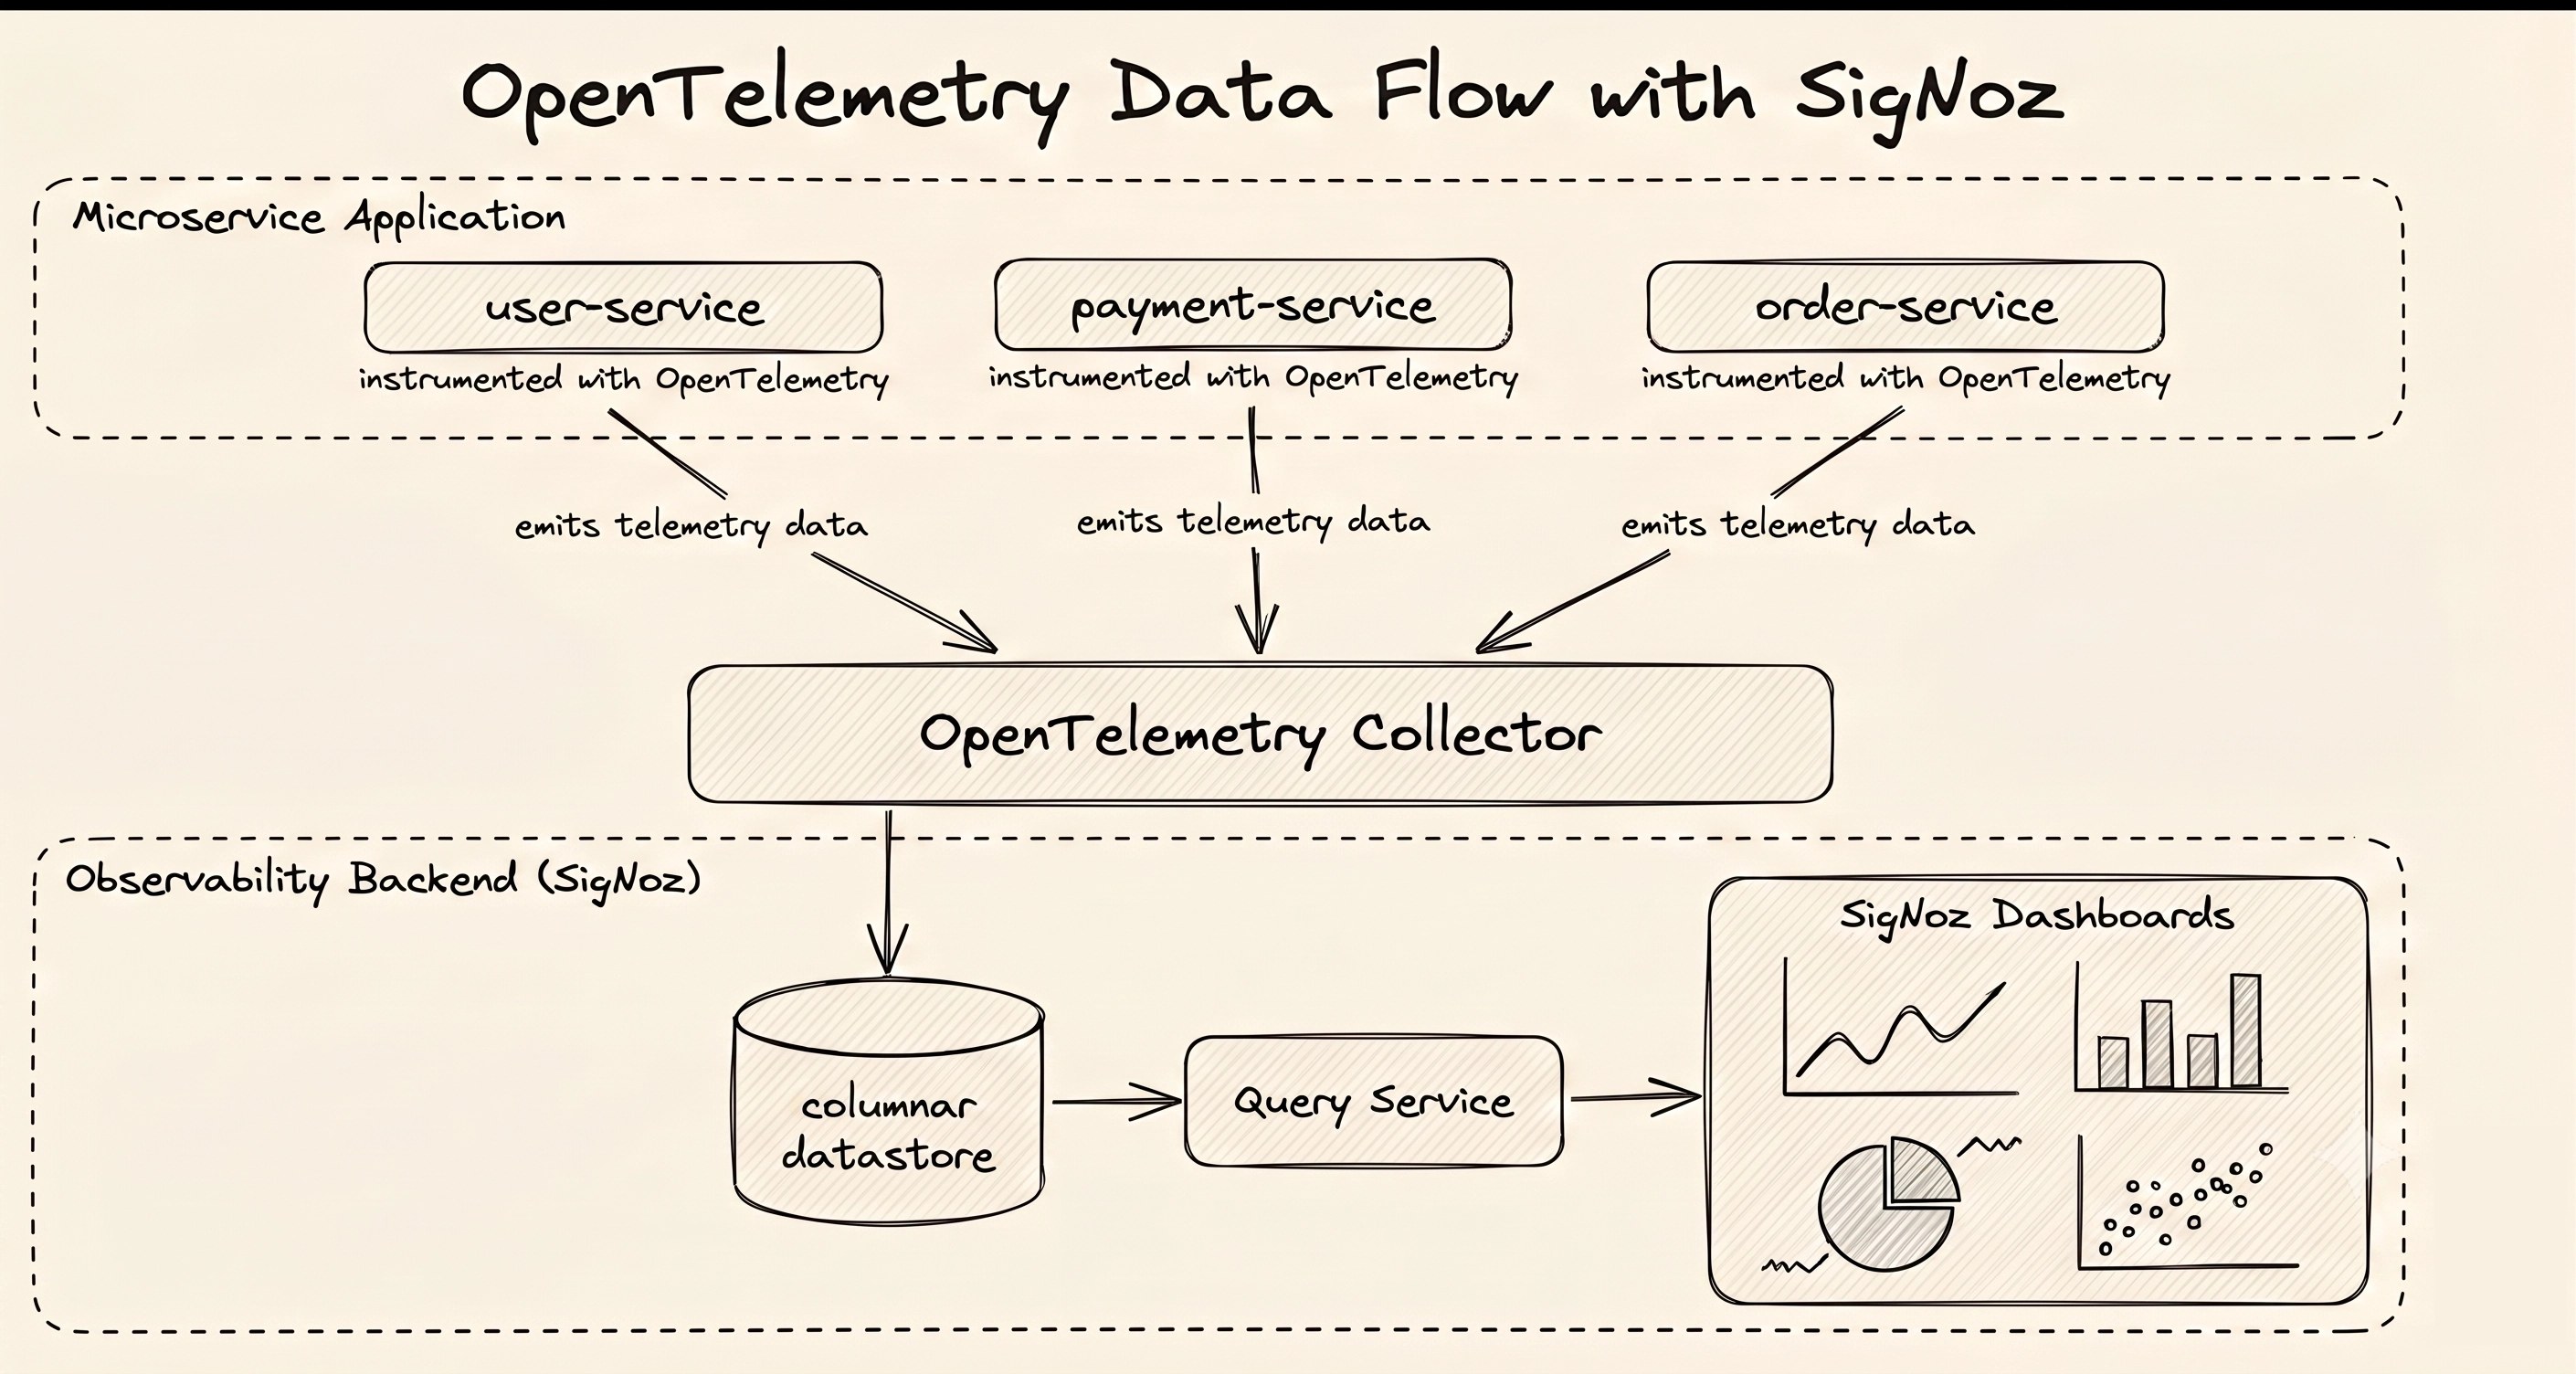
OpenTelemetry data flow from application through Collector to backend
OpenTelemetry provides vendor-neutral trace/metrics/logs APIs, semantic conventions for HTTP/DB/messaging, and Collector pipelines for sampling, routing, and fan-out. That portability makes 2026open source APM evaluations especially sensitive to OTLP ingestion fidelity.
Key strength: Industry-standard instrumentation that decouples "how to observe code" from "where data is stored" — the common foundation of modern OSS APM stacks.
Jaeger
Jaeger originated at Uber as a distributed tracing system and is now a CNCF graduated project. Jaeger v2 is rebuilt on the OpenTelemetry Collector framework, aligning with modern OTLP deployments while keeping deep trace search, adaptive sampling, and service dependency graphs.
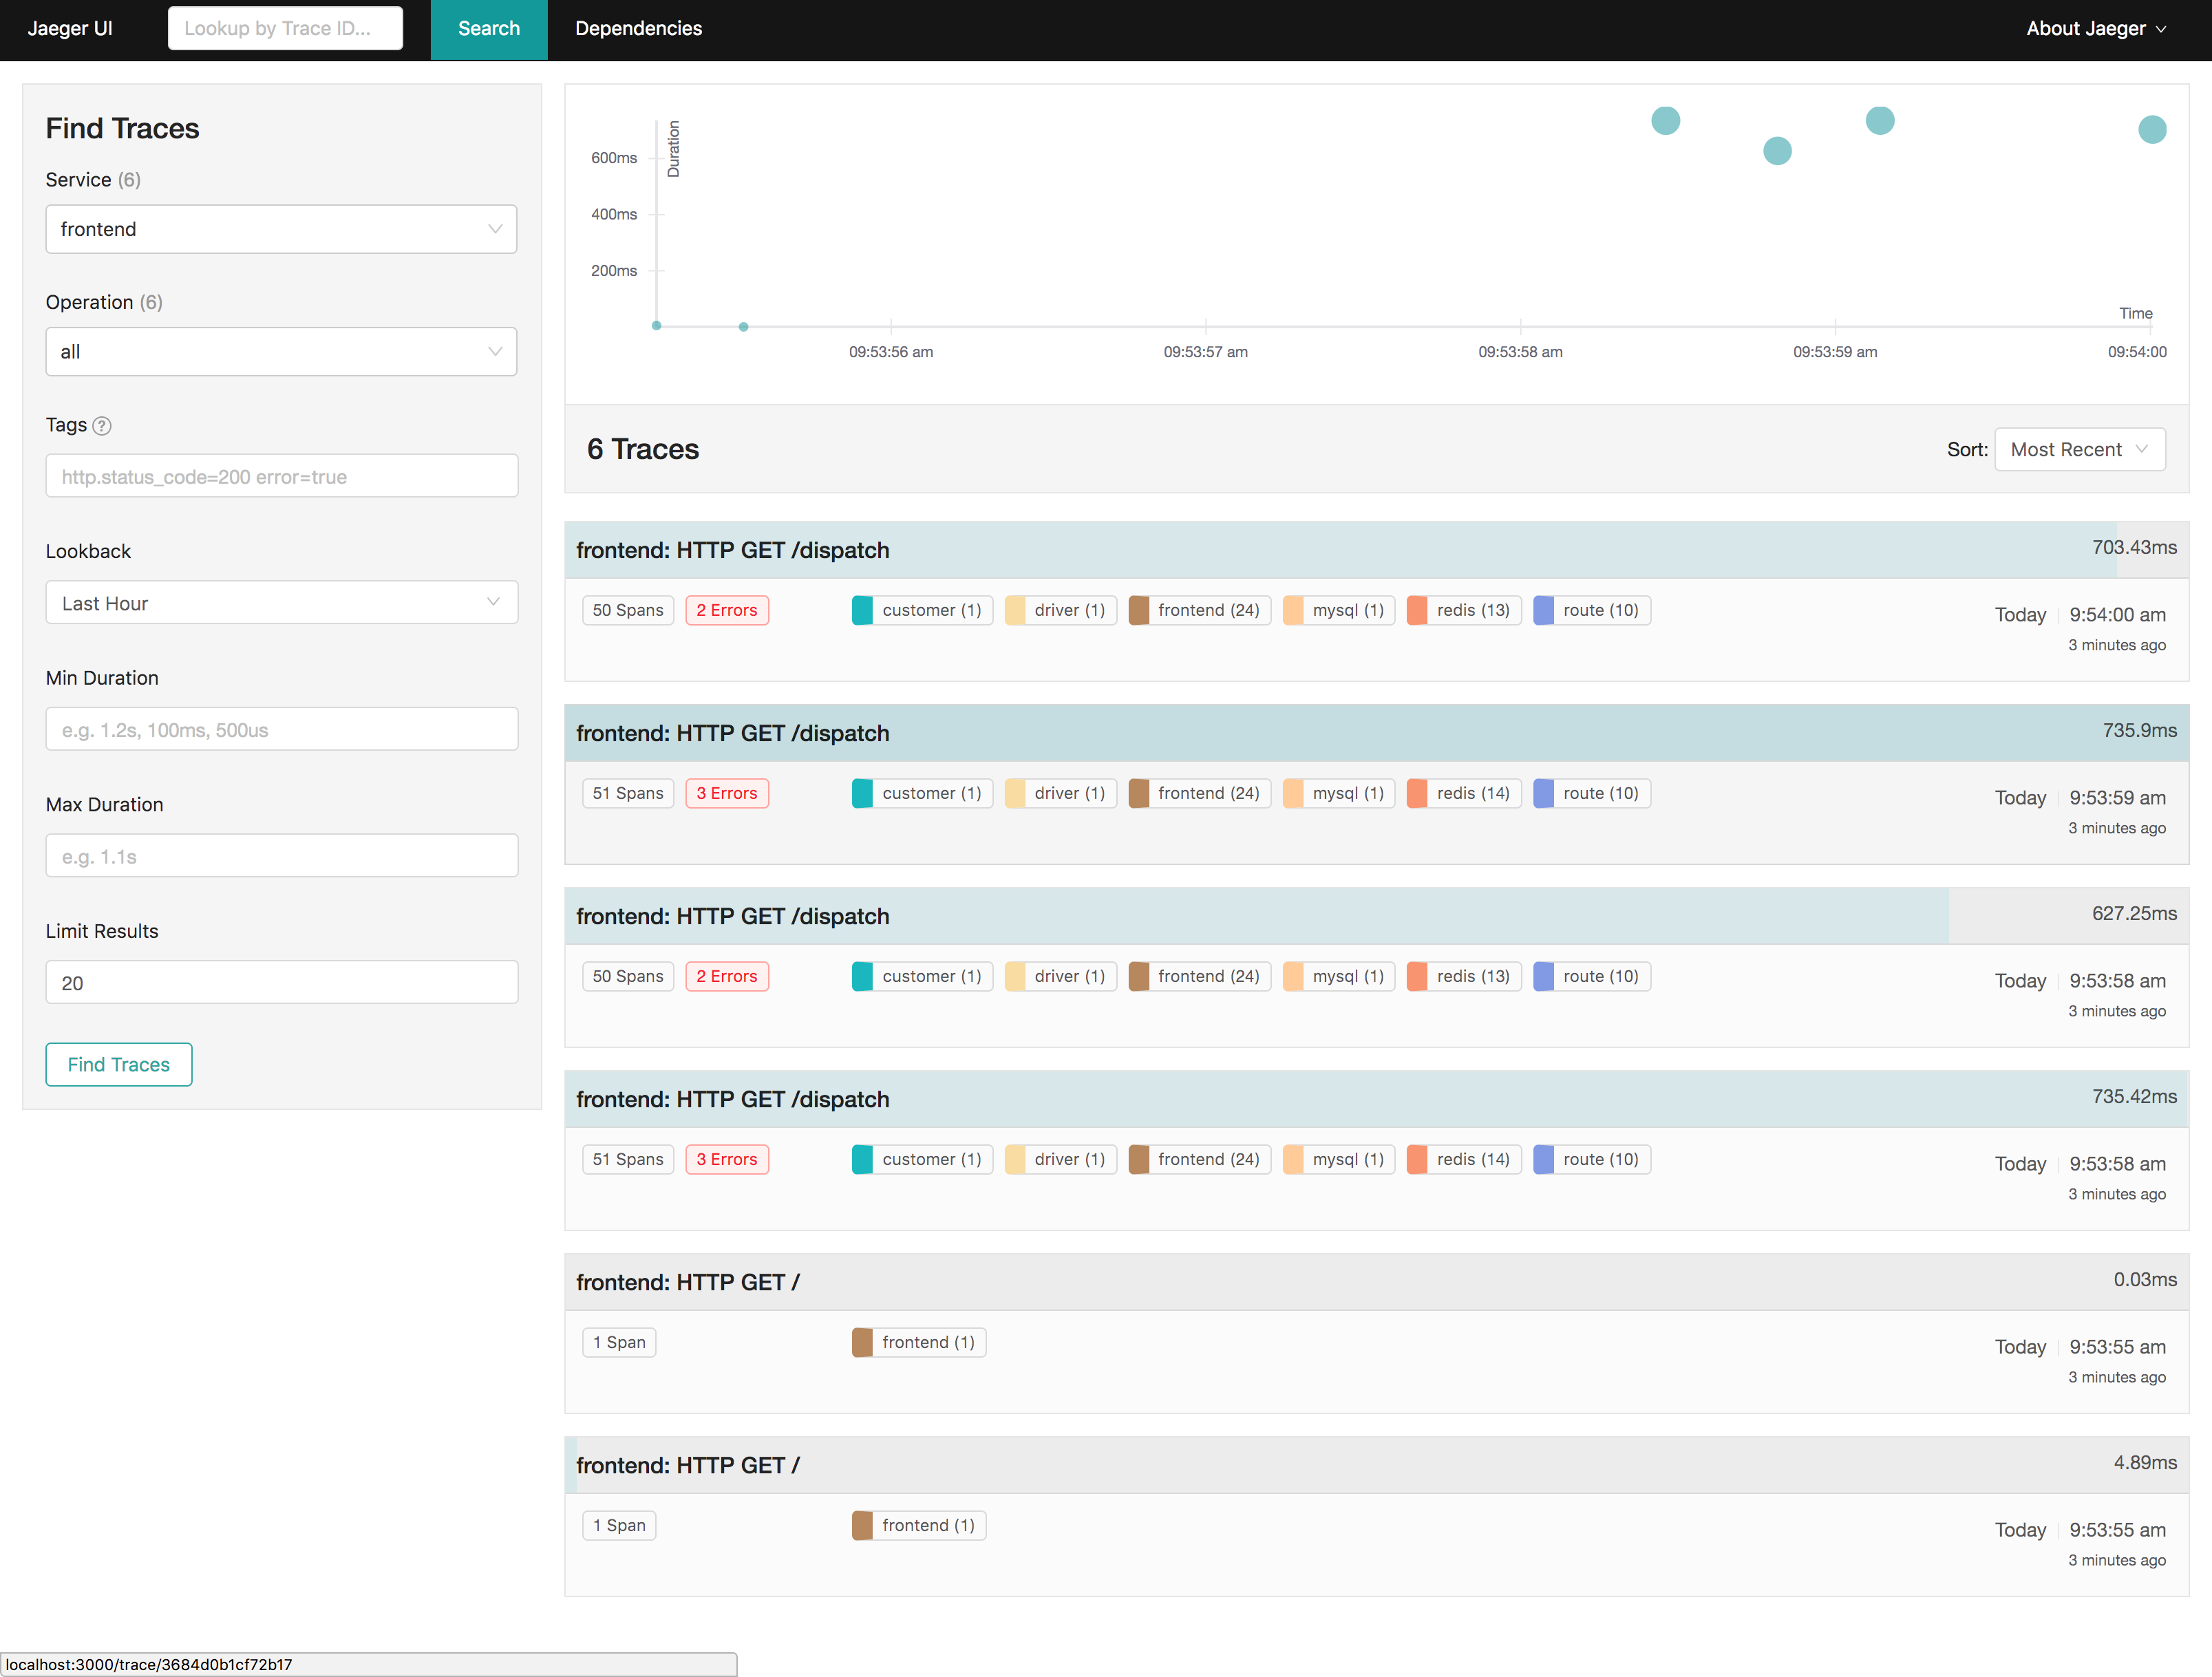
Jaeger UI trace search
Jaeger focuses on the tracing pillar of APM, excelling at visualizing call chains and pinpointing microservice latency bottlenecks. Teams typically pair it with Prometheus and Grafana when they need metrics and dashboards.
Key strength: Mature, CNCF-aligned distributed tracing with native OTLP ingestion and pluggable storage backends.
DataBuff
DataBuff is an open-source, AI-native APM platform built for the OpenTelemetry era. Listed on the OpenTelemetry Vendors page as Pure OSS with Native OTLP Yes — applications and Collectors can write standard OTLP directly to the backend, not just route through a rebranded Collector.
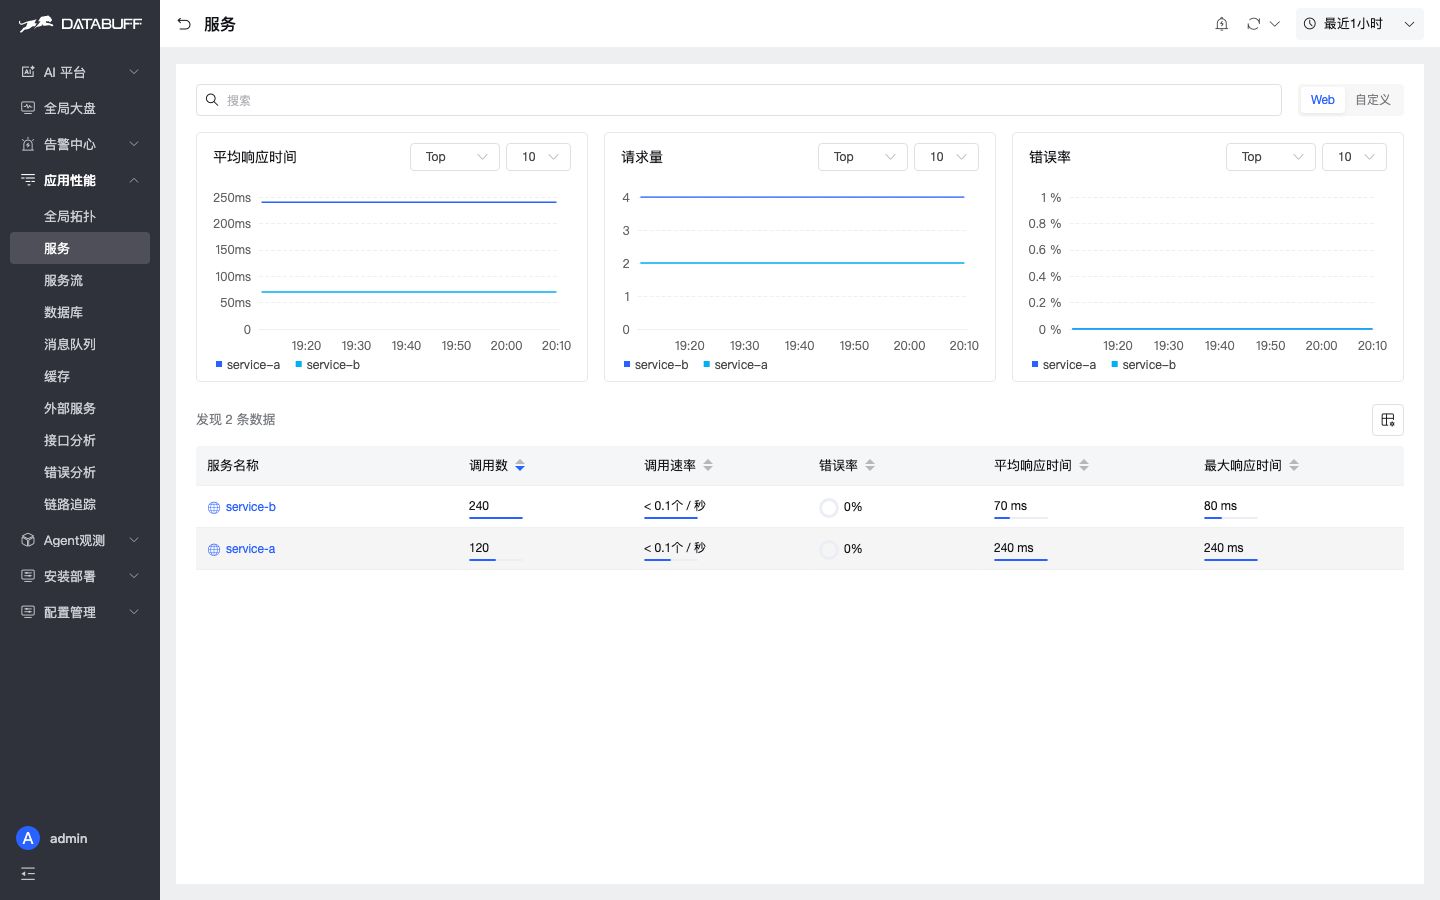
DataBuff service list RED metrics overview
The architecture simplifies to three components: Ingest (gRPC 4317, HTTP 4318 OTLP)、Apache Doris column-store analytics, and Web platform (default 27403) for service health, topology, alerts, and AI-assisted troubleshooting.
Beyond classic RED dashboards and trace search, DataBuff emphasizes AI-native troubleshooting: digital experts in a multi-agent model must query live metrics, traces, and alerts before answering; Skill and MCP bidirectional extensions let IDE agents join on-call workflows.
Key strength: Lean OTel-native unified APM + column-store analytics + AI-native multi-agent troubleshooting + MCP/Skill extensions, built for Agent-era on-call.
Apache SkyWalking
Apache SkyWalking is open-source APM for microservices, cloud-native, and container architectures, providing distributed tracing, service-mesh telemetry analysis, metric aggregation, and topology visualization in one platform — with agents for Java, .NET, Node.js, Python, and more.
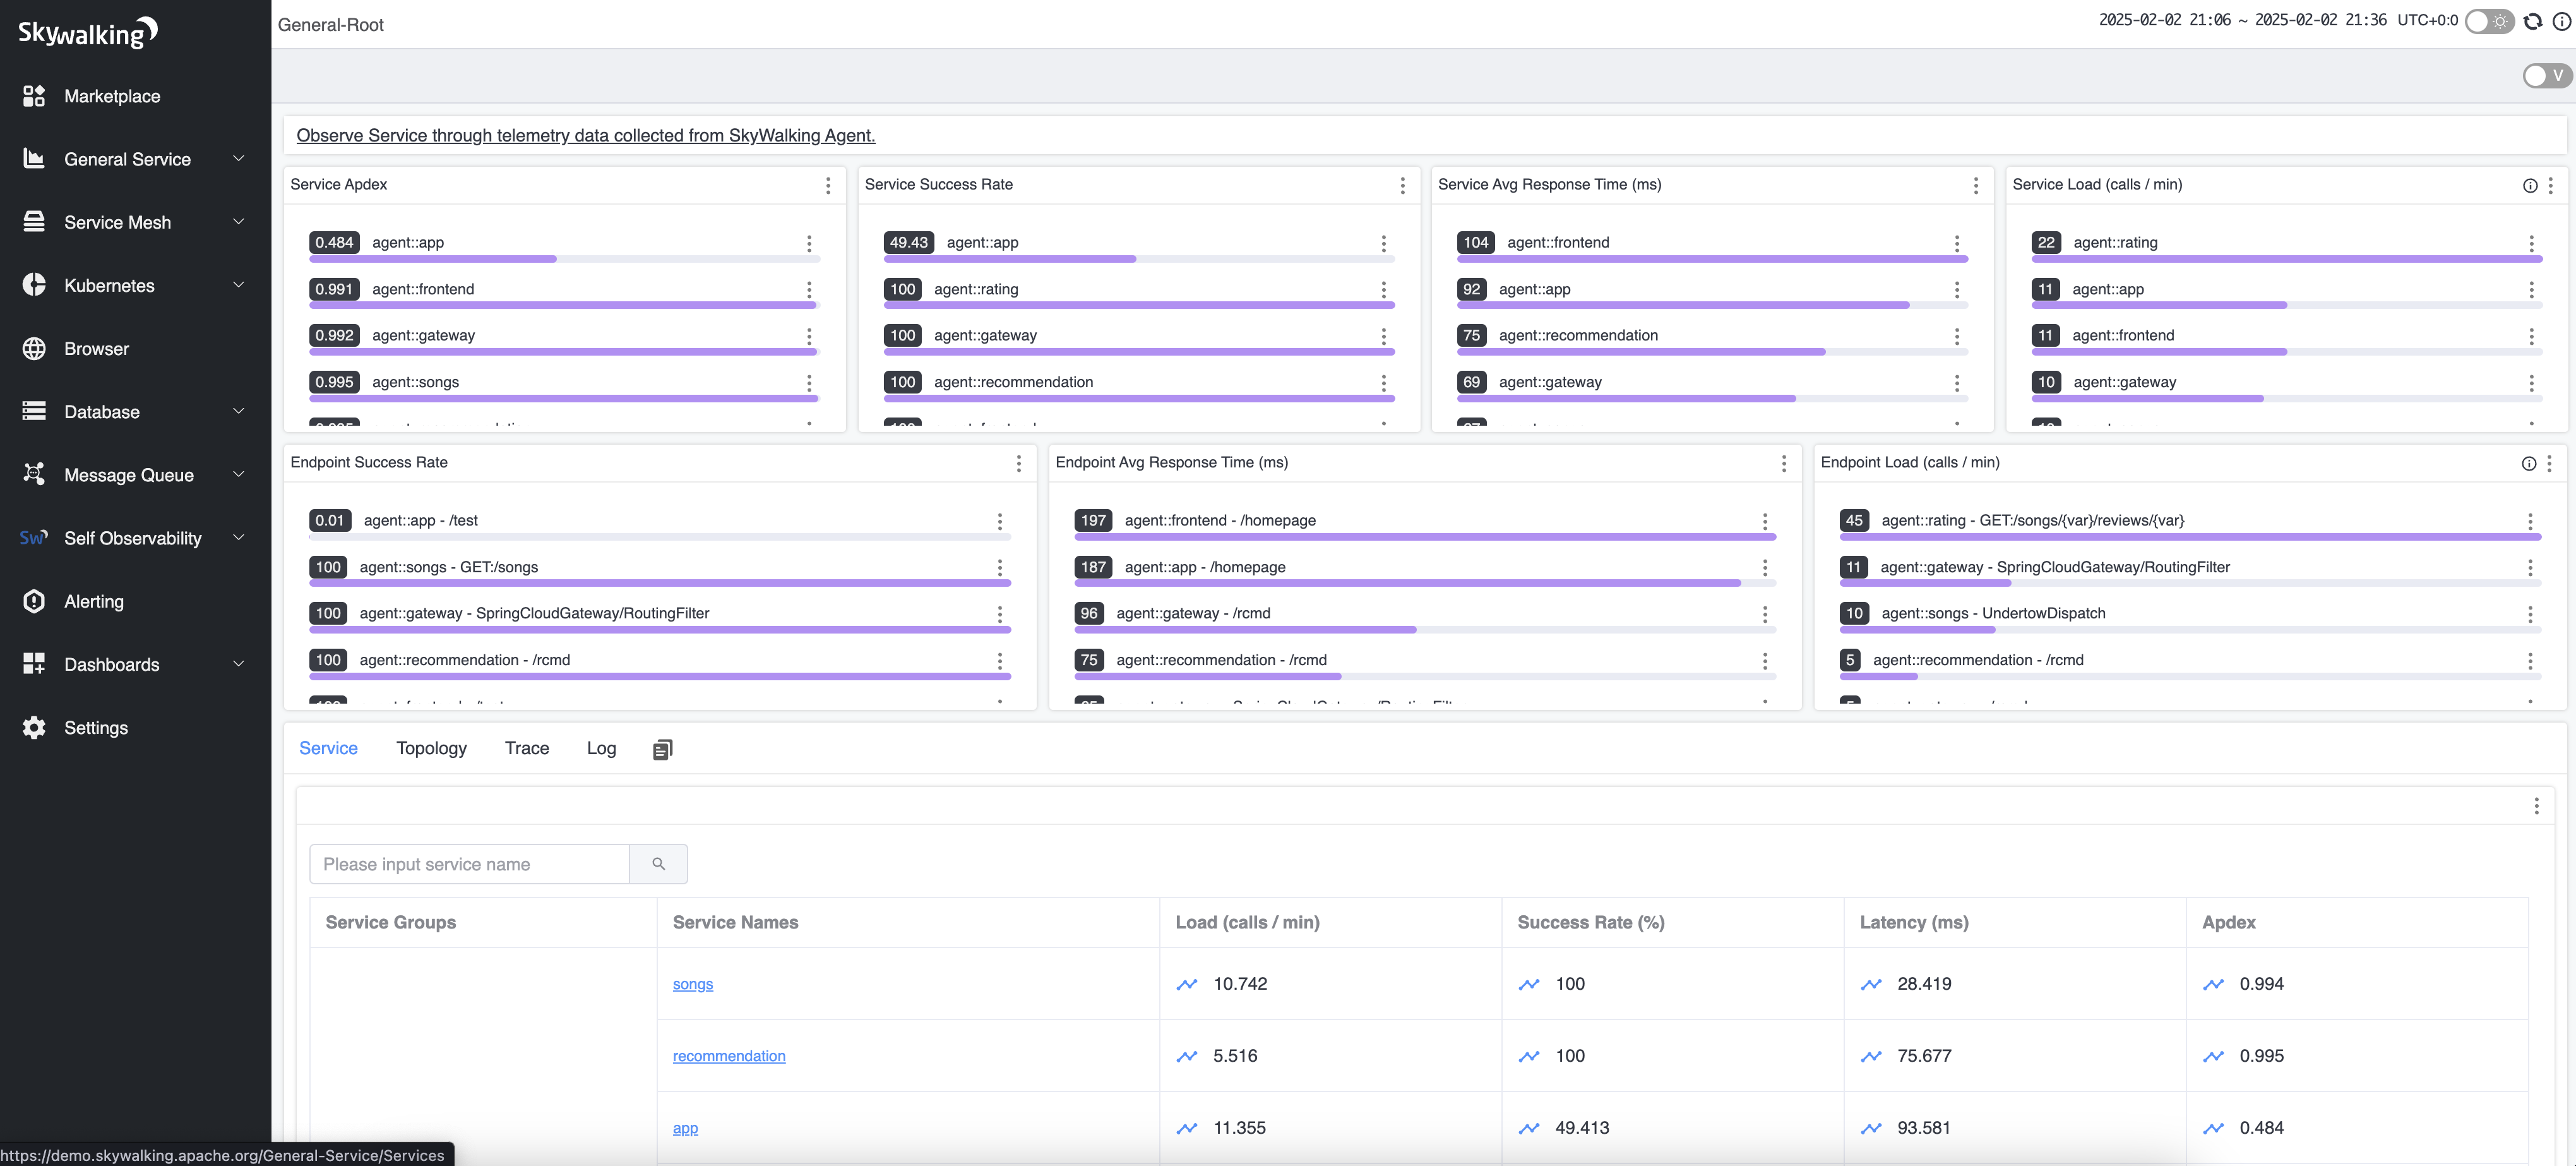
Apache SkyWalking observability home dashboard
SkyWalking predates the OpenTelemetry wave and now offers an OTLP receiver for gradual migration. Service maps and auto-generated topology remain popular in Java-heavy enterprise environments.
Key strength: All-in-one APM for microservices and cloud-native workloads, rich agent auto-instrumentation, and topology maps out of the box.
Zipkin
Zipkin is one of the earliest open-source distributed tracing systems, collecting time-series data from services, storing spans, and providing a UI to search traces and understand request paths and cross-service latency.
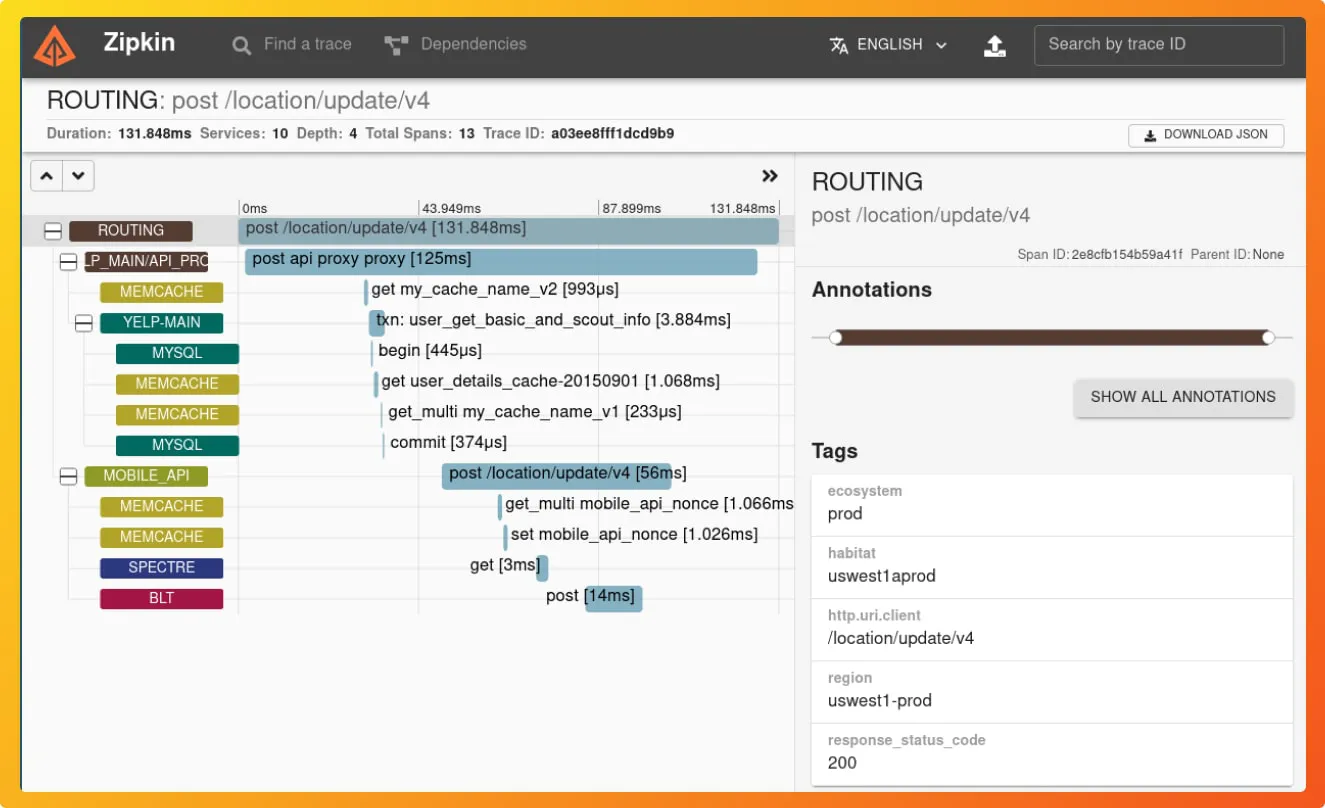
Zipkin Lens trace query UI
The architecture stays deliberately simple and focused. Like Jaeger, it covers tracing only — metrics and logs need companion tools. Community integrations are rich, but greenfield OTLP setups often evaluate Jaeger v2 or unified backends first.
Key strength: Mature, focused distributed tracing with long production validation in microservice environments.
Grafana
Grafana is the visualization hub of the LGTM assembled stack — Loki for logs, Grafana dashboards, Tempo for traces, Mimir/Prometheus for metrics. Grafana is not a single APM product, but many teams treat it as their open-source observability platform.
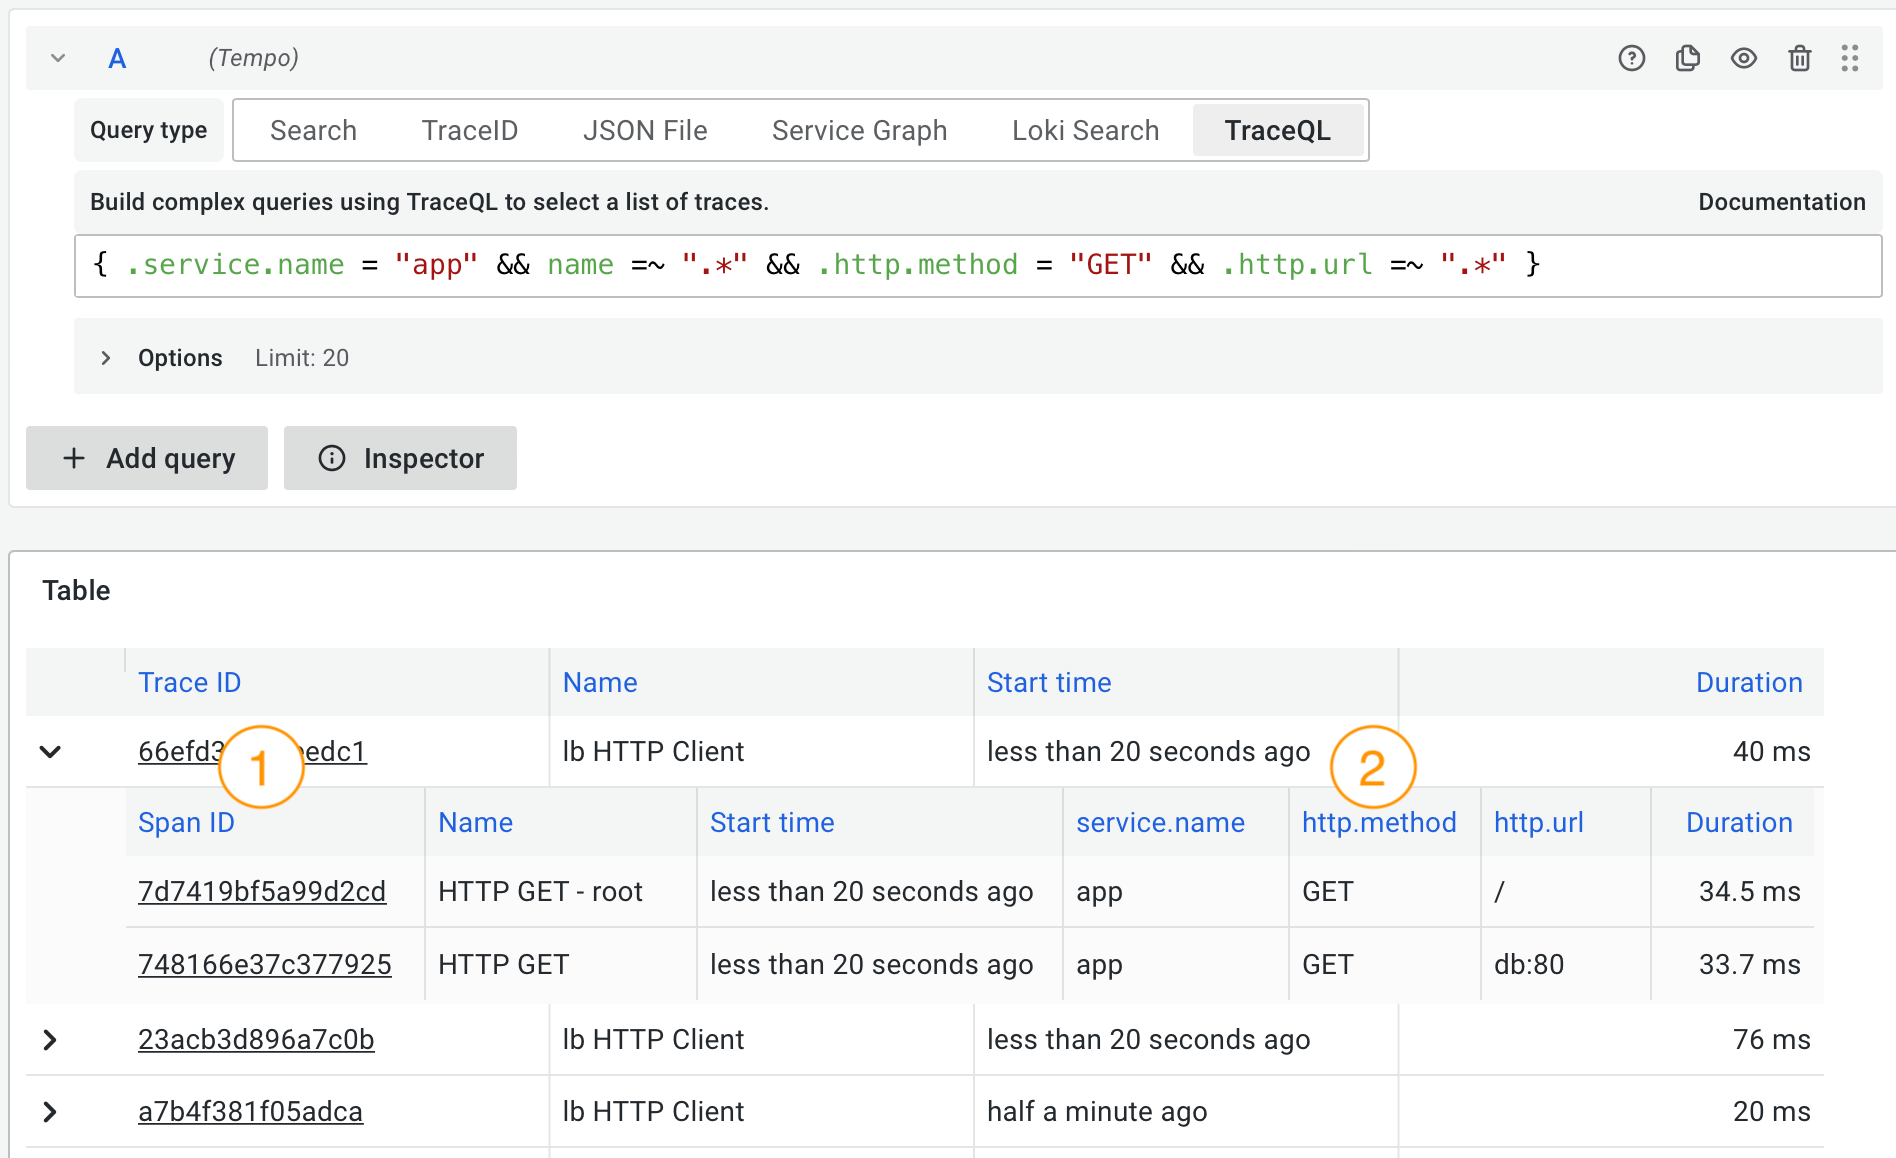
Grafana Explore Tempo TraceQL query results
A vast plugin ecosystem lets Loki/Tempo/Prometheus deliver trace-log and trace-metric correlation. The trade-off is operational complexity: each component upgrades independently, unlike a unified backend.
Key strength: Flexible dashboards that connect to virtually any telemetry backend — the de facto standard for assembled OSS observability.
Elastic APM
Elastic APM is the application performance monitoring component of the Elastic Stack, collecting performance metrics, errors, and distributed traces into Elasticsearch and displaying them alongside logs in Kibana.
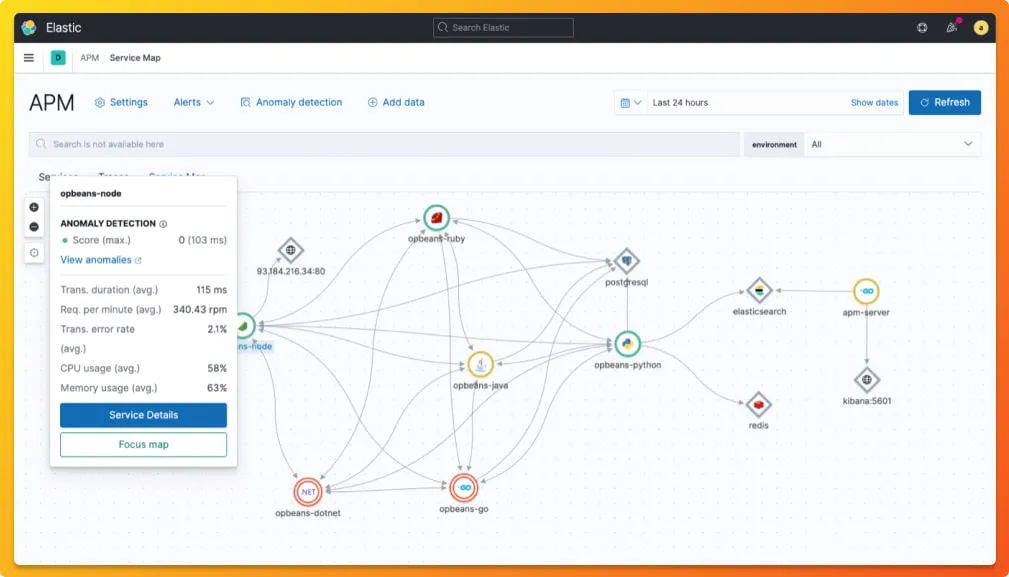
Elastic APM service overview in Kibana
Teams already on Elasticsearch for logs often add Elastic APM for unified search and analysis. Plan ES resources carefully at high cardinality; OTLP support continues to evolve with Elastic's broader OTel integration.
Key strength: Seamless integration with the ELK logging stack and mature search and analysis capabilities.
Pinpoint
Pinpoint is inspired by Google Dapper for large-scale distributed systems, tracing requests via Java/PHP bytecode instrumentation without source changes.
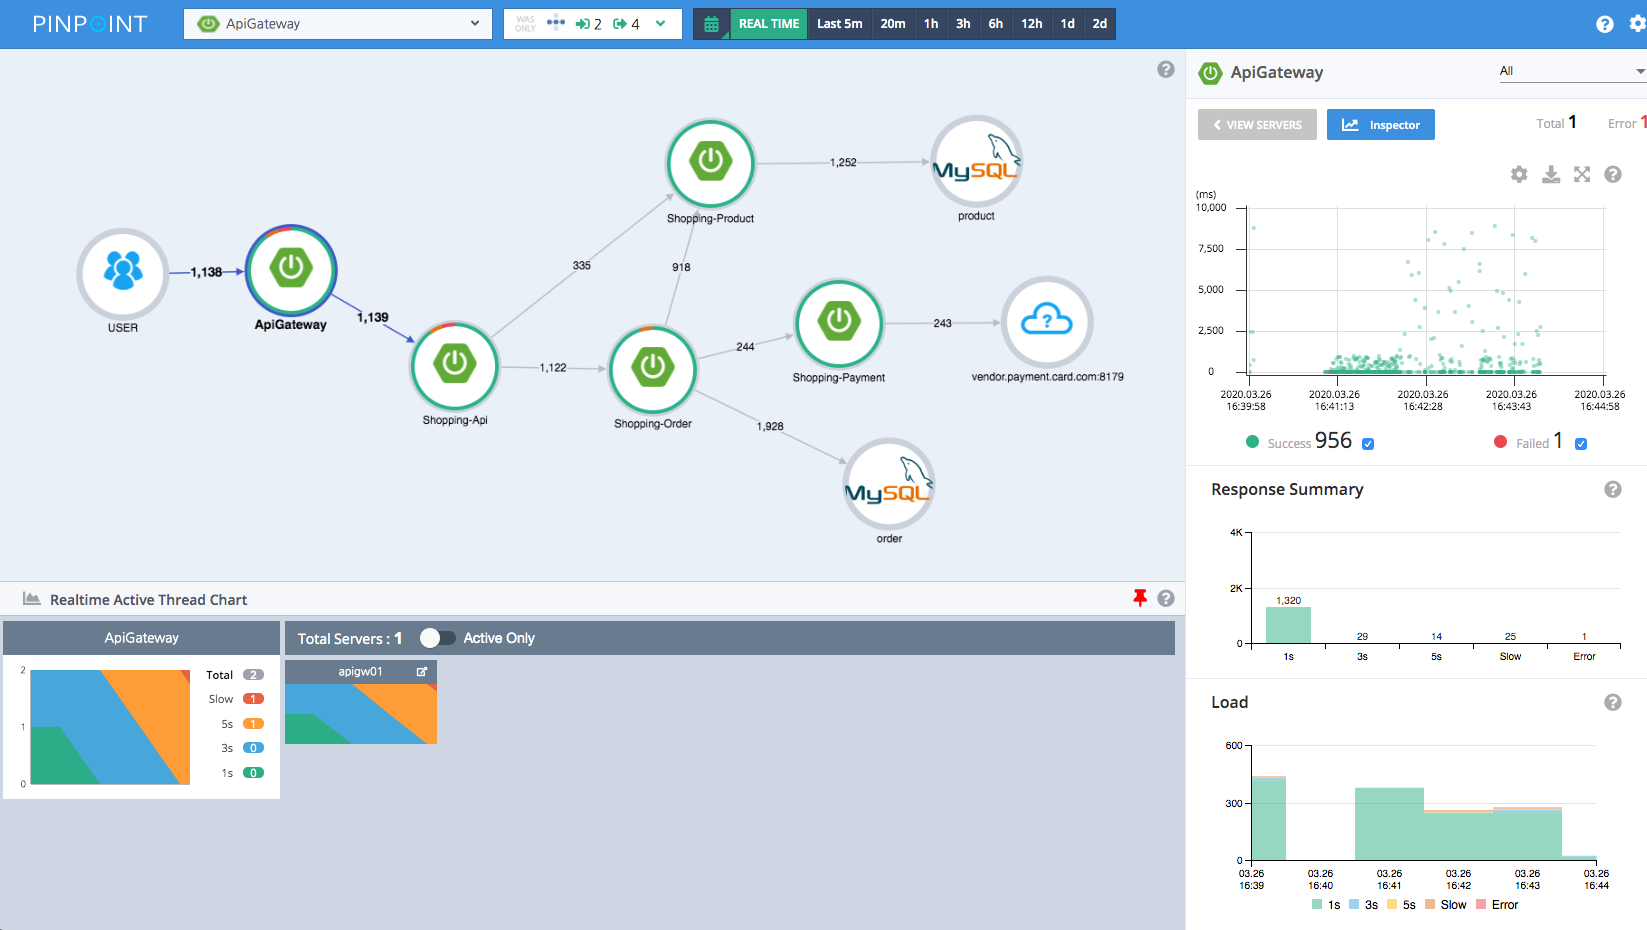
Pinpoint Server Map service dependency topology
It provides system topology and call trees at method/SQL/external-API granularity — suited to high-throughput Java environments with teams that can operate HBase trace storage.
Key strength: Code-level transaction tracing and topology maps for large-scale Java/PHP deployments.
SigNoz
SigNoz is a frequently cited open-source observability platform with a unified backend for metrics, traces, and logs, natively built on OpenTelemetry with telemetry stored in a column-store analytics engine — often discussed alongside ClickHouse-class storage.
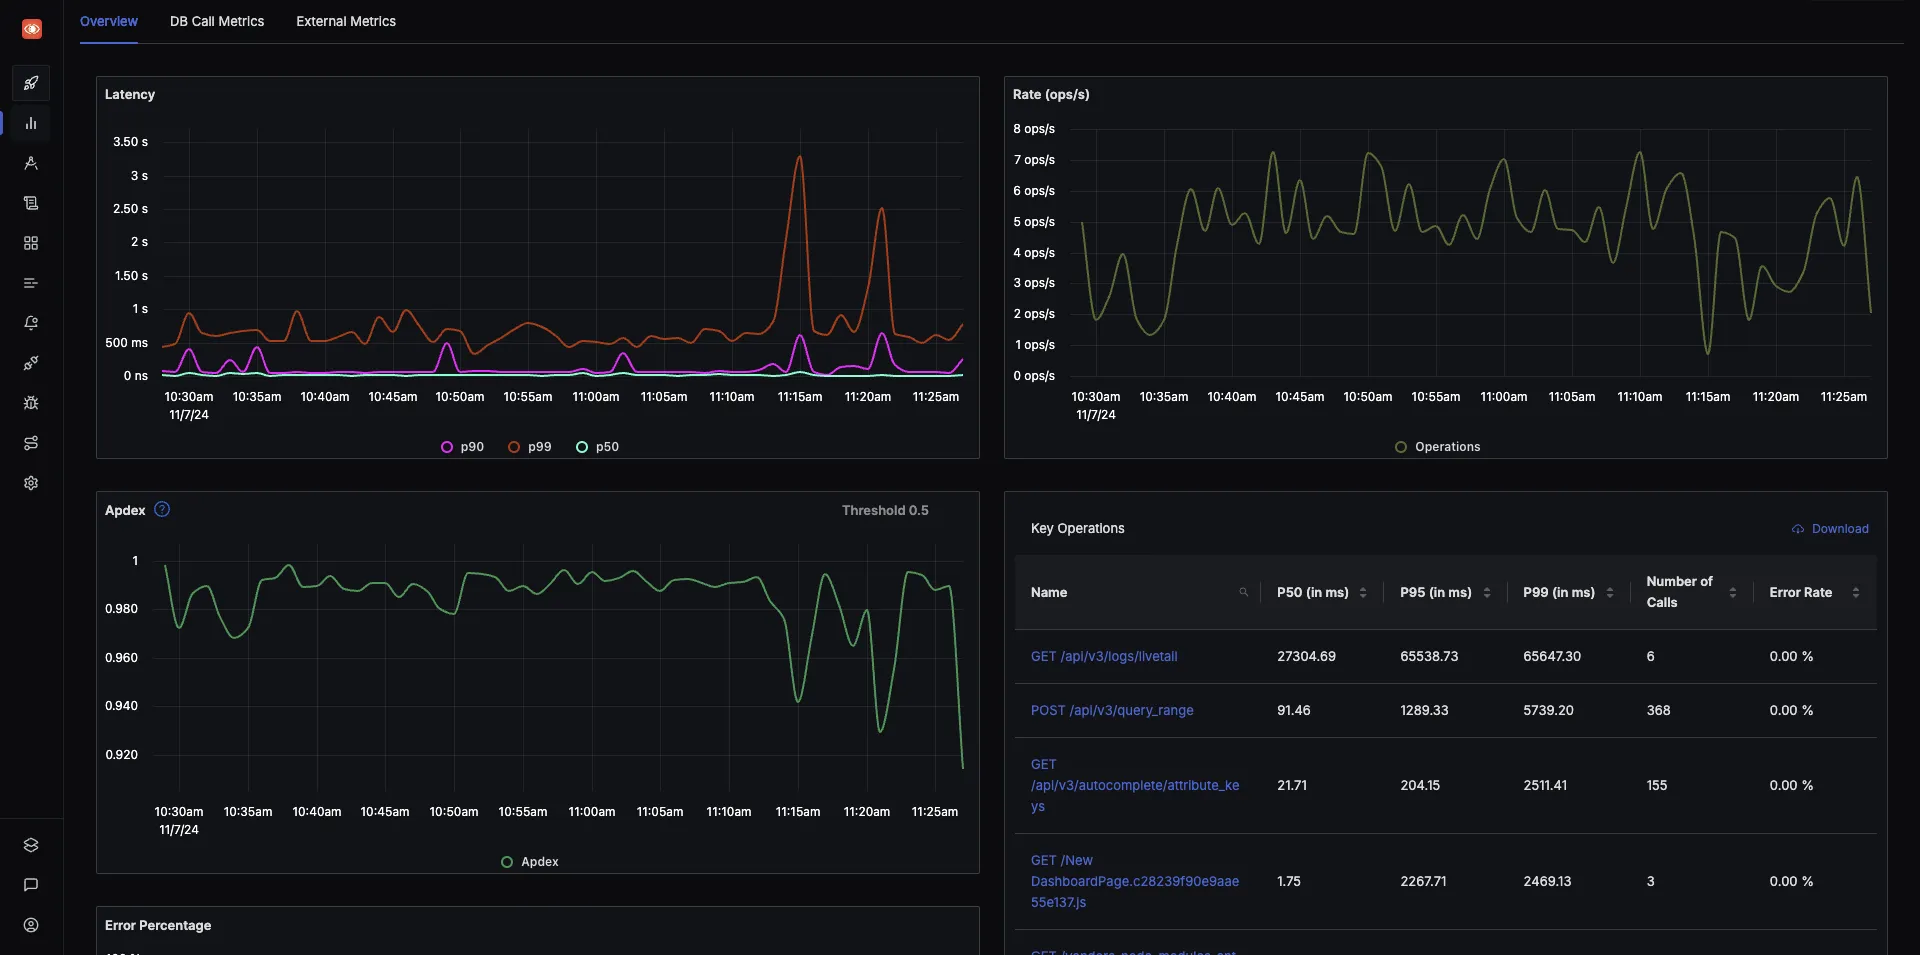
SigNoz application overview RPS and latency percentiles
It offers application overviews, log management, infrastructure monitoring, service maps, and alerting. When evaluating commercial APM alternatives, SigNoz is often the self-hosted OTel-native full-stack benchmark.
Key strength: OTel-native unified observability + column storage for correlated metrics/traces/logs analysis.
ClickHouse
ClickHouse is not an APM UI — it is an open-source columnar OLAP database powering the storage layer for multiple OTel-native observability platforms including SigNoz and Uptrace. High-cardinality traces and metrics benefit from column-store compression and fast analytical queries.
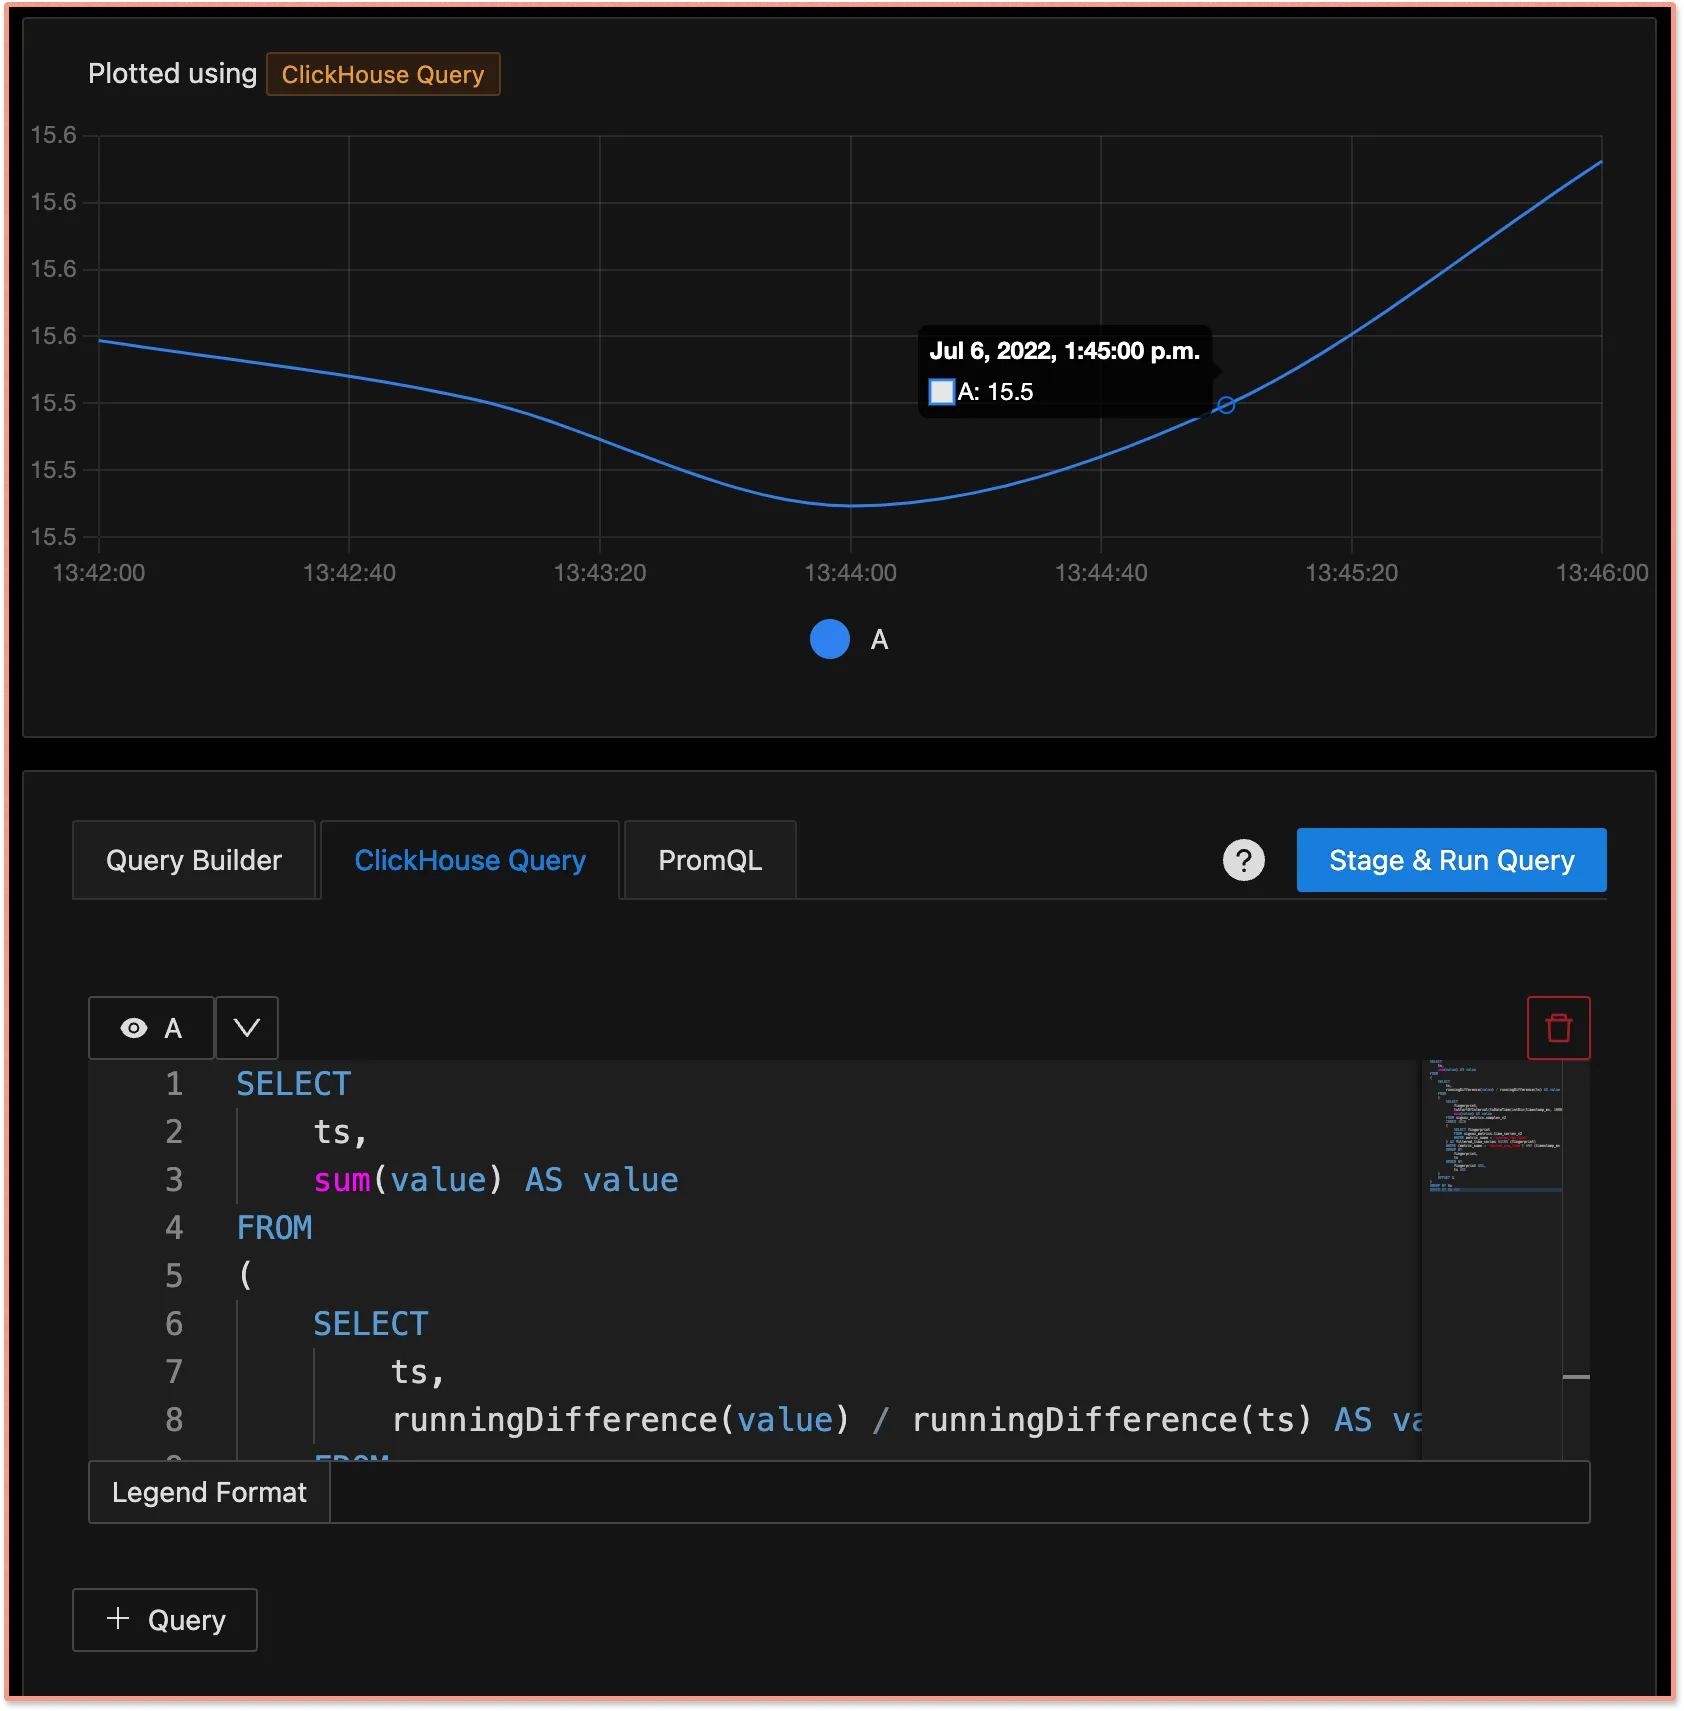
ClickHouse SQL telemetry analytics query UI
"ClickHouse APM" usually means OTLP written into ClickHouse tables with a product UI or SQL layer on top. Understanding this layer helps plan retention, sampling, and query costs.
Key strength: High-performance column-store telemetry analytics — the storage engine behind multiple OTel-native APM backends.
2Top 10 Open Source APM Tools at a Glance
| Tool | Role | Metrics | Traces | Logs | Native OTLP | Typical Use Case |
|---|---|---|---|---|---|---|
| OpenTelemetry | Instrumentation standard | ✅ SDK | ✅ SDK | ✅ SDK | Defines OTLP | Portable telemetry export |
| Jaeger | Trace backend | ❌ | ✅ | ❌ | ✅ | Dedicated distributed tracing |
| DataBuff | Unified platform | ✅ | ✅ | ⚠️ roadmap | ✅ native | OTel + AI-native APM |
| SkyWalking | Full-stack APM | ✅ | ✅ | ⚠️ | ✅ receiver | Agent-rich microservice APM |
| Zipkin | Trace backend | ❌ | ✅ | ❌ | ⚠️ | Lightweight trace search |
| Grafana | Visualization / LGTM | ✅ via Mimir/Prom | ✅ via Tempo | ✅ via Loki | ✅ in-stack | Assembled observability |
| Elastic APM | Full-stack APM | ✅ | ✅ | ✅ | ⚠️ evolving | ELK ecosystem |
| Pinpoint | Java APM | ✅ | ✅ | ⚠️ | ❌ | Bytecode-level Java tracing |
| SigNoz | Unified platform | ✅ | ✅ | ✅ | ✅ | OTel-native all-in-one |
| ClickHouse | Storage engine | — | — | — | — | Column-store telemetry analytics |
Read the table by role, not rank. OpenTelemetry and ClickHouse are infrastructure layers; Jaeger and Zipkin are trace specialists; Grafana, SkyWalking, Elastic APM, SigNoz, and DataBuff compete for the on-call primary UI — ops footprint and agent models differ widely.
3How to Choose the Right Open Source APM Tool
Tracing-only pain — Start with Jaeger or Zipkin; add Prometheus + Grafana when you need RED metrics Java agent preference — Evaluate SkyWalking or Pinpoint; plan OTLP receiver for new services Existing Grafana practice — Extend Tempo and Loki gradually rather than rip-and-replace on day one ELK logging standard — Elastic APM keeps search and APM in one ecosystem Greenfield OpenTelemetry — Shortlist OTel-native unified backends (SigNoz, DataBuff) and validate with the same OTLP POC script AI-assisted on-call — Prefer backends that ground LLM workflows on live spans and expose MCP/Skill APIs
4Validation Script: Same Steps for Every Candidate
- Deploy using the project's public install path
- Point the OpenTelemetry SDK or Collector exporter to OTLP gRPC
4317or HTTP4318 - Generate traffic for 5–10 minutes
- Confirm services appear, dependency topology renders, and slow traces are searchable end-to-end
- Record default retention, sampling policy, and target VM resource usage
After installing DataBuff, open the 27403 Web UI; to try AI troubleshooting, configure a model API key in settings. Full eBPF zero-instrumentation remains on the public roadmap — plan SDK/Collector instrumentation for existing services first.
5FAQ
What is the best open source APM in 2026?
There is no single answer. Jaeger suits trace specialists; Grafana LGTM suits assembled stacks; SkyWalking/Pinpoint suit agent-based Java fleets; SigNoz and DataBuff target OTel-native unified platforms. Match signal mix and ops capacity.
Is OpenTelemetry an APM tool?
No. It is an instrumentation and export standard; APM tools are backends and UIs that ingest OTLP (or legacy agents) and provide service health, trace search, and alerting.
Why is ClickHouse on an APM list?
Multiple OTel-native platforms store telemetry in ClickHouse or similar column stores. Understanding this layer helps plan retention, cardinality, and query costs — even if you only touch the product UI day to day.
Can open source APM replace Datadog or New Relic?
Modern OSS platforms cover most tracing, metrics, logs, and alerting scenarios; the trade-off is self-hosted ops vs managed SaaS convenience. Hybrid dev-OSS / prod-managed patterns remain common.
How does DataBuff differ from SigNoz?
Both write OTLP to column storage for unified observability. DataBuff emphasizes a three-component stack (Ingest, Apache Doris, Web), AI-native multi-agent troubleshooting grounded on live telemetry, and Skill/MCP extensions for IDE agents.
Is Prometheus APM?
Prometheus is a metrics monitoring and alerting toolkit, lacking native distributed tracing and log management — core APM pillars — but is commonly paired with Jaeger/Tempo.
6Closing Thoughts
The 2026 open source APM tool ecosystem is healthier because OpenTelemetry decouples instrumentation from backends. Use this Top 10 map to identify which layer you are actually choosing — standard, trace specialist, assembled stack, storage engine, or unified platform — then run the same OTLP validation on every finalist. Backends that pass topology and trace search in an afternoon and fit the Agent-era roadmap belong on your shortlist, regardless of any numbered ranking.
◆ ◆ ◆
References: [OpenTelemetry documentation](https://opentelemetry.io/docs/) · [OTel Vendors](https://opentelemetry.io/ecosystem/vendors/) · [Jaeger](https://github.com/jaegertracing/jaeger) · [SkyWalking](https://skywalking.apache.org/) · [Zipkin](https://zipkin.io/) · [Grafana](https://grafana.com/oss/) · [Elastic APM](https://www.elastic.co/elastic-stack/apm) · [Pinpoint](https://github.com/pinpoint-apm/pinpoint) · [SigNoz](https://github.com/SigNoz/signoz) · [ClickHouse](https://clickhouse.com/) · [DataBuff](https://github.com/databufflabs/databuff)
◆ ◆ ◆