Top 5 Open Source APM Tools in 2026: Comparison Guide
Open Source APM · OpenTelemetry · Jaeger · SkyWalking · DataBuff · Tempo · Pinpoint
Summary: Choosingopen source APM tools in 2026 is less about copying rankings and more about matching OpenTelemetry strategy, on-call workflows, and ops capacity. This guide compares Jaeger, Apache SkyWalking, DataBuff, Grafana Tempo, and Pinpoint with selection criteria, UI screenshots, and pros/cons to help platform/SRE teams make verifiable POC decisions.
1Introduction: Why Open Source APM Matters
Open source APM (Application Performance Monitoring) offers a transparent, customizable, predictable-cost alternative to commercial suites: auditable source code, full data control, and unified export via OpenTelemetry. Open source APM tools have become the default starting point for teams seeking flexibility while keeping production depth.
These factors drive teams to evaluate options seriously:
Cost optimization — Escape per-host/per-node SaaS billing while keeping enterprise-grade traces and service metrics Data sovereignty — Keep telemetry in your own VPC or designated region for compliance Vendor neutrality — Instrument once with OpenTelemetry; switch backends without changing application code AI and Agent workflows — On-call increasingly needs LLM/IDE agents querying live spans, not static docs Ops fit — Small teams prefer fewer components; large orgs may choose an LGTM assembled stack
This guide addresses those needs across five open-source APM options: from CNCF tracing backends to AI-native unified platforms to Java bytecode-level APM.
◆ ◆ ◆
2Why Teams Choose Open Source APM Tools
Zero license fees — Costs shift to infrastructure and engineering, not commercial per-node tiers Full data control — Self-hosting helps meet GDPR, HIPAA, and internal audit requirements Avoid vendor lock-in — OTel-native backends migrate without re-instrumenting Transparency and security — Audit source, patch locally, verify ingest paths Community innovation — CNCF and ASF projects evolve in step with cloud-native adoption
◆ ◆ ◆
3What to Look for When Selecting Open Source APM Tools
Before locking a shortlist, evaluate open source APM tools against these dimensions:
| Dimension | Why It Matters | What to Evaluate | How to Verify |
|---|---|---|---|
| Unified observability | Fewer tab switches during incidents | Whether traces + metrics (+ logs) share one UI or an assembled stack | Run a slow request and confirm correlated views |
| OpenTelemetry support | Future-proof instrumentation | End-user-facing native OTLP ingest | Point SDK to 4317/4318 and verify span fields |
| Storage efficiency | Cost at scale | Column store, object storage, or search-index backend | Stress-test retention growth with real cardinality |
| Query performance | Shorter mean time to recovery | Trace search, TraceQL, dependency graphs under load | Search traces during peak windows |
| Deployment simplicity | Lower ops burden | Docker/K8s paths and component count | Time from install to first topology view |
| AI / MCP readiness | Matches 2026 on-call patterns | Telemetry-grounded AI; Skill/MCP extensions | Have agents query live spans, not docs |
| Collection model | Fits your language stack | SDK-only, bytecode agent, or eBPF | Compare Java-heavy vs polyglot deployments |
| Community health | Long-term maintainability | Release cadence, docs, issue response | Review project activity over the last two quarters |
◆ ◆ ◆
4Top 5 Open Source APM Tools: Comparison and Use Cases
The five options below follow the evaluation framework, with official UI screenshots and pros/cons analysis.
Jaeger
Jaeger is a CNCF graduated project from Uber's distributed tracing platform. When the core need is end-to-end request flow across microservices, it remains a top backend choice; Jaeger v2 is built on the OpenTelemetry Collector framework and aligns with modern OTLP pipelines.
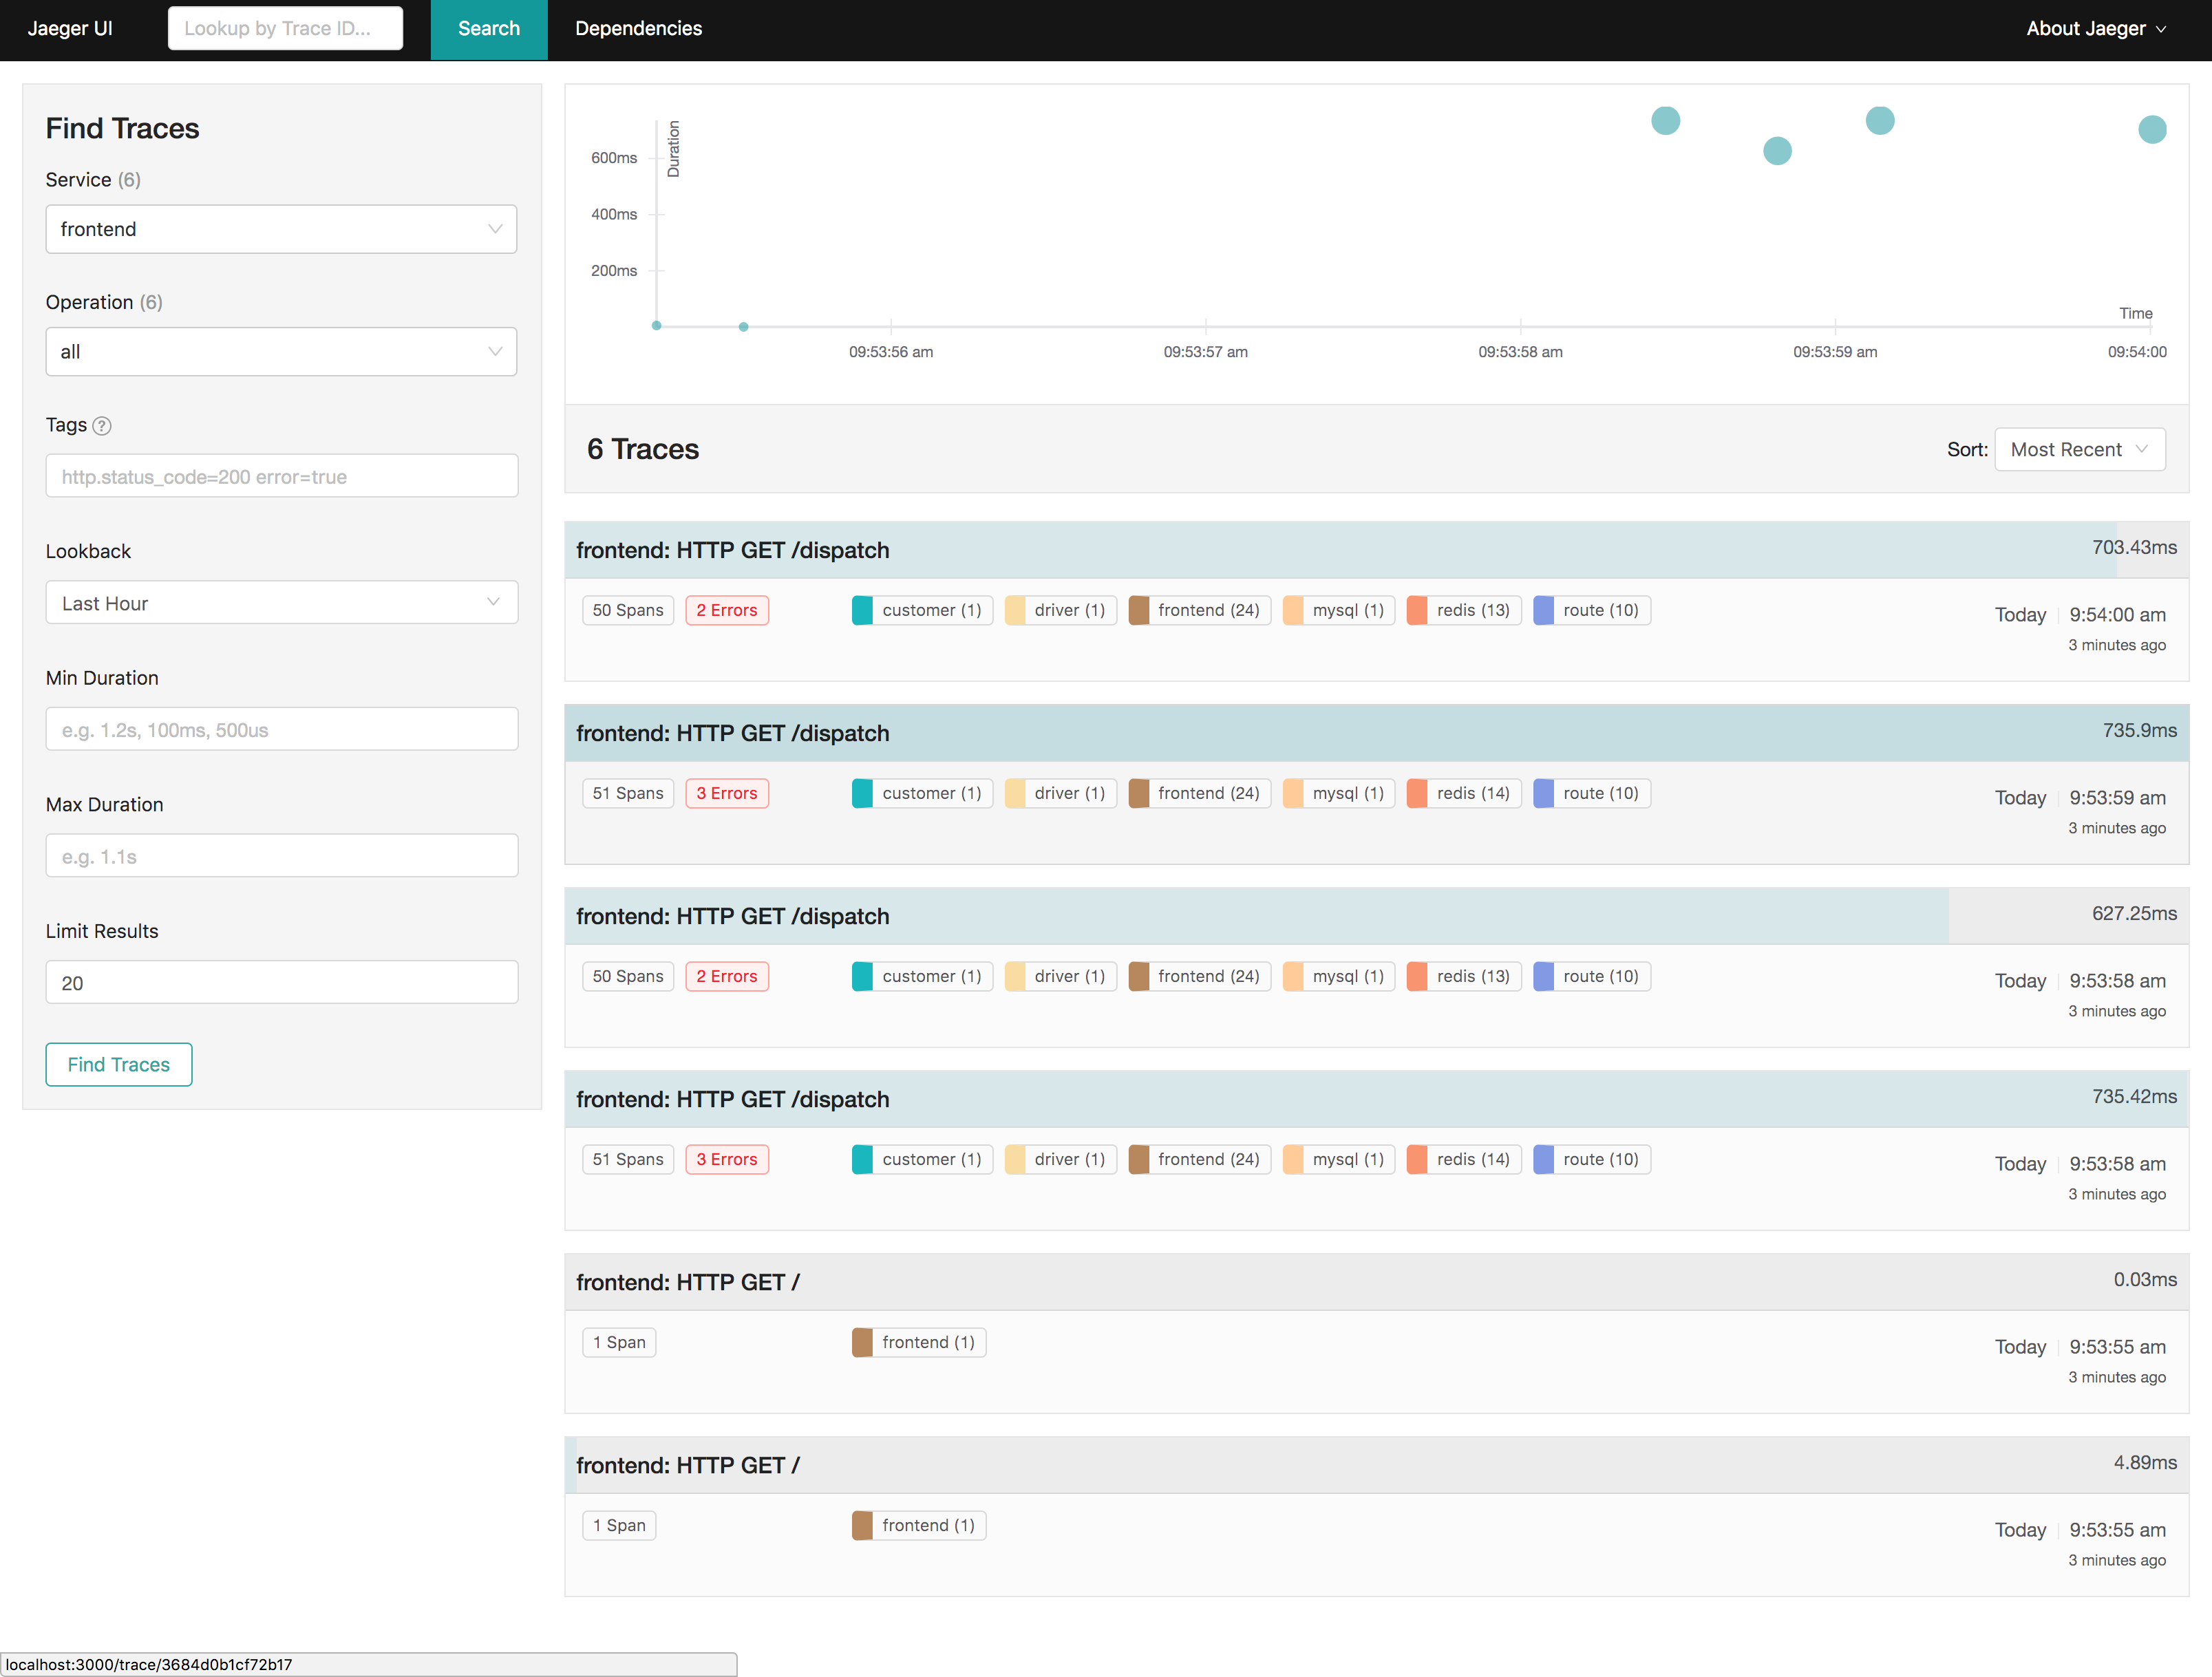
Jaeger UI · trace search and service filter
Jaeger Strengths
CNCF graduated — Mature governance with long-term community maintenance Proven at scale — Adaptive sampling; flexible storage backends (Elasticsearch, Cassandra, Kafka, etc.) OpenTelemetry compatible — Native OTLP on standard gRPC/HTTP ports Service dependency graph — Topology inferred from span relationships Mature trace exploration — Waterfall and comparison views for latency analysis
Jaeger Limitations
Tracing-first — metrics and log correlation need companion tools Production often splits collector, query, and storage roles Limited RED-style service dashboards vs unified APM
Integration / Mitigation
Pair with Prometheus and Grafana for metrics and visualization OpenTelemetry Collector dual-export eases backend migration Jaeger Operator simplifies Kubernetes deployment
Best For
Microservice teams with existing metrics/logs who need a standards-aligned trace backend without replacing the whole observability stack.
DataBuff
DataBuff is an open-source, AI-native, OpenTelemetry-oriented unified APM backend: ingest, troubleshooting, and Agent-era extensions within a smaller self-hosted ops footprint. Listed on OpenTelemetry Vendors as Pure OSS with Native OTLP Yes — applications export standard OTLP directly to the backend, not only through a rebranded Collector.
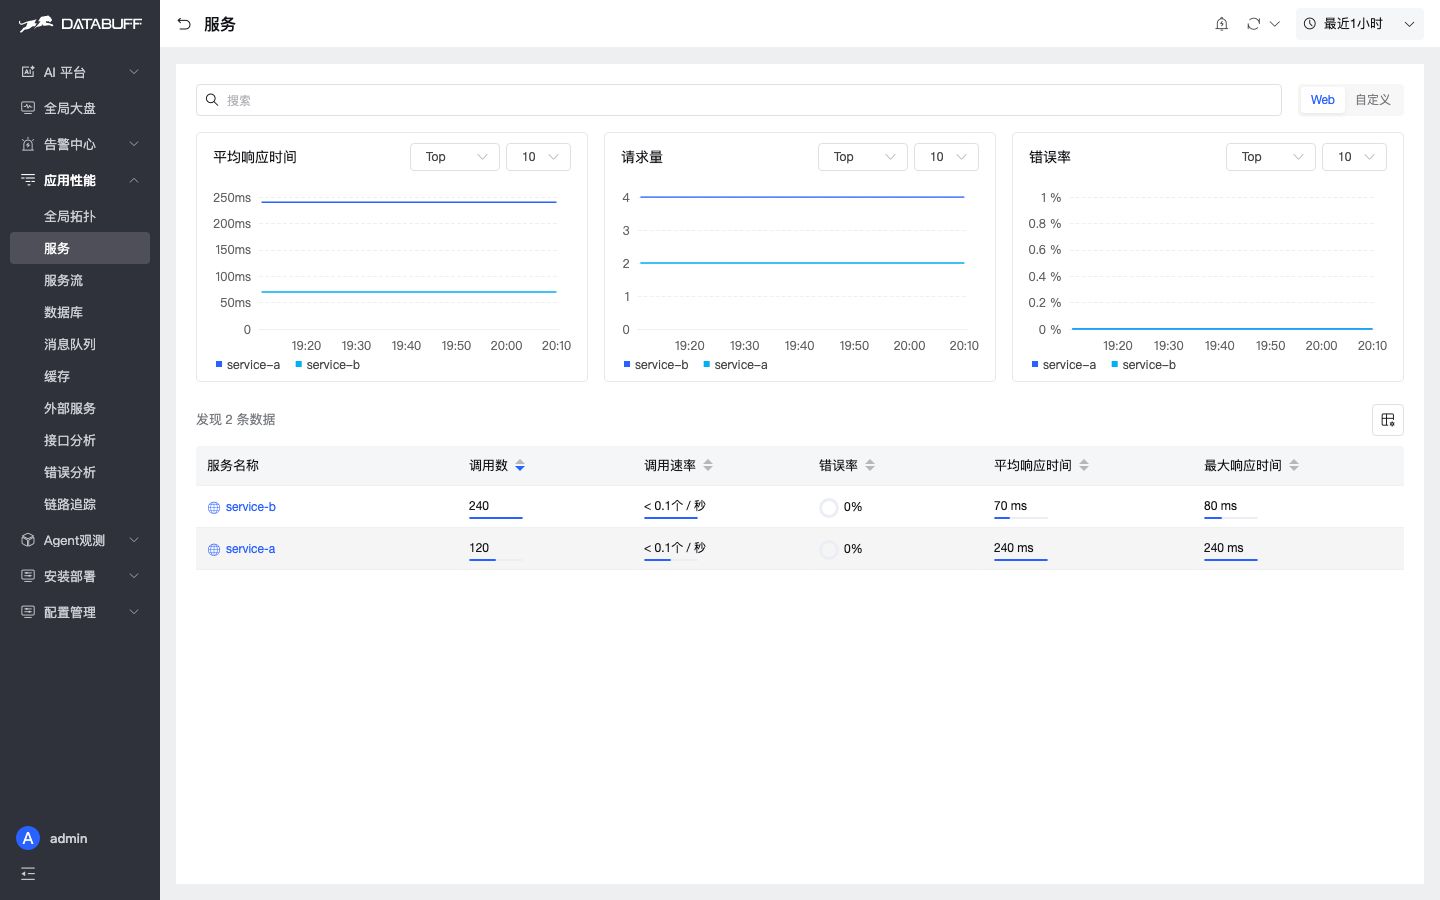
DataBuff · service health overview (Rate / Errors / Duration)
DataBuff Strengths
OpenTelemetry-native design — gRPC 4317、HTTP4318OTLP ingestion; instrument once with the SDK, no proprietary agent lock-inAI-native architecture — AI Brain orchestrates digital experts that must query live metrics/traces/alerts before answering, not a bolt-on chat box Skill and MCP bidirectional extensions — Built-in Skills define expert behavior and can be overridden; bidirectional MCP lets Cursor/Claude agents call platform capabilities and register external MCPs (Prometheus, SkyWalking, Zabbix, etc.) Agent-era observability — Beyond classic microservice RED, track LLM call chains, token usage, and tool/skill invocations Lean three-component stack — Ingest, column-store analytics, Web console (default UI after install on 27403)Bring your own model — OpenAI-compatible and Anthropic APIs for private LLM policies
DataBuff Limitations
Full eBPF zero-instrumentation remains on the public roadmap; plan SDK/Collector instrumentation for existing services AI features require configuring a model endpoint before multi-agent workflows work
Integration / Mitigation
One-line install script for quick Docker POC; optional Demo workload generator speeds validation When migrating from Jaeger or agent-based APM, run Collector dual-export in parallel Register external MCPs to query existing Prometheus/SkyWalking data from one AI console
Best For
Teams standardized on OpenTelemetry wanting self-hosted unified APM with AI-native troubleshooting + Skill/MCP aligned to IDE agents, and ops footprint smaller than a multi-service LGTM stack.
Apache SkyWalking
Apache SkyWalking is full-stack APM for microservices, cloud-native, and container architectures: auto-instrumentation, service topology, metrics and trace analysis in one platform, with an OTLP receiver for OpenTelemetry migration teams.
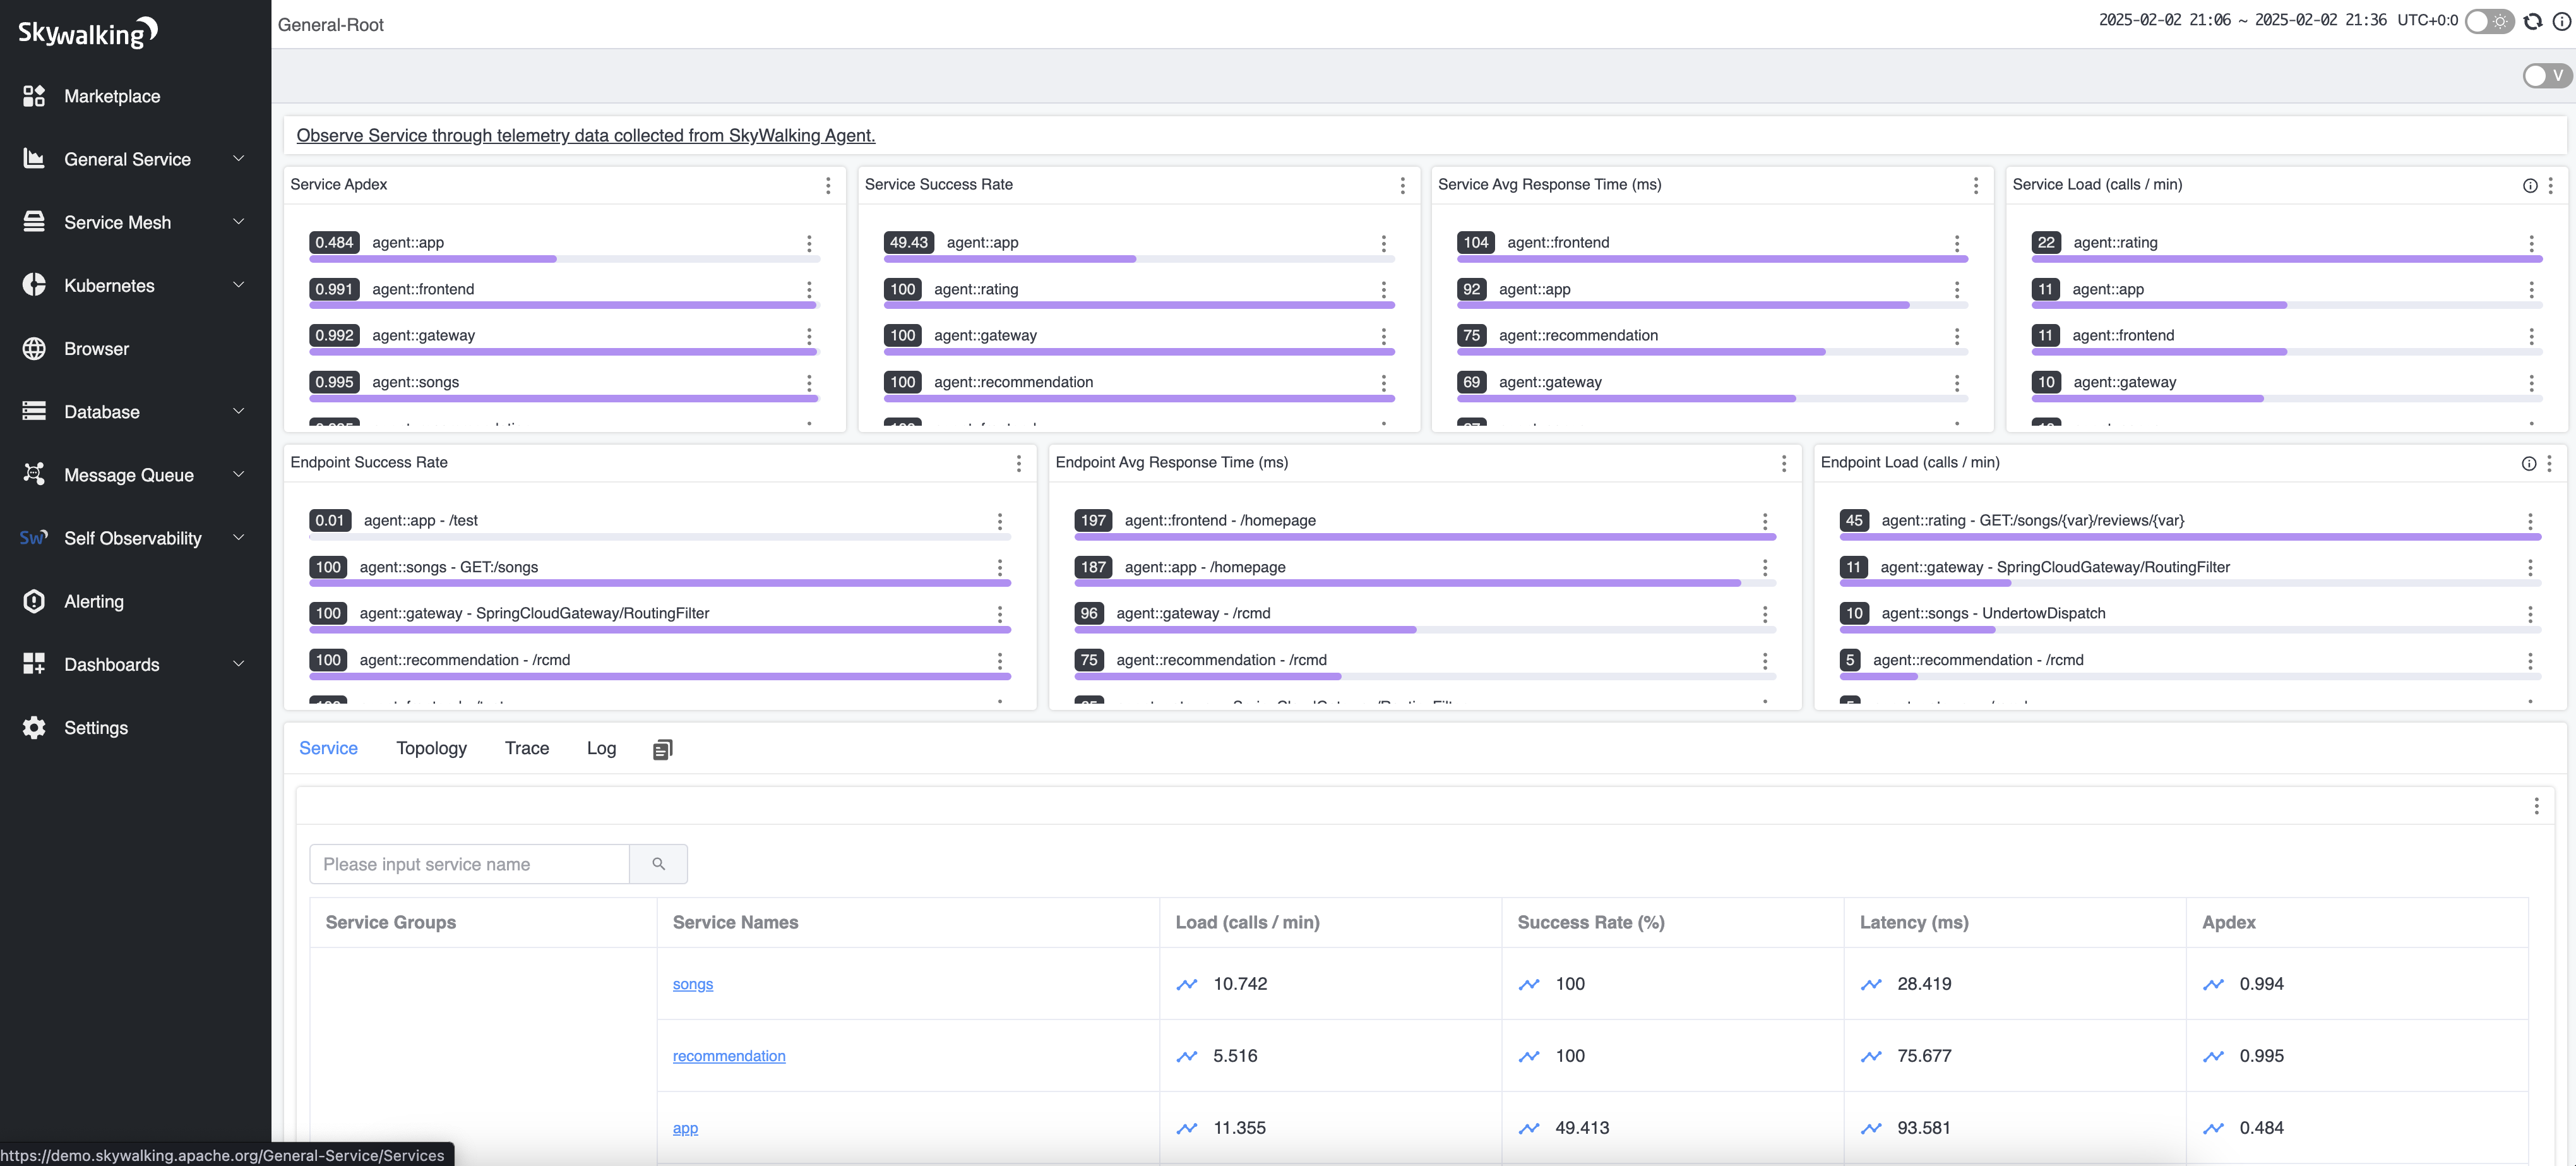
Apache SkyWalking · default observability dashboard
Apache SkyWalking Strengths
Full-stack APM — Traces, metrics, logs, and service-mesh observability on one platform Auto-instrumentation — Agents for Java, .NET, Node.js, Python; JVM bytecode-level visibility Service topology — Auto-generated dependency graphs with low service-catalog maintenance Customizable dashboards — Flexible multi-stack views by layer and entity Apache Foundation governance — Long track record in enterprise microservices
Apache SkyWalking Limitations
Strong agent heritage — pure OTLP teams may run agents in parallel during migration Full deployment heavier than a three-component unified backend English-speaking community smaller than Grafana/Prometheus ecosystem
Integration / Mitigation
OTLP receiver supports mixed instrumentation with OpenTelemetry SDK Kubernetes Operator and Helm ease scaled deployment Horizon UI next-gen console with a more modern experience on the same OAP backend
Best For
Organizations with heavy Java microservices wanting auto-instrumentation + topology + APM dashboards without assembling LGTM from scratch.
Grafana Tempo
Grafana Tempo is an open-source large-scale trace backend optimized for object-storage cost, deeply integrated with Grafana, Loki, and Prometheus/Mimir. It is the trace pillar in the modular LGTM pattern — not a standalone APM suite, but the standard trace store in the Grafana camp.
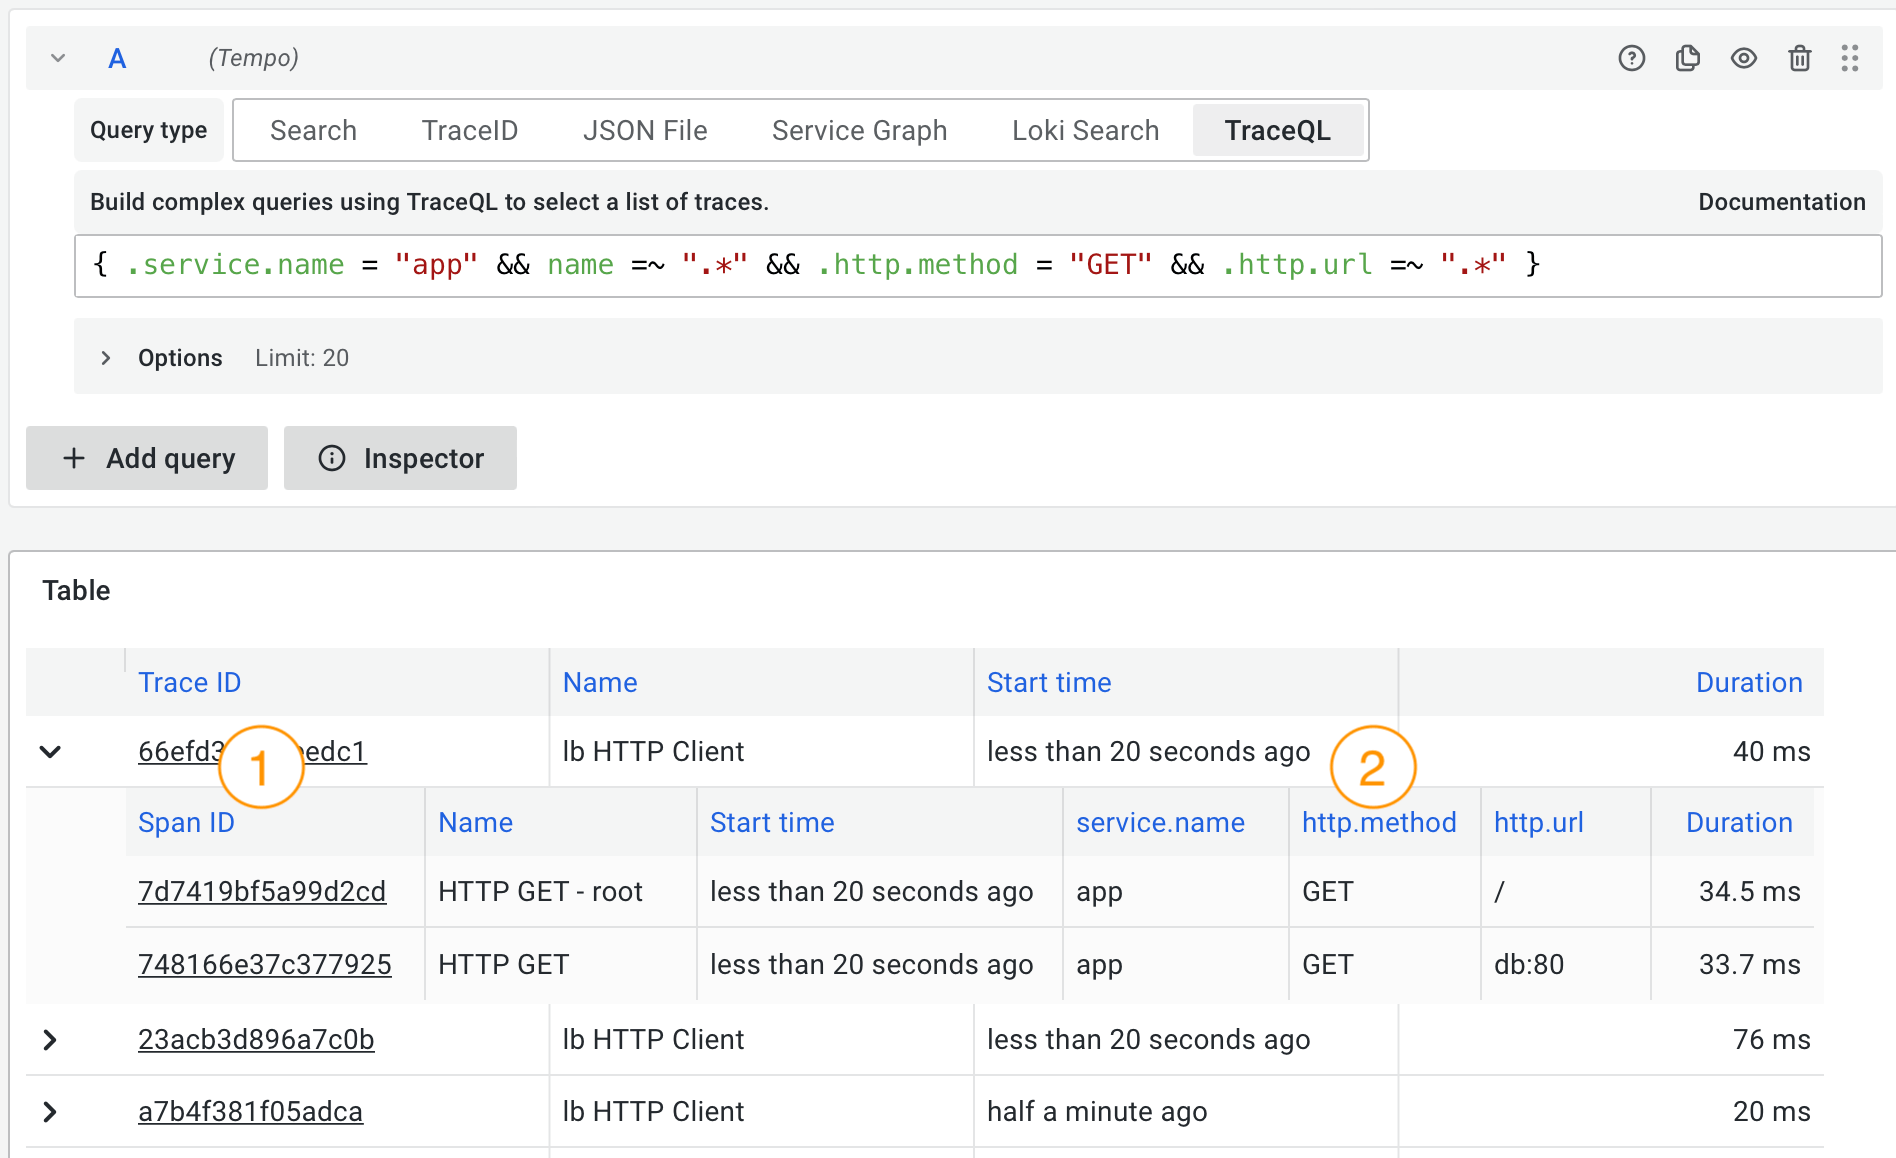
Grafana + Tempo · TraceQL search results in Explore
Grafana Tempo Strengths
Object-storage friendly — Controllable long-term trace retention cost at scale Native OpenTelemetry ingestion — OTLP path recommended for new deployments TraceQL — Trace-first query language; Explore provides a visual search builder Signal correlation — Jump from traces to logs and metrics via Loki and Prometheus Traces Drilldown — Point-and-click trace drill-down without writing TraceQL
Grafana Tempo Limitations
Full-stack observability requires assembling Grafana, Tempo, and often Prometheus/Loki APM semantics (service catalog, unified alerting) depend on how components are wired If you need one product UI covering all signals, unified platforms like SkyWalking or DataBuff are more out-of-the-box
Integration / Mitigation
Grafana Cloud reduces self-ops burden Helm/Operator simplifies Kubernetes deployment Adopt gradually — Tempo traces first, add Loki and Mimir as you mature
Best For
Teams deep on Grafana needing object-storage trace retention with TraceQL/drill-down analysis, accepting assembled observability over a single APM bundle.
Pinpoint
Pinpoint is open-source APM for large-scale distributed applications from Naver, inspired by Google Dapper. Bytecode-level method tracing, Server Map, and transaction analysis deliver deep code visibility without source changes — suited to Java-heavy production environments.
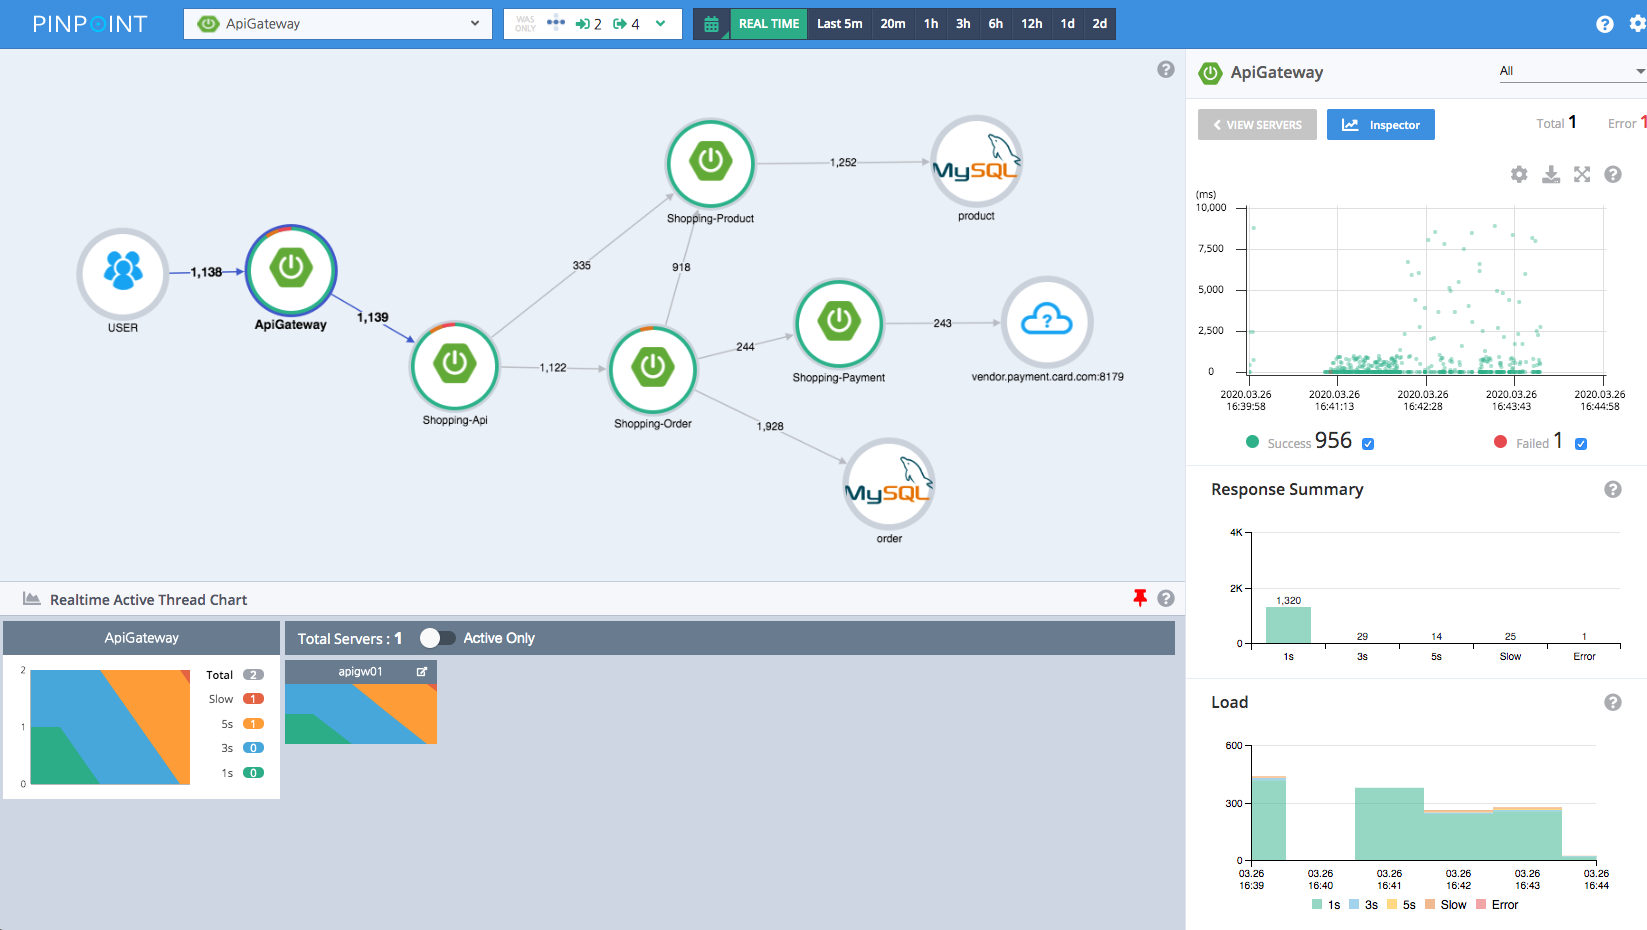
Pinpoint · Server Map service dependency topology
Pinpoint Strengths
Bytecode instrumentation — Method-level call trees, SQL timing, external API latency with zero code changes Server Map — Auto topology visualization for large microservice graphs Low agent overhead — Community benchmarks show ~3% resource impact (environment-dependent) Transaction tracing — Expandable call stacks to pinpoint slow SQL and remote calls Scale-oriented storage — HBase backend supports high-throughput trace writes
Pinpoint Limitations
Java and PHP focused — polyglot services often need an OTel-native backend alongside HBase cluster ops more complex than lightweight column-store options Not OpenTelemetry-native — OTLP-standardizing teams often run in parallel during migration UI paradigm feels last-generation vs Grafana-native or AI-native consoles
Integration / Mitigation
Try Docker quickly before committing to full HBase topology Keep Pinpoint Agent on JVM workloads; route other languages to an OTLP backend During hybrid migration, bridge Pinpoint APIs via MCP for queries
Best For
Large enterprises with high-throughput Java monoliths/microservices needing bytecode-level APM depth and HBase ops capacity.
◆ ◆ ◆
5Top 5 Open Source APM Tools Comparison Table
| Tool | Metrics | Traces | Unified APM UI | Native OTLP | AI / MCP | Typical Use Case |
|---|---|---|---|---|---|---|
| Jaeger | ❌ | ✅ | Trace-focused | ✅ | ❌ | CNCF dedicated trace backend |
| SkyWalking | ✅ | ✅ | ✅ | ✅ receiver | ❌ | Agent-rich Java microservices |
| DataBuff | ✅ | ✅ | ✅ | ✅ native | ✅ Skill + MCP | OTel + AI-native unified APM |
| Grafana Tempo | ⚠️ via Grafana | ✅ | ⚠️ composable | ✅ | ❌ | LGTM stack trace storage |
| Pinpoint | ✅ | ✅ | ✅ | ❌ | ❌ | Java bytecode deep APM |
◆ ◆ ◆