When AI troubleshooting fails, people blame the Prompt, then the model. More often the problem is upstream: the telemetry you feed the AI is not good enough — APIs, SQL, entrypoints, and hops don’t line up, so even a strong model can only tell you to “go dig the traces yourself.” Same rule as RAG and AI support: bad data, fancy layers don’t help.
How do you know you “pass”? This article does three things: set a four-question bar → score DataBuff, SkyWalking, Jaeger, Pinpoint, SigNoz, and OpenObserve with the same ruler → show how DataBuff uses 12 fixed metric_service_* tables to meet that bar.
1. A scenario you’ve probably hit
Checkout is slow in production. You plug AI into your APM and ask:
“Why is checkout slow? Which SQL is the bottleneck?”
Fail
“Please open the trace detail, find the root span manually, then correlate the DB span…”
AI becomes a fancy search box — barely better than no AI.
Pass
“Slow on SELECT … FROM orders, triggered by /checkout; the payment hop has the highest latency.”
No raw-trace digging — a direct answer.
Analogy: raw telemetry is unlabeled video footage; a high-quality dataset is a fixed-column spreadsheet — which API, which SQL, who triggered it — AI can answer from that.
2. The bar: AI troubleshooting must answer four questions
Forget field names. Ask your APM these four (with or without AI) — can it answer directly? That’s the bar. Next section applies the same ruler to six products.
- Which API is broken? HTTP, DB, and MQ must not share one Span-name pile. Redis GET and checkout POST need separate stats.
- Which SQL / which database is slow? “MySQL avg 50ms” is not enough — you need the exact statement.
- Which page triggered the slow SQL? The critical question. Many stacks can’t answer — you’re sent back to hunt the entry by hand.
- Which hop on the call path is dragging? order → payment → MySQL: traffic and errors per hop — not just a topology thumbnail.
3. App-performance matrix: where the six diverge
Bar set — look at the product surface. Same-environment application performance matrix: basics (topology / service list / Trace) are common; the highlighted rows open the gap: call analysis, service flow, middleware pages.
Versions: DataBuff v0.1.7 · SkyWalking 10.4.0 · Jaeger 1.76 · Pinpoint 3.1.0 · SigNoz 0.133 · OpenObserve 0.91-rc1.
| Capability | DataBuff | SkyWalking | Jaeger | Pinpoint | SigNoz | OpenObserve |
|---|---|---|---|---|---|---|
| 1. Global topology | ✅ | ✅ | △ | ✅ | ✅ | ❌ |
| 2. Service list / golden metrics | ✅ | ✅ | ❌ | ✅ | ✅ | ✅ |
| 3. Service-level topology | ✅ | ✅ | △ | ✅ | △ | ❌ |
| 4. Service call analysisUpstream/downstream metrics + Trace link | ✅ | ❌ | ❌ | ❌ | ❌ | ❌ |
| 5. Instance golden metrics | ✅ | ✅ | ❌ | △ | ❌ | ❌ |
| 6. Instance topology | ✅ | ❌ | ❌ | ❌ | ❌ | ❌ |
| 7. Instance call analysis | ✅ | ❌ | ❌ | ❌ | ❌ | ❌ |
| 8. API-level topology | ✅ | ❌ | ❌ | ❌ | ❌ | ❌ |
| 9. API call analysisAPI upstream/downstream metrics + Trace link | ✅ | ❌ | ❌ | △ | ❌ | ❌ |
| 10. Service flowTrace-level metric analysis | ✅ | ❌ | ❌ | ❌ | ❌ | ❌ |
| 11. Middleware pagesDB / cache / MQ · Q2 & Q3 | ✅ | ❌ | ❌ | △ | ❌ | ❌ |
| 12. Error analysis | ✅ | ❌ | ❌ | △ | ❌ | △ |
| 13. Trace list / search | ✅ | ✅ | ✅ | ✅ | ✅ | ✅ |
| 14. Trace detail | ✅ | ✅ | ✅ | ✅ | ✅ | ✅ |
| 15. Span ↔ logs | ✅ | ✅ | △ | ❌ | ✅ | ✅ |
| 16. Log list / search | ✅ | ✅ | ❌ | ❌ | ✅ | ✅ |
| 17. Log detail | ✅ | ✅ | ❌ | ❌ | ✅ | ✅ |
| 18. Logs ↔ Trace | ✅ | ✅ | ❌ | ❌ | ✅ | ✅ |
1. All six can search traces; the gap is in the highlighted rows: call analysis, service flow, middleware pages.
2. For humans staring at UI, SkyWalking / Pinpoint often suffice; for AI to answer the four questions, you need that depth.
3. Green cells aren’t extra menus — they’re the backbone of the causality chain: which API, which SQL, who triggered it, which hop dragged.
4. How do you prepare a passing dataset?
The highlighted capabilities in §3 aren’t pages bolted on later — incoming spans are written into fixed tables by type. DataBuff ships this as 12 metric_service_* tables — learn the 12 first, then how to query.
↓ Split by type: HTTP / DB / Redis / MQ / RPC… one table each — not mixed Span names
↓ Freeze key columns: entry API, SQL digest, path hops sit with the metrics
↓ Query joins the chain; UI grows middleware pages / service flow / call analysis
The 12 tables (fixed names — AI / Text-to-SQL doesn’t guess schema):
| # | Table | Stores | Answers |
|---|---|---|---|
| 1 | metric_service | Service-entry RED | Is this service healthy (QPS / error / latency)? |
| 2 | metric_service_trace | Trace root | End-to-end success and duration |
| 3 | metric_service_http | HTTP API typing | Which URL / method / status is bad? |
| 4 | metric_service_db | DB calls | Which SQL is slow, which DB, who triggered (entry on same row) |
| 5 | metric_service_flow | Entry path tree | From entry, which hop drags? |
| 6 | metric_service_rpc | RPC calls | gRPC / Dubbo method & status |
| 7 | metric_service_redis | Cache calls | Who issues GET/SET, is it slow? |
| 8 | metric_service_mq | Messaging | Topic produce/consume, lag & latency |
| 9 | metric_service_remote | External deps | External API QPS / latency |
| 10 | metric_service_exception | Entry exceptions | Exception name / code (entry only) |
| 11 | metric_service_config | Config reads | Are Nacos / ZK reads slow? |
| 12 | metric_service_instance | Instance metadata | Pod / host / Java version (for JOIN) |
Three groups: entry & whole request (1–2) · typed components (3–4, 6–11 → middleware pages) · path & instance (5 service flow, 12 instance). For the four questions, lead with 1 / 3 / 4 / 5.
Three words before you query
- tag
- Filter columns (
url,sqlContent,rootResource) — WHERE / GROUP BY. - field
- Numeric columns (
cnt,sumDuration) — QPS, error rate, avg latency. - virtual service
- e.g.
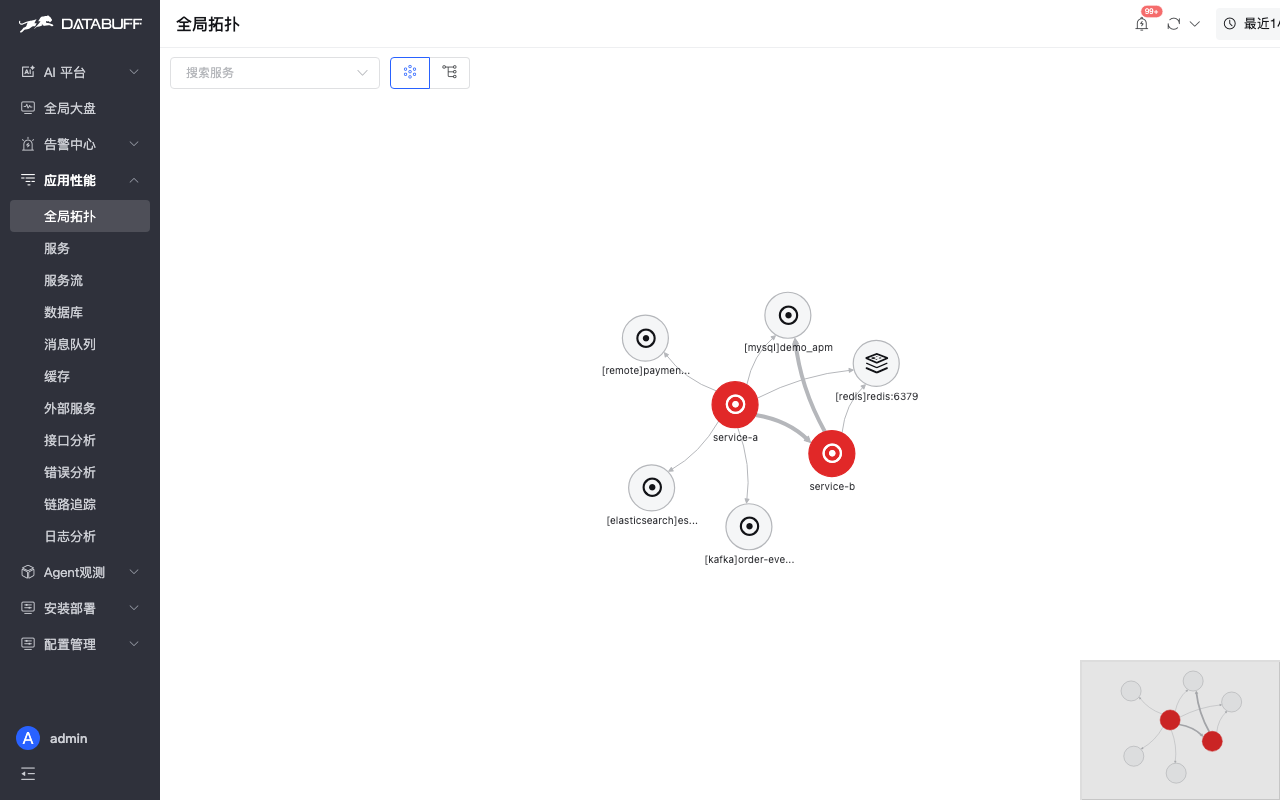
[mysql]demo_apm: DB / cache as topology nodes, not buried in the web service name.
5. Four questions → which table
Summary first, then warmup → Q1–Q4. Only tags used to answer.
| Question | Primary table | Key tags |
|---|---|---|
| Is the service healthy? (warmup) | metric_service | service, errorType |
| 1. Which API is broken? | metric_service_http | url, httpMethod, httpCode |
| 2. Which SQL is slow? | metric_service_db | sqlContent, isSlow |
| 3. Who triggered the slow SQL? | metric_service_db | rootResource (same row as sqlContent) |
| 4. Which hop drags? | metric_service_flow | entryInterfacePathId, pathId, parentService |
① metric_service — is the service healthy? (warmup)
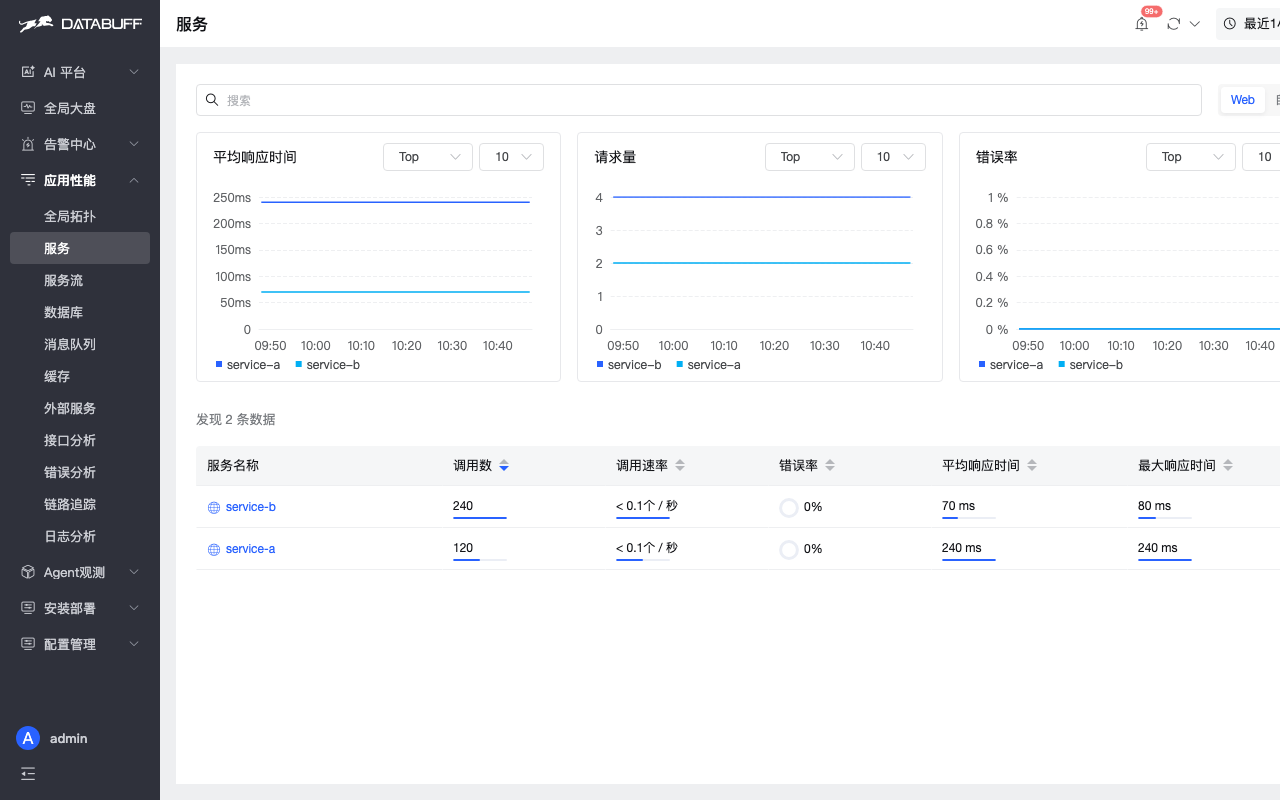
Answers: “service-a QPS, error rate, avg latency today?”
When is a row written? Only entry requests (what the user hit) — filter out DB / Redis / MQ spans.
Key tags
service | Service name, service-list KPI key |
errorType | ok / error in separate rows — don’t mix dimensions |
serviceInstance | Which Pod / instance is dragging |
Common fields: cnt→QPS; error÷cnt→error rate; sumDuration÷cnt→avg latency.
metric_service (QPS / error / latency)② metric_service_http — Q1: which API is slow
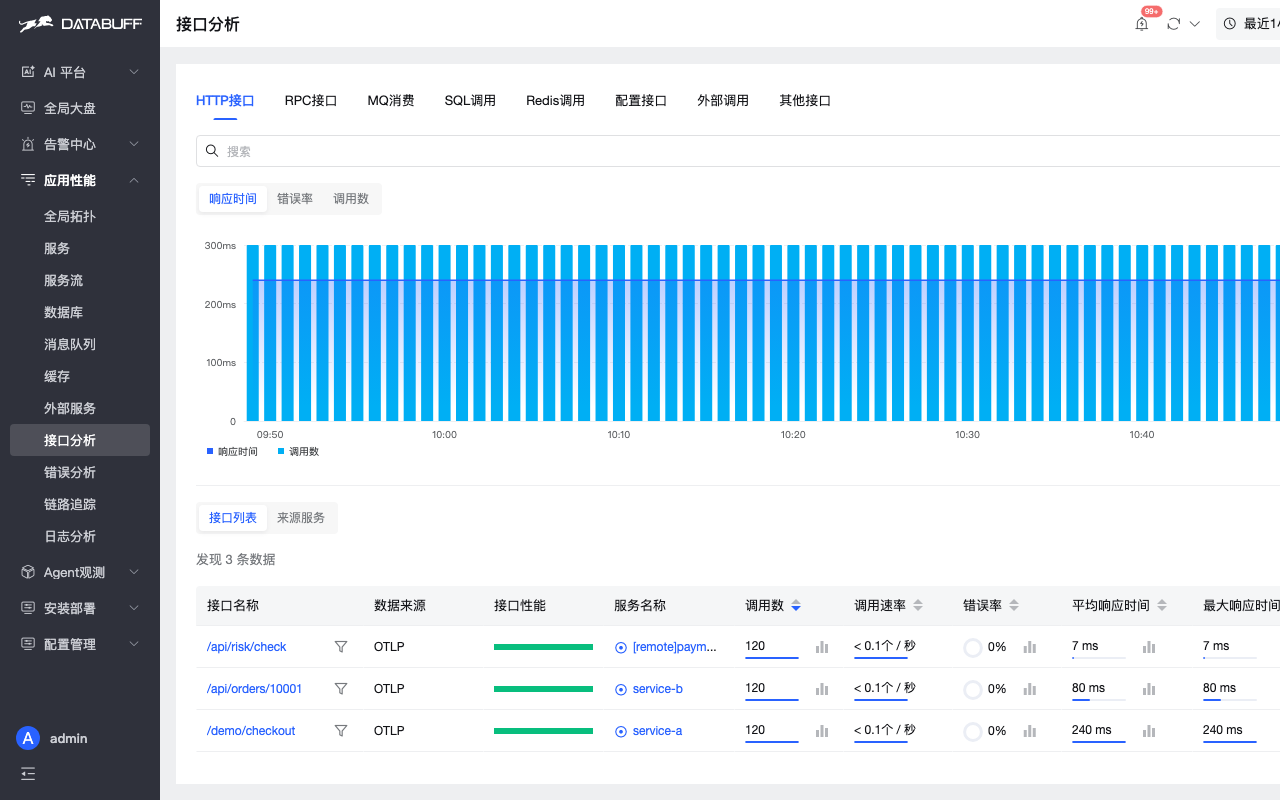
Answers: “Slowest URL? GET or POST? 4xx or 5xx?”
Key tags
url | Normalized HTTP path, slow-API ranking |
httpMethod / httpCode | Method and status counted separately |
rootResource | Outbound calls still attach to “who started it” |
durationRange | Latency buckets — GROUP BY for histograms |
/demo/checkout as their own rows (metric_service_http)③ metric_service_db — Q2 & Q3: slow SQL + who triggered
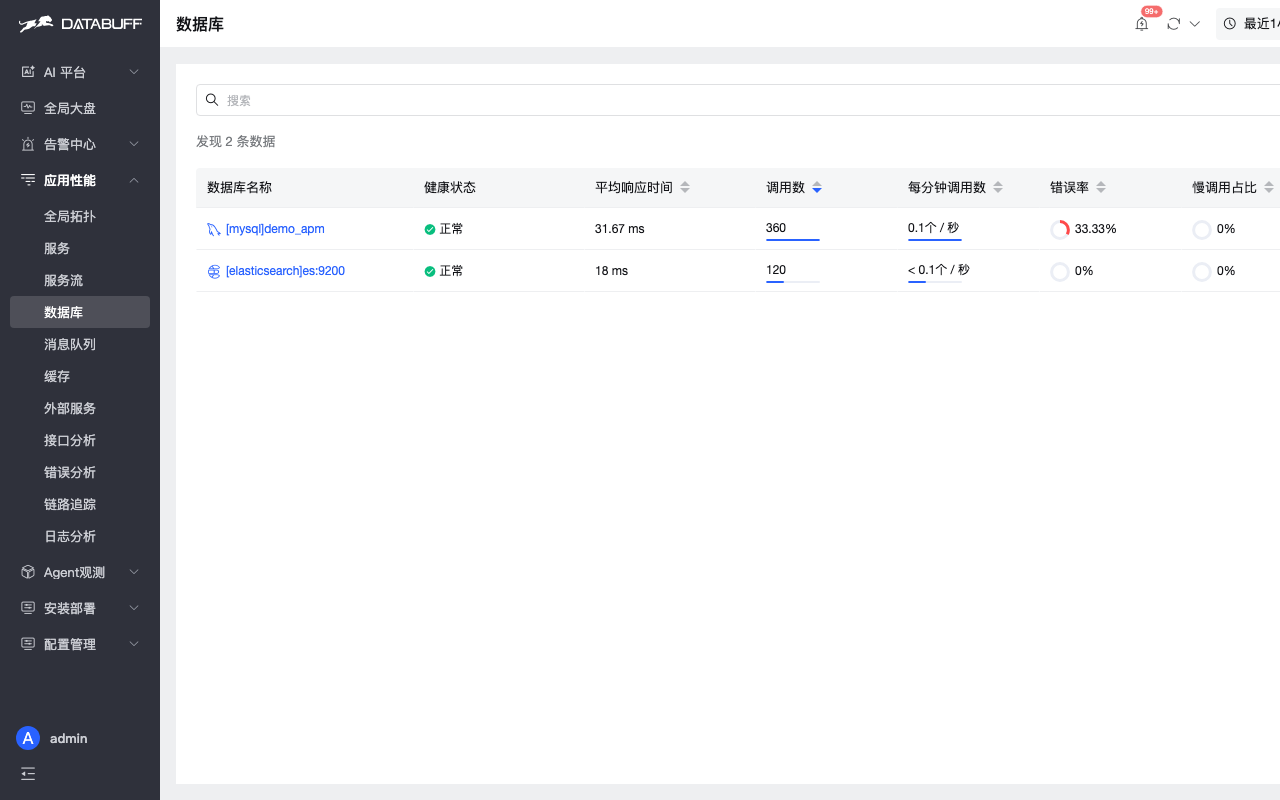
Answers: “Which SQL is slow? Which entry triggered it?” — same table, same row
Key tags
sqlContent | Statement digest, SQL-level TOP |
isSlow | 1 = slow-SQL row |
rootResource | Entry API on the same row as sqlContent → no Trace hunt for the trigger |
sqlDatabase / dbType | Which DB / engine |
DBs appear as virtual services (e.g. [mysql]demo_apm); the dedicated page aggregates this table. sqlContent + rootResource on one row is the most important design for the bar.
[mysql]demo_apm / ES as virtual services (metric_service_db)④ metric_service_flow — Q4: which hop drags
Answers: “From service-a entry, how much response each hop contributes?”
Note: the path tree is computed once a Trace is complete — not one hop per arriving Span.
→ service-b (response share 58%)
→ [mysql]demo_apm
→ [elasticsearch] / [mysql]demo_apm …
Key tags
entryInterfacePathId | Fingerprint of the entry |
pathId | Hop position in the path tree |
parentService | Previous-hop service |
resource | Current hop operation |
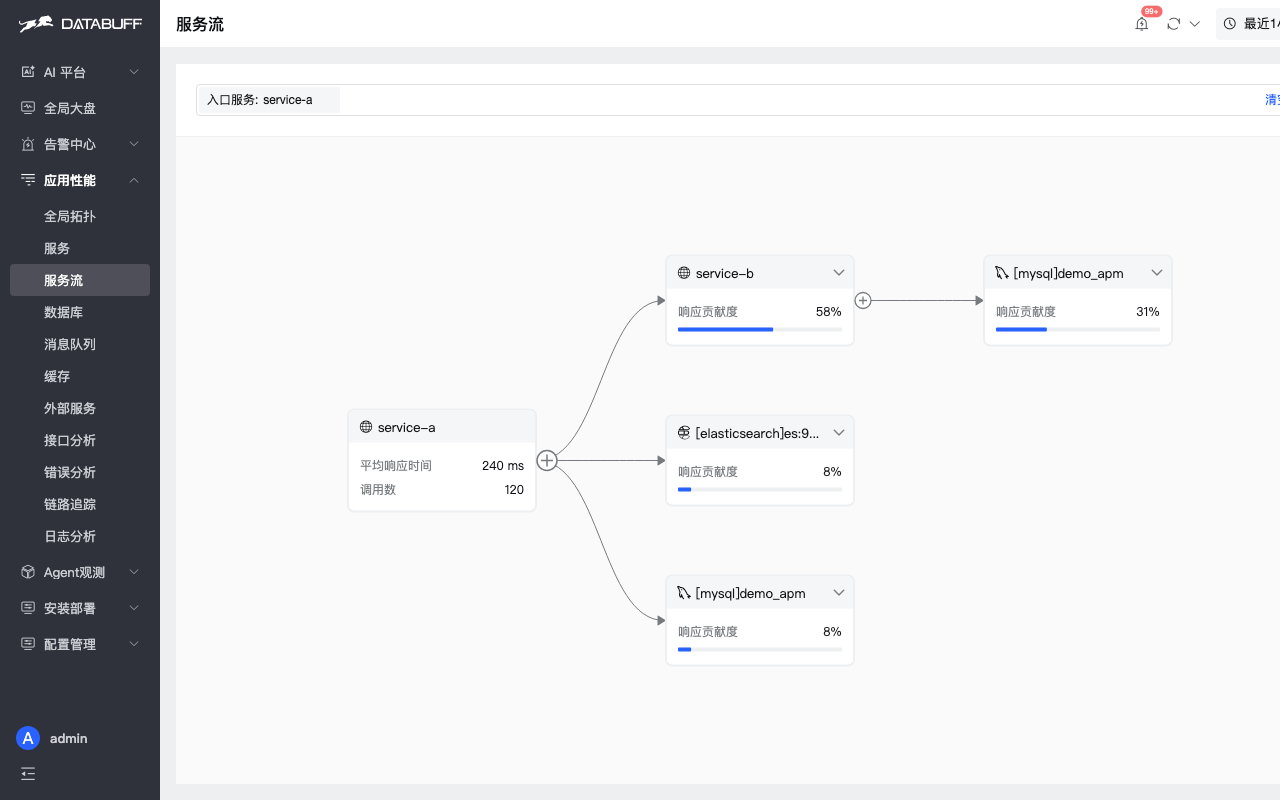
metric_service_flow)6. End-to-end: join tables for slow checkout
Wire the tables into one path — back to “why is checkout slow?”:
- Entry health —
metric_service: did service-a error rate / avg latency spike? - Pin the slow API —
metric_service_http: confirmurlis/demo/checkout. - Slow SQL + trigger —
metric_service_db:rootResource='/demo/checkout' AND isSlow=1, digest on the same row. - Which hop drags —
metric_service_flow: expand from service-a, compare response share per hop. - (Optional) which machine —
serviceInstanceJOINmetric_service_instance.
7. Three-step self-check: does your dataset pass?
- Run the four questionsIf one answer is “dig the traces yourself,” you fail. Chat ≠ troubleshooting.
- Check §3 highlighted rowsCall analysis / service flow / middleware pages — ✅ or ❌? Especially “slow SQL → entry.”
- If you fail?Add fixed columns (entry API, SQL digest) at write time — or switch to a more complete dataset.
Try DataBuff
Open source · OpenTelemetry · datasets designed for AI querying
Live Demo: https://demo.databuff.ai
GitHub: https://github.com/databufflabs/databuff
💬 Discussion
How many of the four can you answer? Which stack? Comment — and check §3 for which highlighted rows you’re missing.
Authoritative fields: repo metric-catalog.json · impl: DcSpanUtil · ServiceFlowExtractor