
User Guide · Application Performance
What It Is
See how your applications actually perform — from global topology down to every call, drilling layer by layer to find issues.
The DataBuff application performance module aggregates services, components, endpoints, and traces from OpenTelemetry telemetry, supporting a topology → metrics → traces troubleshooting path.
Core Concepts
Understand these seven concepts before you start:
| Concept | Description | In the platform |
|---|---|---|
| Service | A set of logically identical processes with the same business role, e.g. service-a | Service list, service detail |
| Virtual service | Middleware or external dependency called by an app — no agent of its own; inferred from caller traces, named [type]instance, e.g. [mysql]dcgl, [redis]192.168.50.19:31379 | Bracket nodes in global topology; database/cache/MQ lists |
| Service instance | A single runtime unit of a service, usually a Pod or process | Service detail → Relationships → Instance list |
| Endpoint | A concrete entry point exposed by a service, e.g. HTTP path or RPC method | Endpoint analysis, endpoint detail |
| Error | Failures during request execution — HTTP 5xx, Java exceptions, etc. | Error analysis, service error rate, error markers on traces |
| Service flow | Directed graph of service-to-service calls — "who calls whom" | Service flow page, service detail → Relationships |
| Distributed trace | Full path of one request from entry through downstreams, made of spans | Trace search, trace detail |
Service vs virtual service: A service is the instrumented application itself; a virtual service is a database, cache, or message queue the app accesses — extracted automatically from outbound spans, no separate ingestion required.
Best Practice: Topology → Metrics → Traces
For performance or incident triage, drill down in this order — macro first, then micro; narrow scope before root cause:
| Step | What to do | Entry |
|---|---|---|
| ① Topology | Global scan for red/yellow services or components | Application Performance → Global Topology |
| ② Metrics | Open abnormal service; check latency, error rate, call volume | Click topology node → Service Detail |
| ③ Up/downstream | Decide if issue is local or propagated | Service detail → Relationships |
| ④ Endpoint/component | Pinpoint API, SQL, or middleware call | Service detail → Endpoint Call Analysis |
| ⑤ Call detail | Click abnormal point on metric chart to open trace list | Endpoint Call Detail → click chart |
| ⑥ Trace | Open a trace; find slowest or failing span | Trace detail |
Note: When an entry service turns red, root cause is often further downstream. Don't stop at the first red node — follow the call chain.
You can also skip straight to AI Platform and do all of the above through conversation.
Walkthrough: service-a Red in Topology, Root Cause Is SQL in service-g
This example uses real data from test environment 192.168.50.140:27403 during 2026-06-20 06:48–07:03.
Symptom: service-a is red in global topology; service-c is also abnormal.
Conclusion: Follow the call chain downstream to service-g. In Endpoint Call Analysis, the SQL select * from tableA limit ? to [mysql]dcgl shows high latency. Click the latency spike on the chart to drill into traces and confirm the SQL span is slow. Cross-check in Database Detail → Slow SQL — that statement has the most slow calls (242), driving service-a error rate up.
Step ① Global Topology · Spot Anomaly
Application Performance → Global Topology — service-a is red, indicating errors or performance issues in the time window.
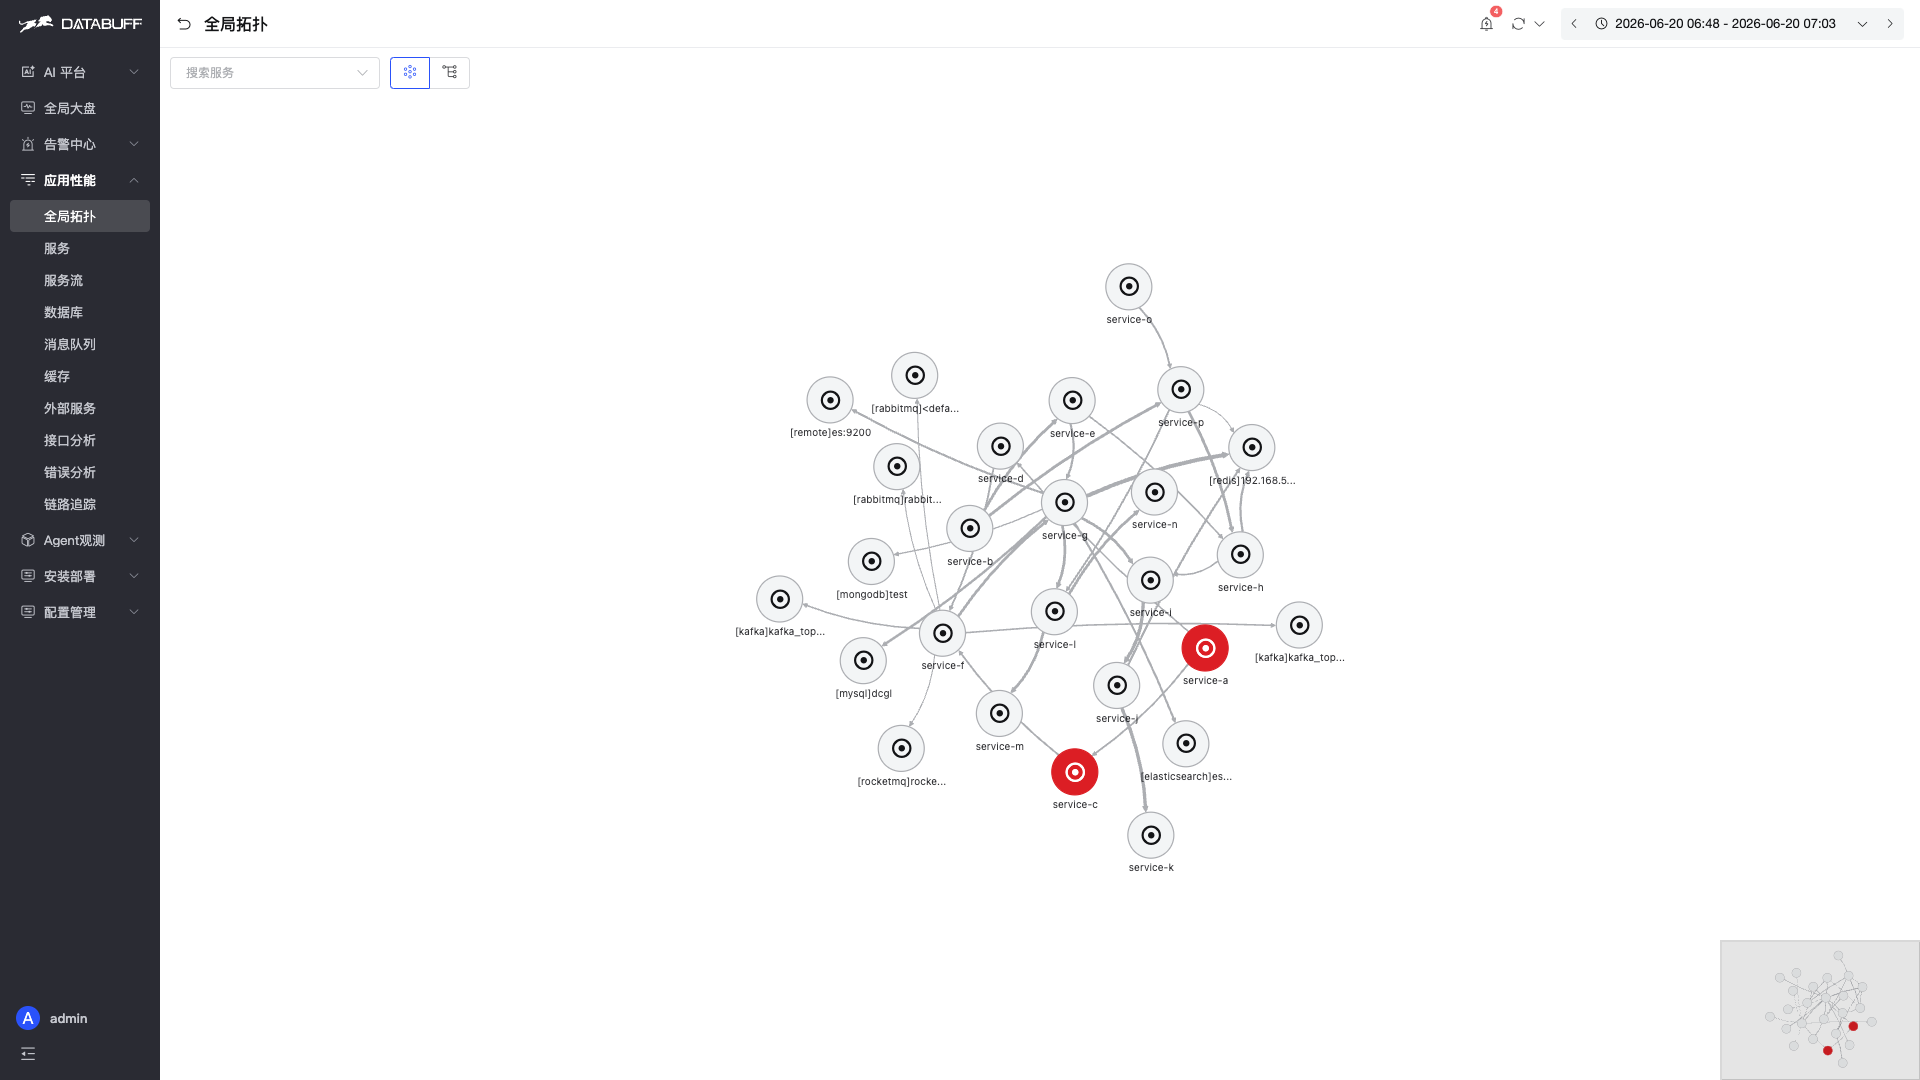
Click the service-a node to open service detail.
Step ② Service Detail · Confirm Metrics
On the Basic Info tab, three core charts confirm the issue:
- Response time: spike near 07:02, peaking near 9s
- Call volume: red failure segment at the end
- Error rate: jumps from 0% to ~15%
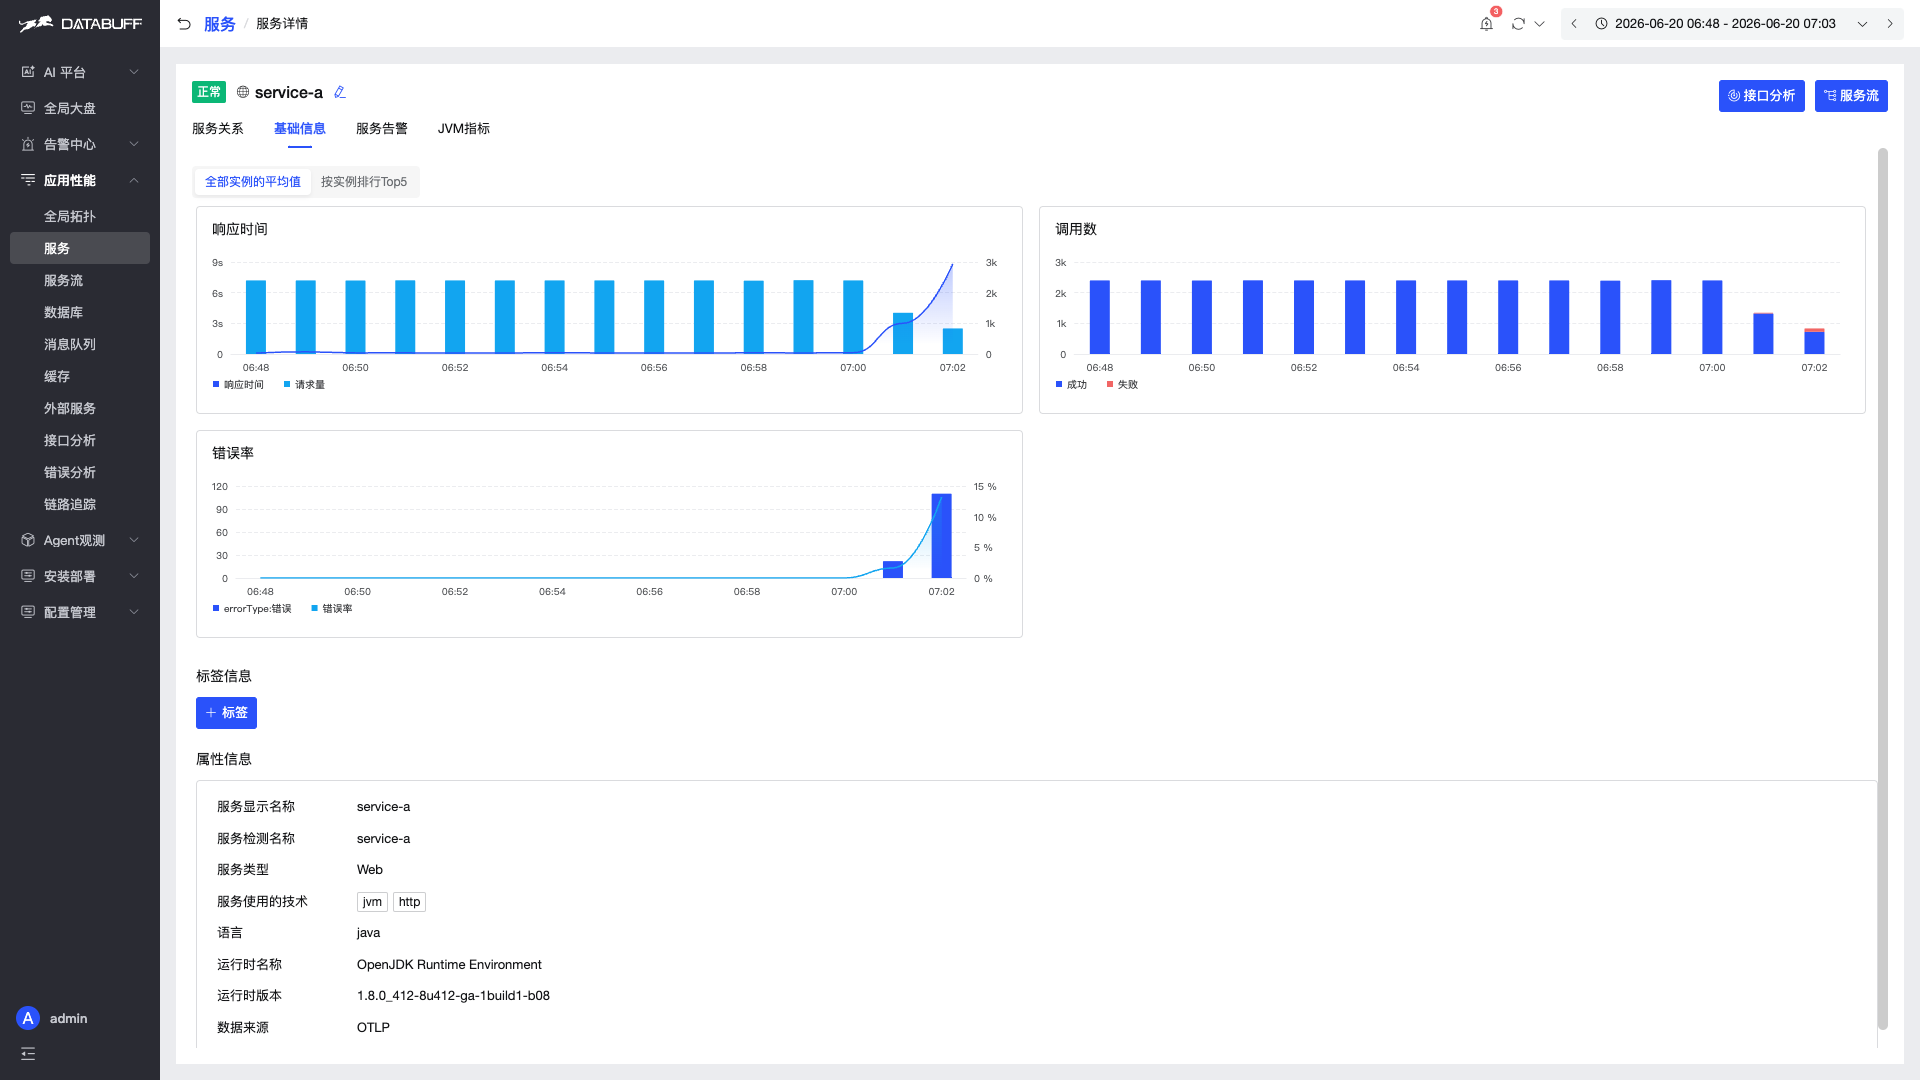
Example URL:
/appMonitor/serviceDetail?sn=service-a&sid=9bf61532d56eb7b5&activeName=tab-baseinfo
Step ③ Follow Call Chain Downstream · Reach service-g
Switch to Relationships for service-a:
- Upstream: 1 HTTP caller
- Downstream: 3 HTTP services + 2 RPC services
service-a metrics are bad, but root cause is often downstream. Follow downstream services layer by layer until service-g detail → Relationships, which shows downstream [mysql]dcgl.
Click [mysql]dcgl to open Endpoint Call Analysis (caller service-g → callee [mysql]dcgl). Sort SQL by response time — highest: select * from tableA limit ?.
This section is in-page navigation; no extra screenshot.
Step ④ Endpoint Call Detail · Click Latency Spike
Click that SQL row for Endpoint Call Detail:
- Caller: service-g
- Callee:
[mysql]dcgl - Response time comparison: stable under 300ms before 07:00; jumps to ~1.2s from 07:01
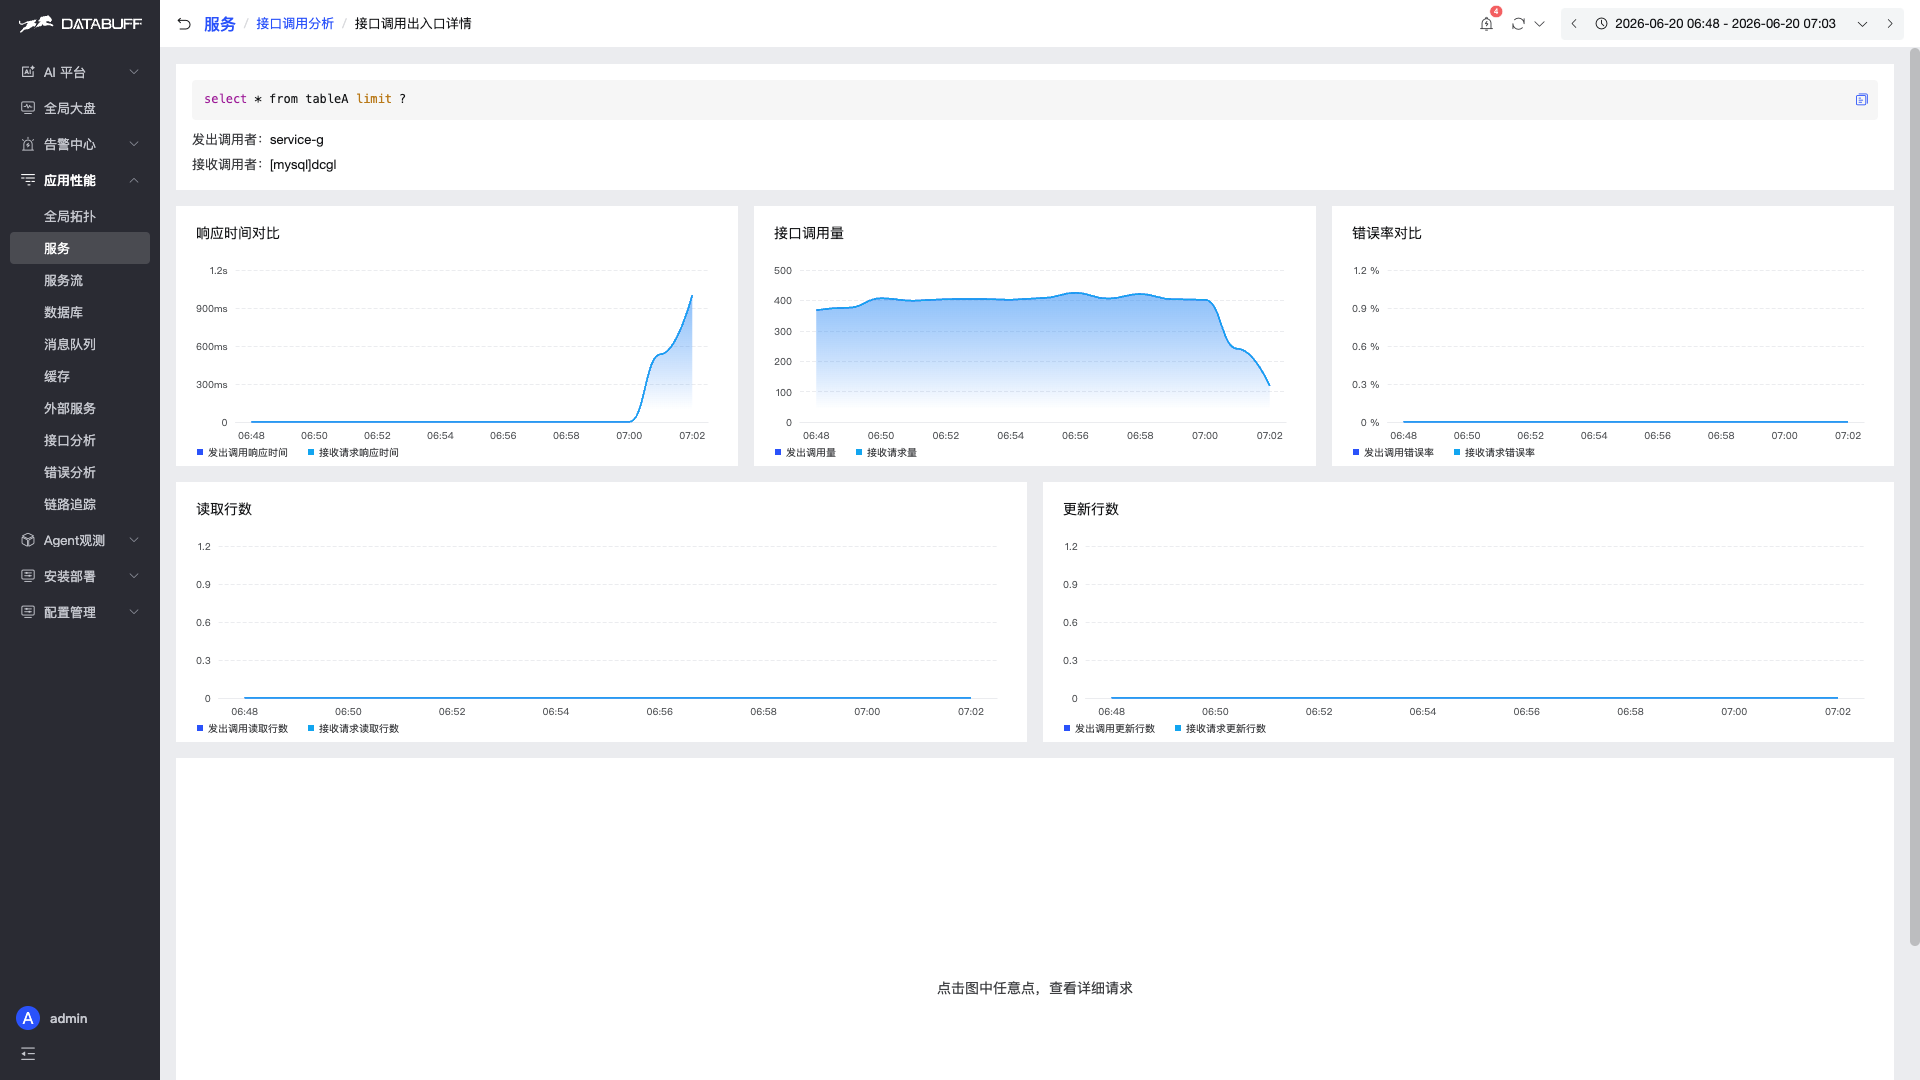
The page prompts "Click any point on the chart to view requests" — click the spike near 07:02 on Response time comparison to open traces sorted by latency.
Example URL:
/appMonitor/serviceCallDetail?componentType=service.db&resource=select * from tableA limit ?&sn=[mysql]dcgl&srcSn=service-g&...
Step ⑤ Trace Detail · Confirm SQL Span
Pick the slowest trace from the list and open Trace Detail.
In the waterfall:
service-a → … → service-g → select * from tableA limit ? ([mysql]dcgl)Root-cause span: service-g executing select * from tableA limit ? on [mysql]dcgl — much slower than other spans; latency propagates upstream and turns service-a red.
Step ⑥ Database Slow SQL · Cross-check
From the component view: Application Performance → Database → [mysql]dcgl, open Slow SQL tab.
Sorted by call count, select * from tableA limit ? has the most slow calls (242), avg 1.03s, max 4.63s — consistent with steps ④ and ⑤.
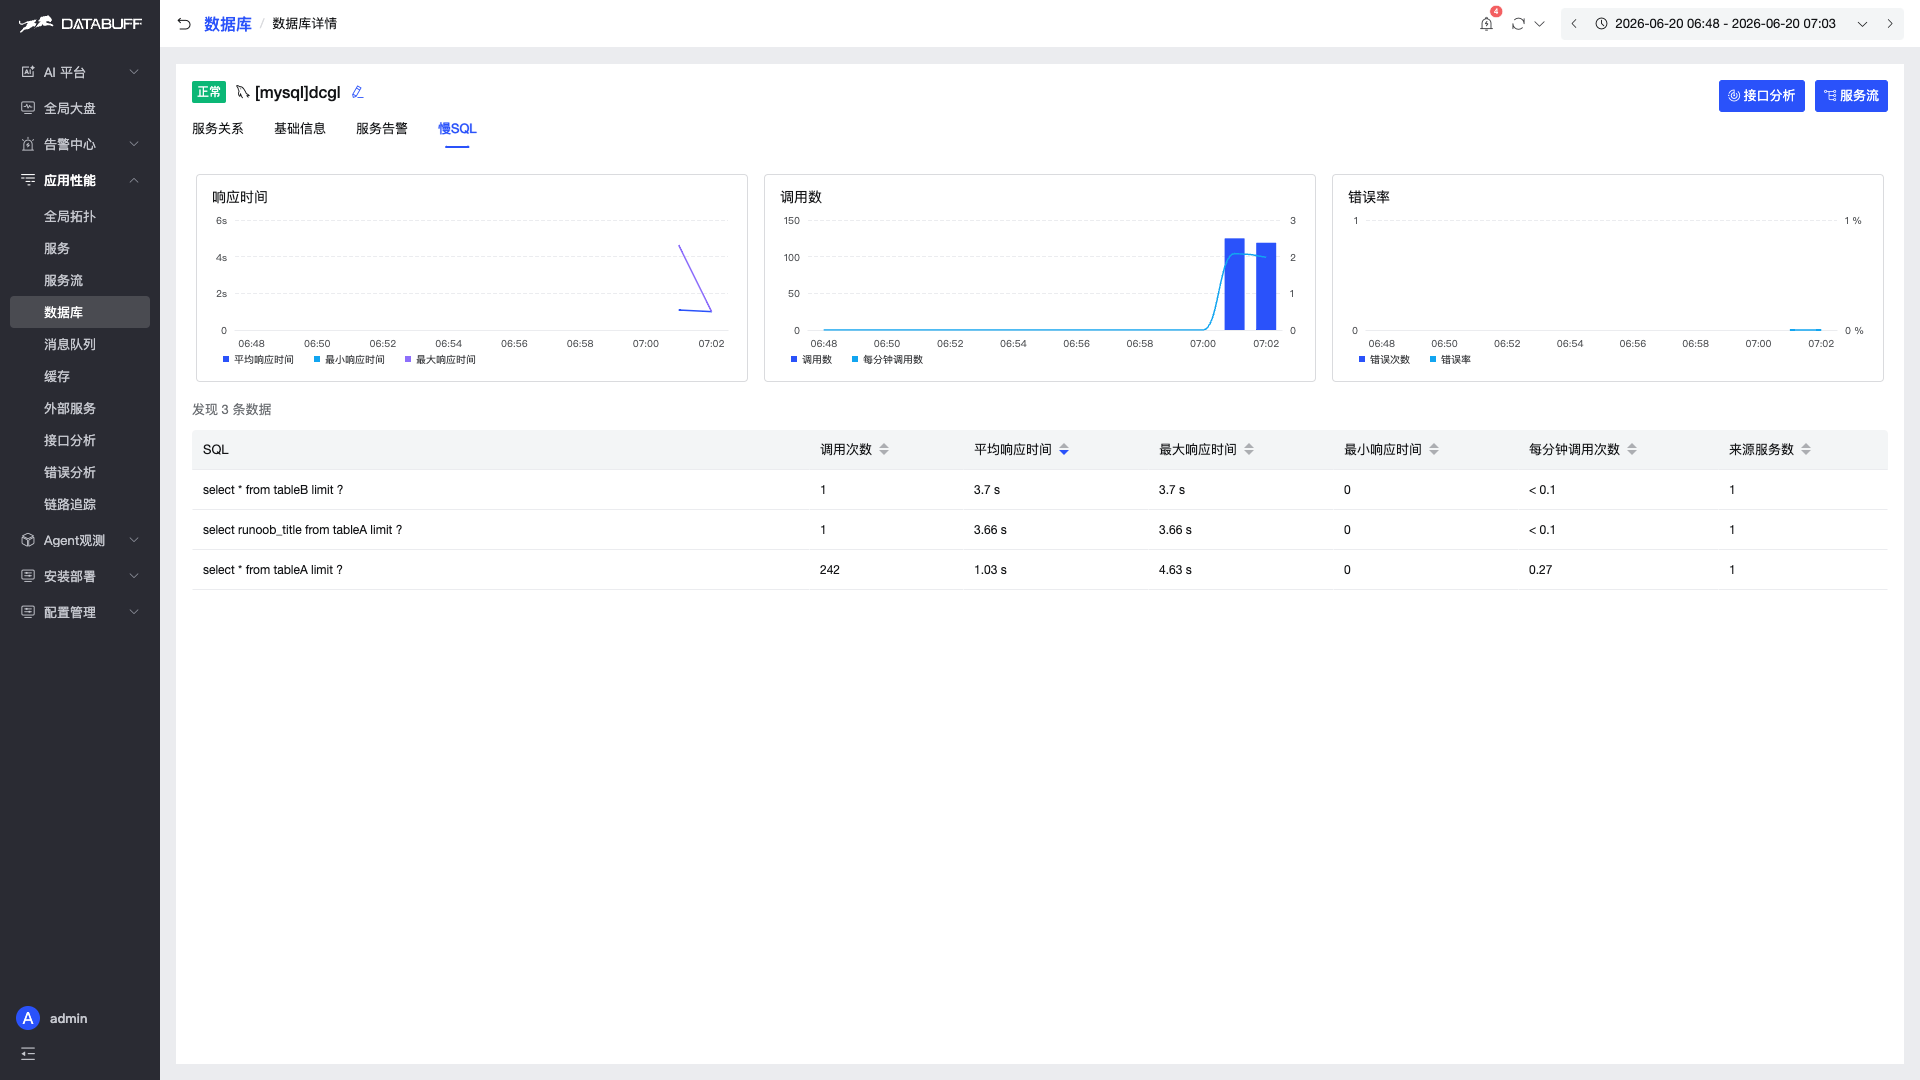
Example URL:
/appMonitor/database/detail?sn=[mysql]dcgl&sid=d8fee765095c69d8&activeName=tab-sql
From database detail you can also click the SQL row to jump to endpoint call detail or traces for bidirectional verification.
Case Summary
| Phase | What you see | Next step |
|---|---|---|
| Topology | service-a red | Open service detail |
| Metrics | Error rate / latency spike | Check relationships |
| Downstream | service-g → [mysql]dcgl | DB node → endpoint call analysis |
| Call analysis | select * from tableA limit ? highest latency | Open endpoint call detail |
| Call detail | Latency ~1.2s at 07:02 | Click chart spike |
| Trace | SQL span slowest | Slow SQL cross-check |
| Slow SQL | tableA: 242 slow calls | Optimize SQL / add index |
Feature Quick Reference
| Capability | Entry | Use case |
|---|---|---|
| Global topology | Application Performance → Global Topology | Health scan, architecture overview |
| Service list | Application Performance → Services | Sort by metrics to find top offenders |
| Service detail | Click service name | Per-service metrics, relationships, instances |
| Endpoint analysis | Service detail → Endpoint analysis | Slow or high-error endpoints |
| Endpoint call analysis | Service detail → downstream component | Which DB/MQ/external calls; slow SQL |
| Endpoint call detail | Endpoint call analysis → click SQL/endpoint | Per-call metrics; click chart → traces |
| Service flow | Application Performance → Service Flow | Global service-to-service view |
| Error analysis | Application Performance → Error Analysis | Aggregate by exception type |
| Trace search | Application Performance → Traces | Full path of one request |
| Database detail | Application Performance → Database → instance | Slow SQL tab by call count |
| Database / cache / MQ | Application Performance → respective menu | Component-centric troubleshooting |