
Performance Tuning and Capacity Planning
This guide covers Docker one-line install resource baselines, ingest pipeline and Doris storage tuning, web query settings, and agent/SDK volume reduction. Install paths and ports: Docker Operations.
1. Capacity Overview
Default architecture
Docker runs four containers (Doris FE + BE, ingest, web). Telemetry enters via OTLP, batches into Doris, and is queried by the web platform. See Telemetry Pipeline and Storage.
Host resource guidance
Limits below come from deploy/docker/docker-compose.yml (installed copy at /opt/databuff-ai-apm/docker-compose.yml).
| Tier | CPU (cores) | Memory | Notes |
|---|---|---|---|
| Minimum viable | ≥ 6 | ≥ 16 GiB | Container limits total ~6 CPU / 15 GiB; leave headroom for the OS and page cache |
| Production starter | ≥ 8 | ≥ 32 GiB | Moderate telemetry at default 30-day retention; BE is the main storage/compaction consumer |
| High load | Scale with telemetry growth | Prefer more BE memory and disk | Tune agent sampling and retention before ingest/BE |
| Component | CPU limit | Memory limit | JVM / notes |
|---|---|---|---|
| Doris FE | 1 | 2 GiB | Startup script patches FE -Xmx to 1200m (default 8192m OOMs in a 2g container) |
| Doris BE | 2 | 6 GiB | Column storage, compaction, Stream Load |
| ingest | 2 | 5 GiB | JAVA_TOOL_OPTIONS: -Xms1g -Xmx4g |
| web | 1 | 2 GiB | JAVA_TOOL_OPTIONS: -Xms512m -Xmx1536m |
OOM: Unpatched FE or undersized BE memory can get containers killed. See Docker Operations — Common issues.
Telemetry volume estimation (methodology)
Use these for planning, not as benchmark results. Plug in your own sampling rates and payload sizes.
| Signal | Inputs | Rough relationship |
|---|---|---|
| Trace | S = spans/s, R = retention days | Daily rows ≈ S × 86400; disk scales with span width and meta size |
| Metrics | M = Doris metric rows/min (incl. minute rollups) | Daily rows ≈ M × 1440; many metric_* tables amplify per-service cardinality |
| Logs | L = log records/min | Daily rows ≈ L × 1440; body and attributes dominate row size |
Disk growth: daily_increment × R × compression_ratio. Doris columnar compression varies by data; observe data/be-storage (Docker) or the BE volume for 7 days before extrapolating. Shortening retention via dynamic_partition.start is often more effective than adding disk alone.
2. Ingest pipeline tuning
Ingest uses LMAX Disruptor ring buffers and worker pools. Defaults are in ai-apm-ingest/src/main/resources/application.yml.
Parallelism and buffers
| YAML key | Environment variable | Default | When to tune | Increase | Decrease |
|---|---|---|---|---|---|
ingest.pipeline.trace-tasks | INGEST_TRACE_TASKS | 4 | Trace parse/assemble workers | More CPU, less per-queue backlog | Less parallelism, lower CPU |
ingest.pipeline.metric-tasks | INGEST_METRIC_TASKS | 4 | OTLP/JVM/minute metric routing | Same | Same |
ingest.pipeline.aggregate-tasks | INGEST_AGGREGATE_TASKS | 4 | Minute aggregation workers | Try first under high metric throughput | Save resources at low load |
ingest.pipeline.trace-buffer-size | INGEST_TRACE_BUFFER_SIZE | 1024 | Ring slots per trace worker (min 16) | Absorb bursts, more memory | Overflow drops events sooner |
ingest.pipeline.metric-buffer-size | INGEST_METRIC_BUFFER_SIZE | 1024 | Ring slots per metric worker | Same | Same |
ingest.pipeline.aggregate-buffer-size | INGEST_AGGREGATE_BUFFER_SIZE | 1024 | Ring slots per aggregate worker | Same | Same |
When the ring is full, AsyncTask increments overflowCount after failed tryPublish attempts and drops the event. If logs look healthy but the UI misses data, raise *_BUFFER_SIZE or *_TASKS first.
How to change ingest settings (Docker)
For the one-line install layout (default directory /opt/databuff-ai-apm; confirm with echo $APM_INSTALL_DIR). Prefer docker-compose.override.yml so upgrades keep your overrides; full steps including Kubernetes are in Parameter Configuration.
- Back up and edit compose
cd /opt/databuff-ai-apm
cp docker-compose.yml docker-compose.yml.bak
vim docker-compose.yml # or nano / VS Code Remote- Under
ai-apm-ingest→environment, add (keep existingDORIS_*,JAVA_TOOL_OPTIONS, etc.):
  ai-apm-ingest:
    environment:
      # ... existing keys ...
      INGEST_TRACE_TASKS: "8"
      INGEST_TRACE_BUFFER_SIZE: "2048"
      INGEST_DORIS_FLUSH_INTERVAL_MS: "3000"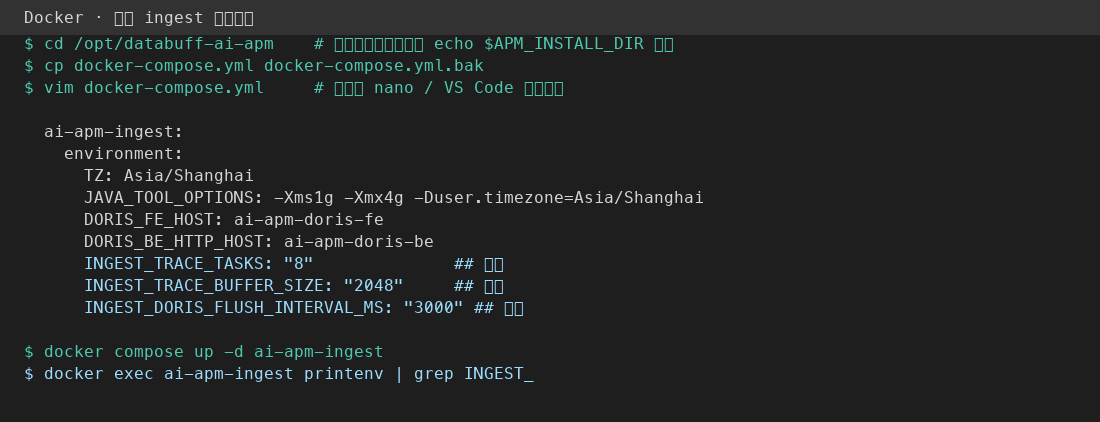
- Apply and verify
docker compose up -d ai-apm-ingest
docker exec ai-apm-ingest printenv | grep '^INGEST_'
You should see INGEST_TRACE_TASKS=8, etc. If not, check YAML indentation under environment:.
- Watch impact:
docker compose logs -f ai-apm-ingestfor Stream Load timeouts; compare trace visibility latency in the UI.
Tuning order: Fix drops with
INGEST_*_BUFFER_SIZE/*_TASKSfirst, then tuneINGEST_DORIS_FLUSH_INTERVAL_MS. Change one or two knobs at a time so you can roll back via.bak.
Doris flush and trace assembly
| YAML key | Environment variable (Spring binding) | Default | Meaning | Increase | Decrease |
|---|---|---|---|---|---|
ingest.doris.flush-batch-bytes | INGEST_DORIS_FLUSH_BATCH_BYTES | 52428800 (50 MiB) | Hand off thread buffer for Stream Load at this estimated NDJSON size | Prefer larger on single-BE / load tests: fewer Stream Loads, stay under tablet version ~2000 | Too-small batches → version pile-up, compaction lag, BE RSS blow-up |
ingest.doris.flush-interval-ms | INGEST_DORIS_FLUSH_INTERVAL_MS | 30000 | Time-fallback flush interval (DorisFlushScheduler) | Further cut load frequency; higher write latency | More frequent flushes (risk hitting version cap) |
ingest.doris.trace-flush-concurrency | INGEST_DORIS_TRACE_FLUSH_CONCURRENCY | 1 | In-flight Stream Loads for trace_dc_span | Parallel loads multiply versions / SegmentCache pressure | Keep 1 on single BE |
ingest.doris.flush-timeout-ms | INGEST_DORIS_FLUSH_TIMEOUT_MS | 60000 | Stream Load wait cap (min 5000) | Tolerate slow BE / large 50 MiB batches | Fail faster on timeouts |
ingest.trace.assembly-check-interval-ms | INGEST_TRACE_ASSEMBLY_CHECK_INTERVAL_MS | 2000 | Incomplete trace scan period | Less CPU scanning, longer partial traces | Faster cross-span assembly |
ingest.metric.trace-minute-late-flush-grace-ms | INGEST_METRIC_TRACE_MINUTE_LATE_FLUSH_GRACE_MS | 20000 | Grace for late traces before minute flush | Tolerate clock skew / slow traces | Earlier minute buckets, weaker late-span linkage |
Set INGEST_DORIS_* and related keys under ai-apm-ingest → environment, then docker compose up -d ai-apm-ingest.
3. Doris storage and retention
Schema: deploy/common/sql/databuff.sql. Trace, log, and most metric_* tables use daily dynamic partitions.
Default retention
"dynamic_partition.enable" = "true",
"dynamic_partition.time_unit" = "DAY",
"dynamic_partition.start" = "-30",
"dynamic_partition.end" = "3",
"dynamic_partition.prefix" = "p"| Property | Meaning |
|---|---|
dynamic_partition.start = -30 | Keep roughly 30 historical day partitions (older partitions are dropped automatically) |
dynamic_partition.end = 3 | Pre-create 3 future days |
dynamic_partition.time_unit = DAY | Daily roll |
Changing retention
On a running cluster, use Doris MySQL protocol (FE port 9030) — no FE/BE restart required.
Steps:
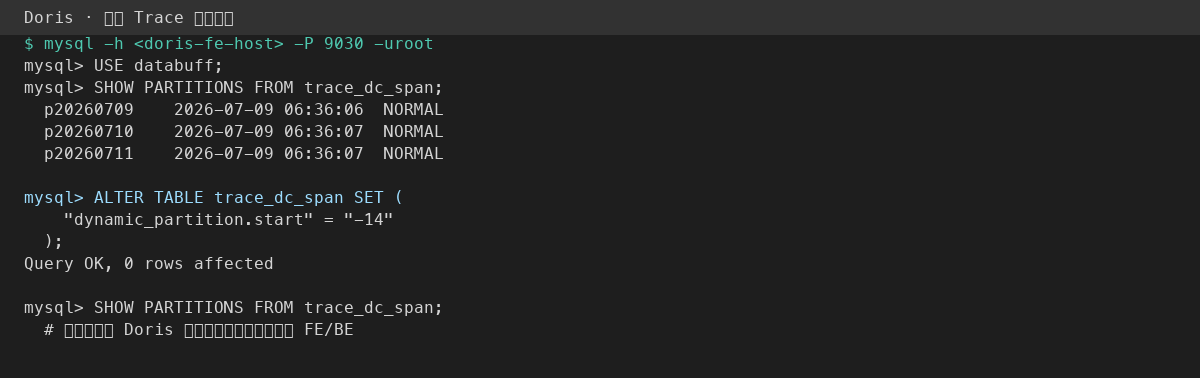
- Connect from a host that can reach Doris FE:
mysql -h 127.0.0.1 -P 9030 -urootWithout a local client: docker run --rm -it mysql:8.4 mysql -h <fe-host> -P 9030 -uroot
- Inspect trace partitions:
USE databuff;
SHOW PARTITIONS FROM trace_dc_span;- Shorten retention from 30 days to 14 days (example):
ALTER TABLE trace_dc_span SET (
  "dynamic_partition.start" = "-14"
);- Repeat for logs and metrics as needed:
ALTER TABLE log_dc_record SET ("dynamic_partition.start" = "-14");
ALTER TABLE metric_service SET ("dynamic_partition.start" = "-14");- Run
SHOW PARTITIONSagain; partitions outside the new window are removed on Doris schedule, not instantly.
Greenfield: edit dynamic_partition.start in deploy/common/sql/databuff.sql before the first start.sh import.
Shorter retention quickly reduces BE disk and compaction pressure; longer retention needs disk and memory planning.
Query performance
- Trace/log tables are partitioned on
startTime/log_time: always filter by time to avoid scanning many days. - Trace table
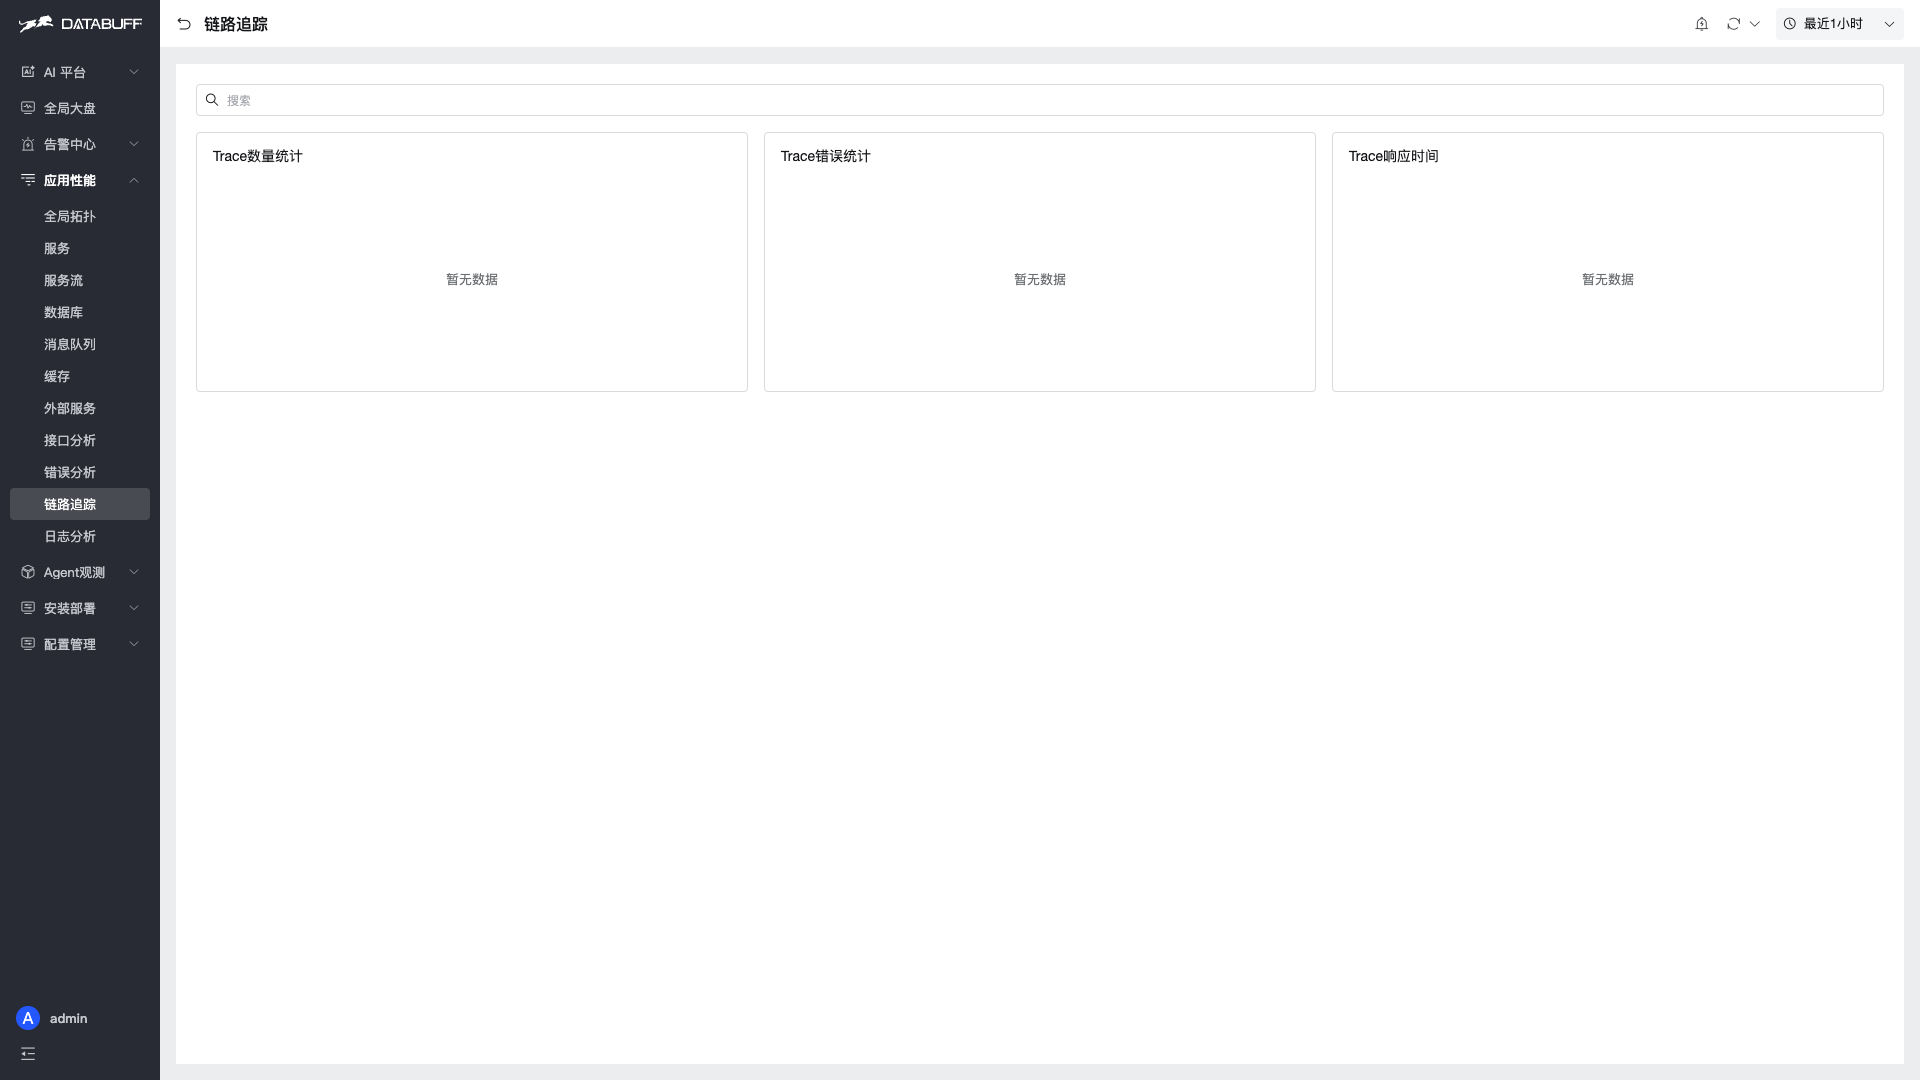
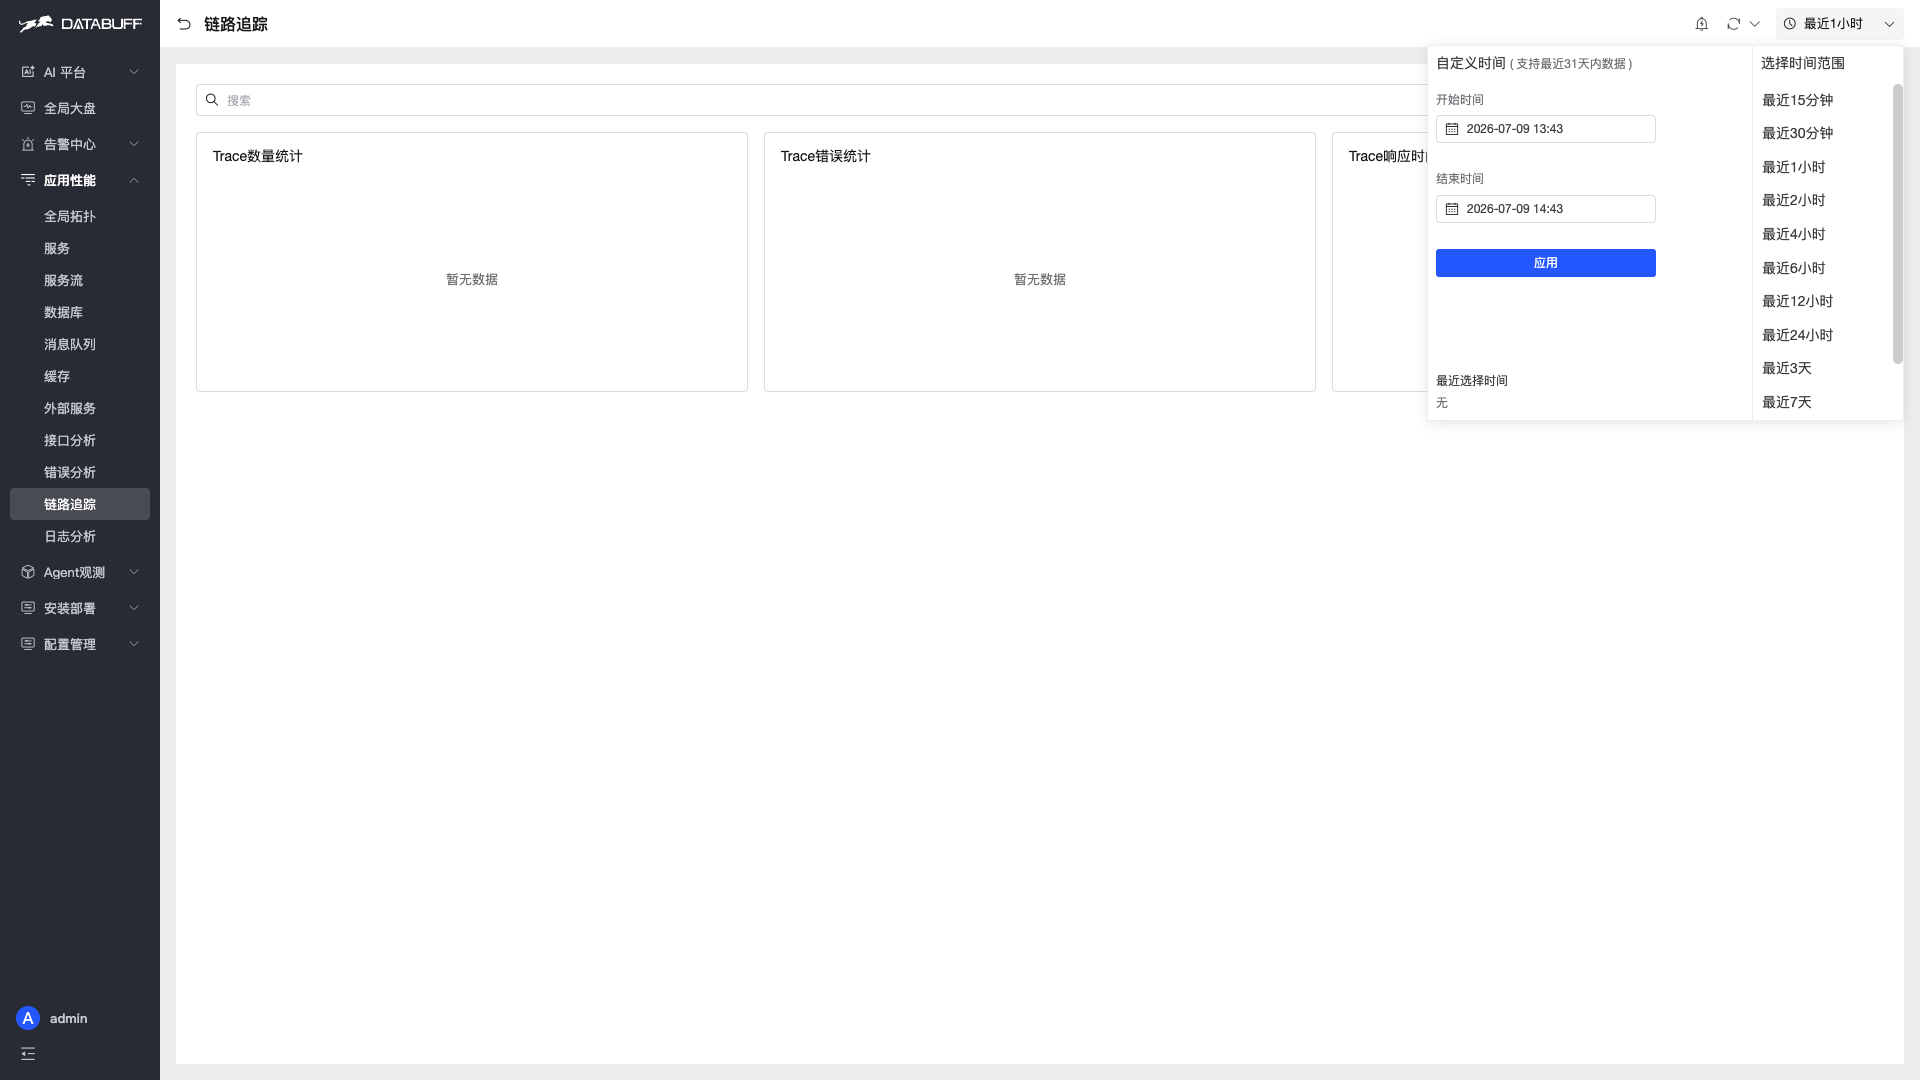
DISTRIBUTED BY HASH(trace_id): point lookups bytrace_idare friendly; wide aggregates still need partition pruning. - Web UI: use the time picker (default Last 1 hour). For single-incident triage, pick Last 15 minutes to 1 hour; use 6h/1d only for trends.
How to narrow the time window:
- Open Application Performance → Trace Tracking (or Services / Log Analytics).
- Click Last 1 hour (or the current range label) in the top-right.
- Choose a preset (e.g. Last 15 minutes) or set start/end, then Apply.
FE / BE memory
- FE:
docker-compose.ymlstartupsed-patches-Xmx8192m→-Xmx1200m. Do not remove this patch. - BE OOM: Docker deploy does not set container
mem_limit; BE uses host free RAM. Keep ≥6–8g free on the host and watch usage withdocker stats ai-apm-doris-be --no-stream.
If OOM persists, shorten dynamic_partition.start or add disk before adding host memory.
4. Web queries and alerting
Settings: ai-apm-web/src/main/resources/application.yml.
Monitor task pool
| YAML key | Environment variable | Default | Role | Increase | Decrease |
|---|---|---|---|---|---|
apm.monitor.pool.core-size | APM_MONITOR_POOL_CORE_SIZE | 4 | Steady alarm/monitor workers | Evaluate more rules in parallel | Less CPU; rules may queue |
apm.monitor.pool.max-size | APM_MONITOR_POOL_MAX_SIZE | 16 | Peak worker cap | Higher burst throughput | Cap concurrency to protect Doris |
apm.monitor.pool.queue-size | APM_MONITOR_POOL_QUEUE_SIZE | 100 | Pending task queue | Buffer evaluation spikes | Tasks rejected when full |
Implemented in MonitorTaskPool.java.
Alarm scheduling
| YAML key | Environment variable | Default | Meaning |
|---|---|---|---|
apm.alarm.lookback-minutes | APM_ALARM_LOOKBACK_MINUTES | 5 | Minutes of data per rule evaluation |
apm.alarm.evaluation-cron | APM_ALARM_EVALUATION_CRON | 0 * * * * ? | Fire at second 0 every minute (Spring 6-field cron) |
Under Doris pressure, prefer fewer/narrower rules over raising lookback — a longer window loads more data per evaluation.
HTTP compression
server.compression.enabled: true gzip-responses for JSON/JS/etc. above 1024 bytes. Usually leave enabled for dashboards and topology APIs.
How to change the web monitor pool (Docker)
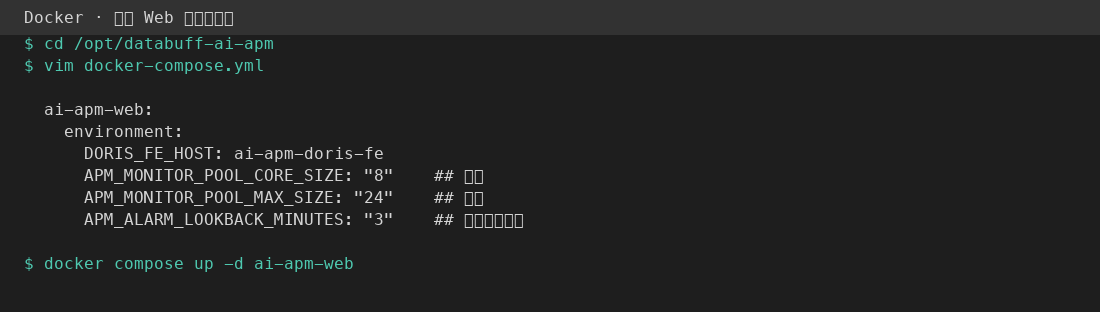
Alarm evaluation uses apm.monitor.pool.*. Override via web container env in docker-compose.yml → ai-apm-web.environment.
- Edit
/opt/databuff-ai-apm/docker-compose.ymland add:
      APM_MONITOR_POOL_CORE_SIZE: "8"
      APM_MONITOR_POOL_MAX_SIZE: "24"
      APM_ALARM_LOOKBACK_MINUTES: "3"   # optional, default 5
docker compose up -d ai-apm-web
With many rules, fewer rules beats unbounded pool growth; higher
lookback-minutesincreases Doris scan size per run.
5. OTel SDK / agent recommendations
Reduce ingress volume before server tuning. Baseline: OpenTelemetry OTLP Ingestion.
| Technique | Typical env / config | Effect |
|---|---|---|
| Head sampling | OTEL_TRACES_SAMPLER=parentbased_traceidratio, OTEL_TRACES_SAMPLER_ARG=0.1 | Drops most traces at the SDK |
| Tail sampling | Collector tail_sampling processor | Keeps errors/slow traces; requires a Collector hop |
| Metric export interval | OTEL_METRIC_EXPORT_INTERVAL (SDK default often 60000 ms) | Lowers metric rows/min |
| Trace batching | OTEL_BSP_MAX_EXPORT_BATCH_SIZE, OTEL_BSP_SCHEDULE_DELAY | Network batching only; does not reduce stored rows |
| Log batching | OTEL_BLRP_MAX_EXPORT_BATCH_SIZE, OTEL_BLRP_SCHEDULE_DELAY | Controls log export batches and timing |
Recommended order: sampling → metric interval → ingest/Doris.
How to configure OTel sampling (application)
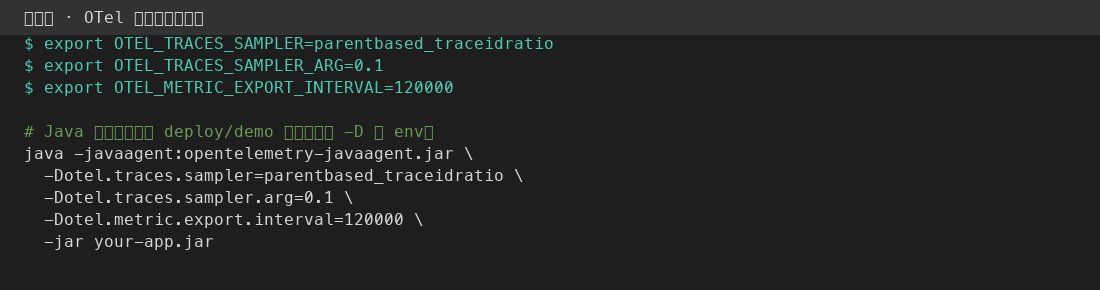
Set env vars on the business process or demo startup script (OTel SDK reads them automatically):
export OTEL_TRACES_SAMPLER=parentbased_traceidratio
export OTEL_TRACES_SAMPLER_ARG=0.1
export OTEL_METRIC_EXPORT_INTERVAL=120000
java -javaagent:opentelemetry-javaagent.jar -jar your-app.jar
Java system properties also work: -Dotel.traces.sampler=parentbased_traceidratio -Dotel.traces.sampler.arg=0.1
Restart the app, then check trace volume under Application Performance → Trace Tracking. See OpenTelemetry OTLP Ingestion.
6. Offline vs online install
Same images and docker-compose.yml defaults — no performance difference; only distribution differs (Offline Installation). Tune performance in the install directory docker-compose.yml as in the ingest / web / BE sections above.
7. Bypass AVX2 check on x86_64 without AVX2
Doris BE on x86_64 / amd64 uses AVX2 for vectorized queries. Online/offline installers call ensure_avx2_cpu from deploy/common/scripts/check-avx2.sh. If /proc/cpuinfo lacks the avx2 flag, install exits 1.
These cases skip the check automatically:
| Environment | Behavior |
|---|---|
| arm64 / aarch64 | Check skipped |
macOS (no /proc/cpuinfo) | Check skipped (Doris in Linux containers still follows host CPU features) |
Recommended: DATABUFF_SKIP_AVX2_CHECK (v0.1.6+ script)
Set before install:
Online (curl):
export DATABUFF_SKIP_AVX2_CHECK=1
curl -fsSL https://databuff.ai/databuff/ai-apm-install.sh | bash
Offline:
export DATABUFF_SKIP_AVX2_CHECK=1
cd /path/to/databuff-docker-offline-*-amd64
./install-offline.sh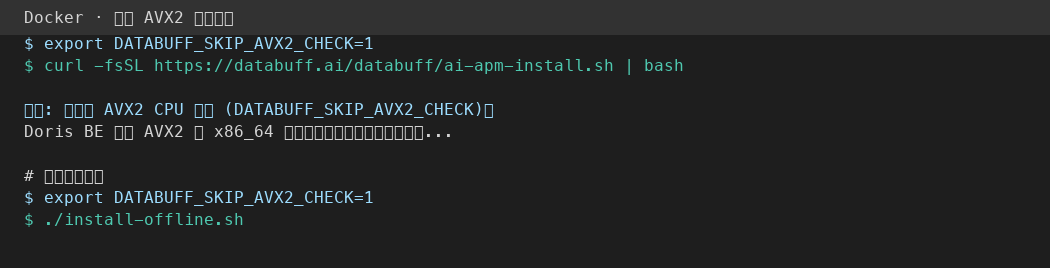
A warning (not an error) is printed; Doris may be unstable without AVX2.
Fallback: patch offline bundle script
For older check-avx2.sh without the env var:
- Edit
scripts/check-avx2.shinside the extracted offline bundle - Add
return 0as the first line ofensure_avx2_cpu()(or replace the function body withreturn 0) - Run
./install-offline.sh
For curl install without an updated CDN script, use an offline bundle or wait for a release that ships the skip logic.
Verify AVX2 after install
grep -m1 avx2 /proc/cpuinfo && echo "AVX2: yes" || echo "AVX2: no"Risks
| Topic | Notes |
|---|---|
| Why we check | Doris does not support non-AVX2 x86_64; BE may fail to start, run slowly, or crash |
| What skip does | Bypasses the installer only; does not change Doris binaries |
| Recommendation | Production: Haswell+ x86_64 or arm64; skip only for PoC / legacy VMs |
8. Troubleshooting checklist
| Symptom | Checks | Mitigation |
|---|---|---|
| High ingest write latency | INGEST_*_BUFFER_SIZE, *_TASKS; INGEST_DORIS_FLUSH_INTERVAL_MS / FLUSH_TIMEOUT_MS | Raise parallelism/buffers; shorter flush interval trades Doris load |
| Ingest write failures | DORIS_FE_HOST, DORIS_BE_HTTP_HOST; ingest/BE logs | Fix Stream Load connectivity; BE disk and health |
| Doris BE OOM / restart | Host free RAM, retention, be-storage usage | More host memory or shorter dynamic_partition.start |
| Doris FE OOM | FE -Xmx1200m patch present | Keep compose sed patch |
| Slow web queries | UI time range; partition pruning; BE compaction | Narrow time window; check BE CPU/IO |
| Rule evaluation slows web | apm.monitor.pool.*; rule count | Reduce rules; raise max-size if needed |
| Metrics but no traces | Agent sampling; ingest buffer overflow | Raise sampling or trace pipeline buffers |
| Install fails on AVX2 | grep avx2 /proc/cpuinfo | See §7 Bypass AVX2; upgrade CPU or DATABUFF_SKIP_AVX2_CHECK=1 |
Logs:
# Docker
docker compose logs -f ai-apm-ingest ai-apm-doris-be ai-apm-web