
Platform Self-Monitoring and Self-Troubleshooting
DataBuff "takes care of itself": it treats itself as a monitored system and watches its three core components — ingest (data ingestion), web (data query), Doris (data storage). When the platform is congested, dropping data, or needs a parameter tuned, you don't have to dig through logs — you can see it at a glance in the UI, and with one sentence, the AI can investigate and even fix it for you.
Platform self-monitoring has 5 capabilities. Here's how to use each one.
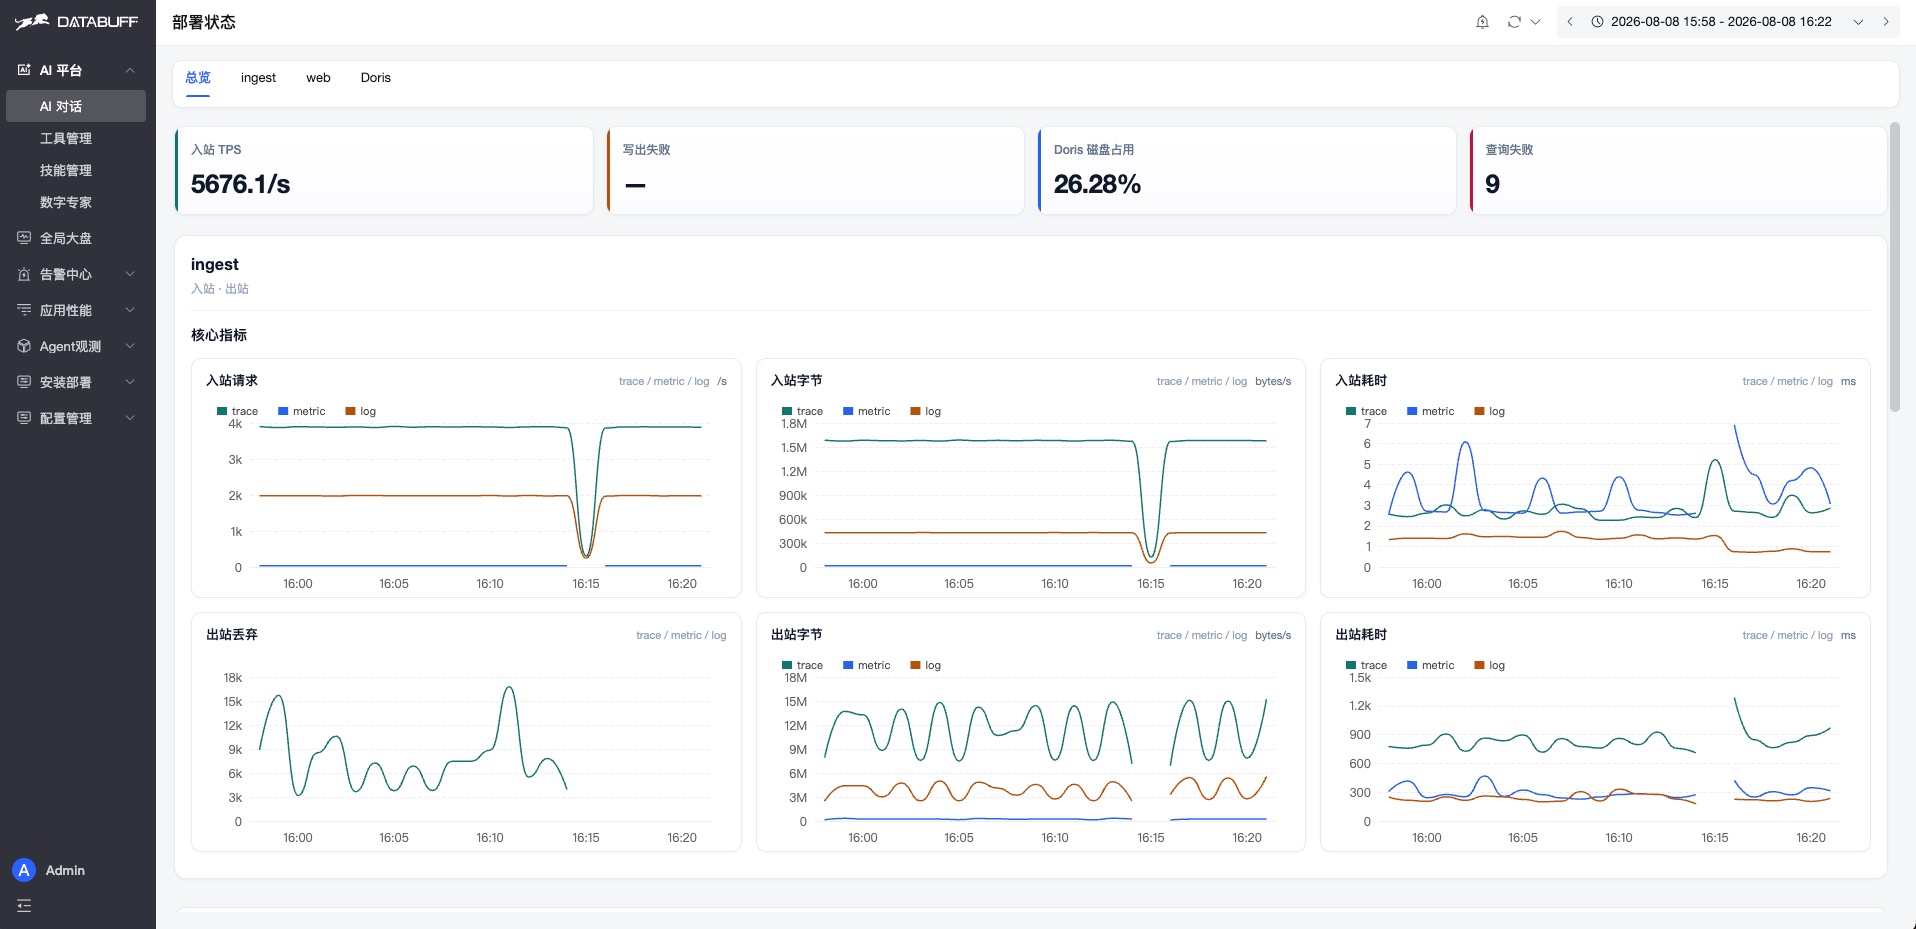
Capability 1: See itself — open the "Deployment Status" page
Entry: left menu Deploy → Status (route /deploy/status).
Start with the Overview tab and its four cards — they tell you at a glance whether the platform is healthy:
| Card | What to look at |
|---|---|
| Inbound TPS | How much data is being received per second |
| Write failures | Any data failing to write into Doris (non-zero = attention) |
| Doris disk usage | How much storage is left |
| Query failures | Any errors when querying data |
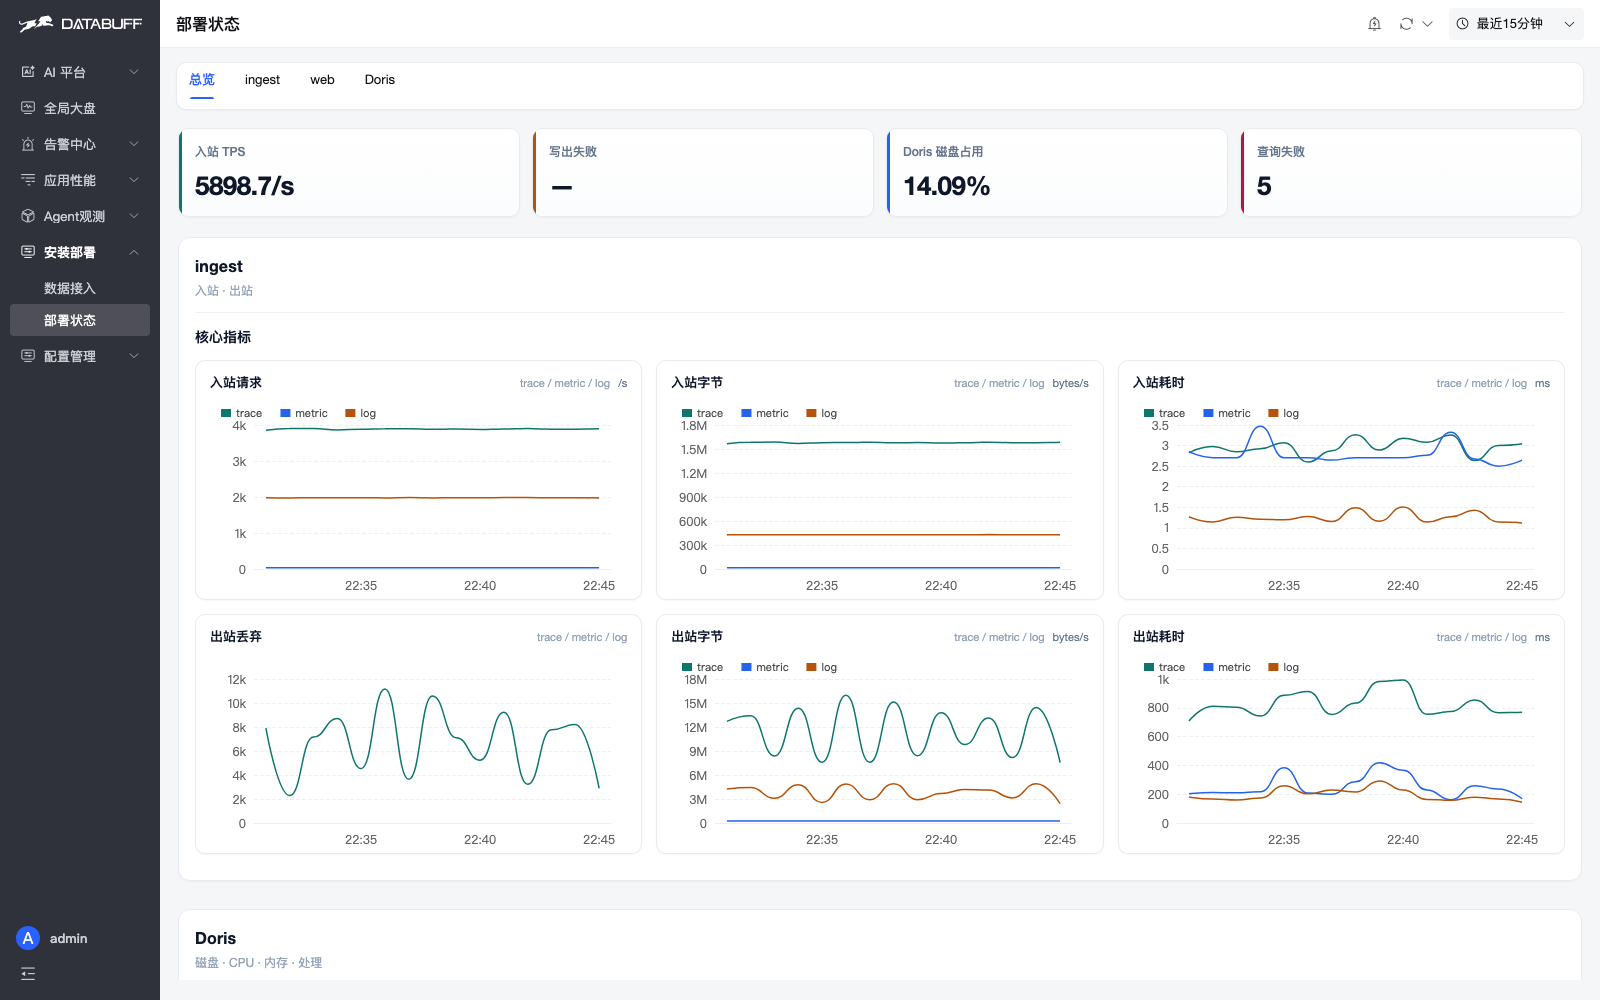
Scroll down for more tabs — click the component you want to inspect:
- ingest tab: how data is received, processed, and written out; whether each signal (trace / metric / log) is dropping
- web tab: how fast the query APIs are and whether they error
- Doris tab: whether storage nodes are alive, and their disk / CPU state
Two red signals to watch (handle if persistently non-zero):
- Pipeline drop: the pipeline buffer is full — data is lost
- Write drop: the write-to-Doris queue is full — data is lost
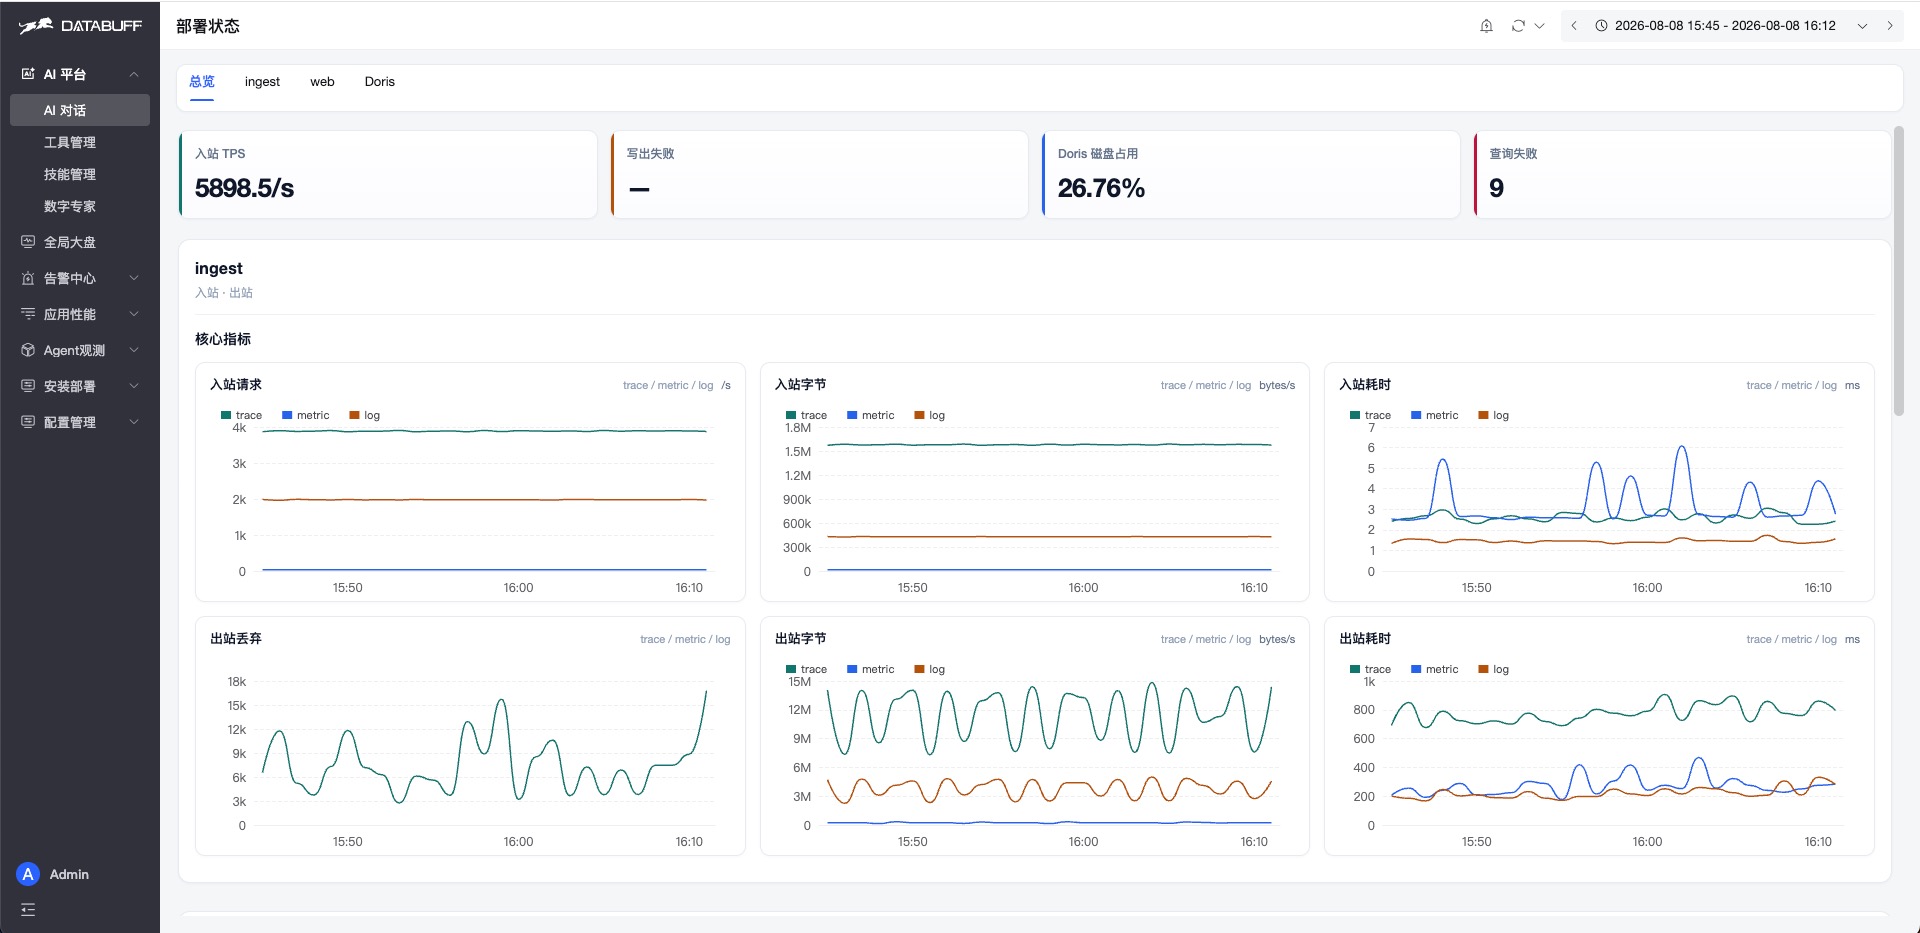
Capability 2: Understand itself — every metric comes with a "manual"
No need to memorize metrics. Click the title of any chart and a help drawer opens on the right that explains the metric:
- How it is computed
- Whether to worry (when it counts as an anomaly)
- Which environment variable to tune and its default value when an anomaly occurs
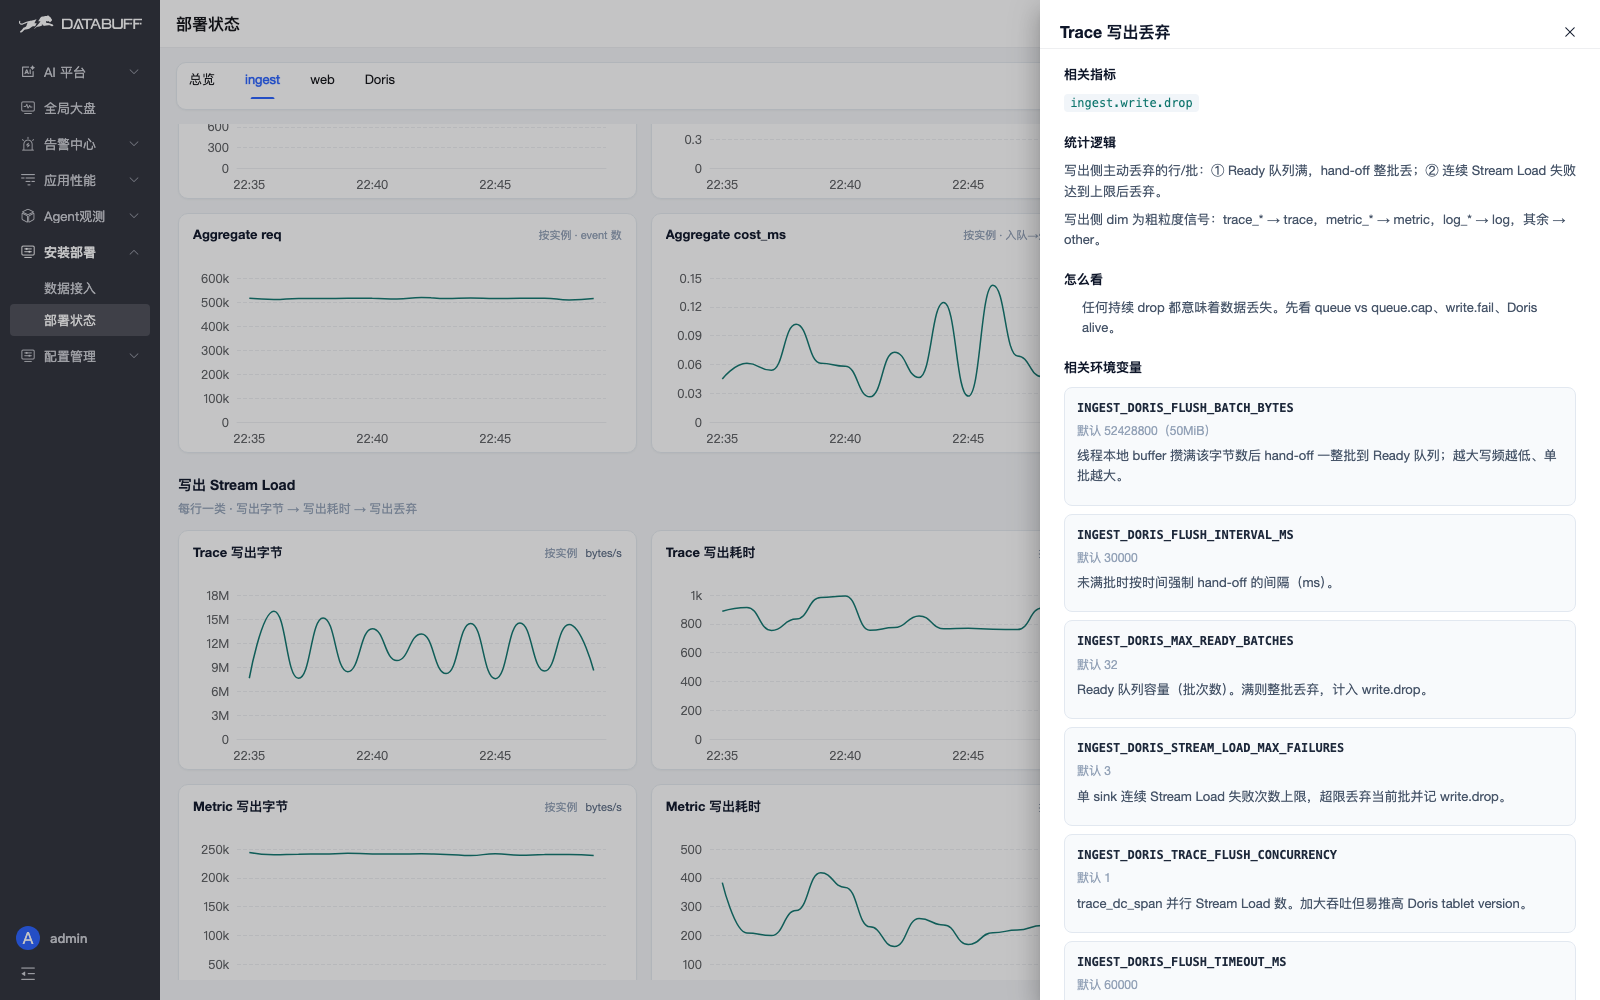
For example, click "write drop" and it tells you: data is only dropped when the queue is full or writes fail repeatedly, and it lists the tunable parameters with their defaults.
Capability 3: Physical check-up — one sentence triggers a full platform inspection
Don't want to page through charts? In the AI Platform, just say:
Run an inspection on the DataBuff platform and produce an html inspection report
The product Q&A expert automatically reads the metric catalog, queries platform self-monitoring data, flags anomalies, and produces a forwardable HTML inspection report.
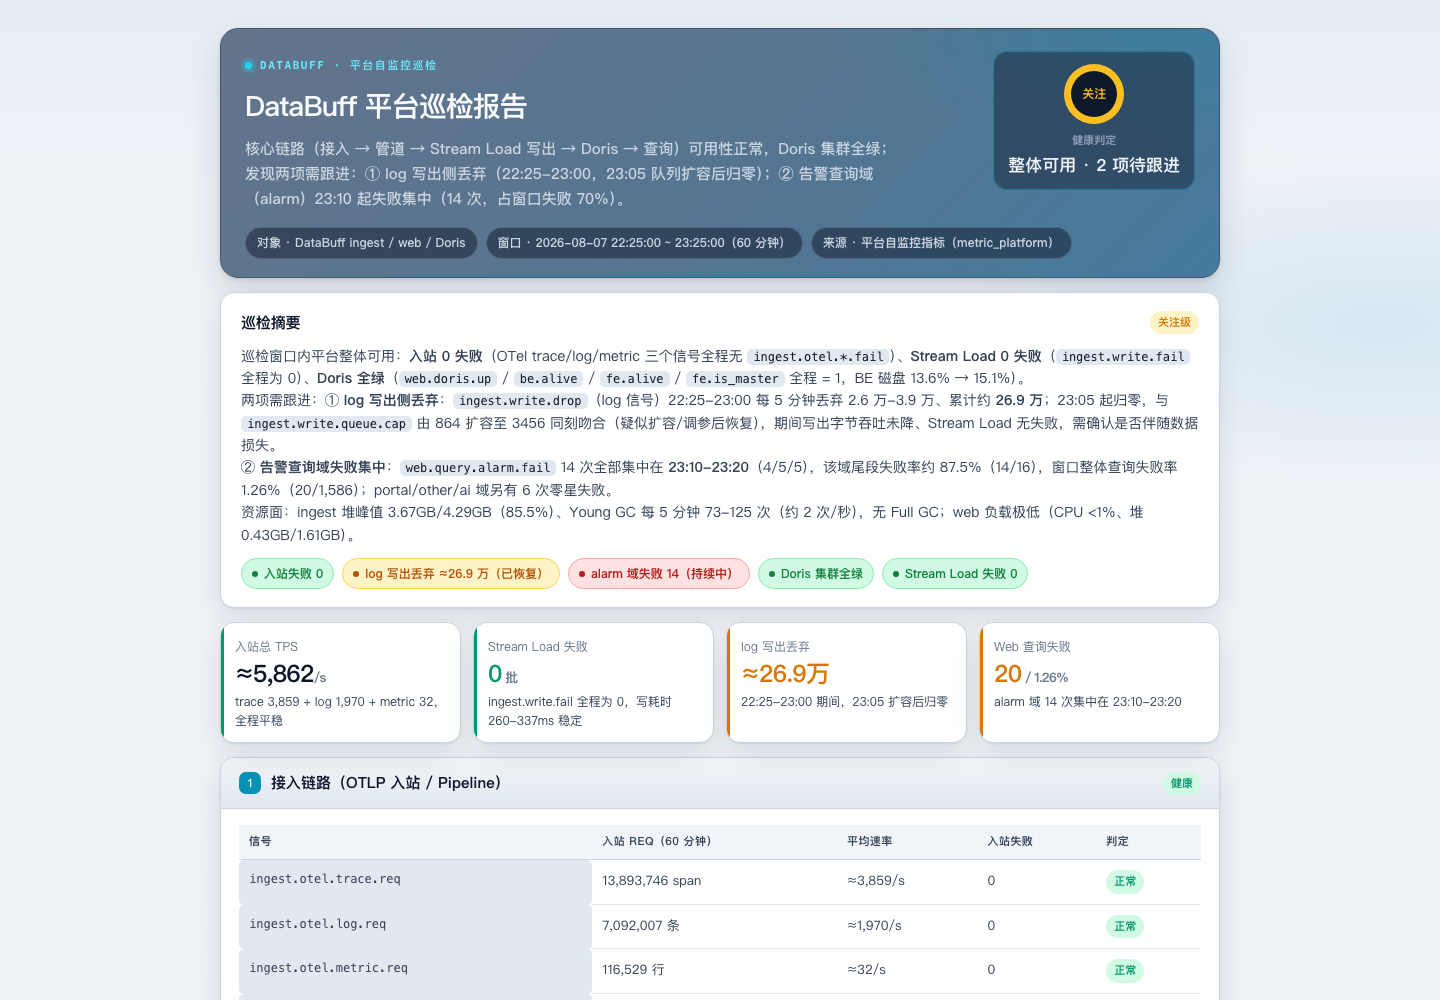
Capability 4: Diagnose itself — let the AI find out why data is dropping
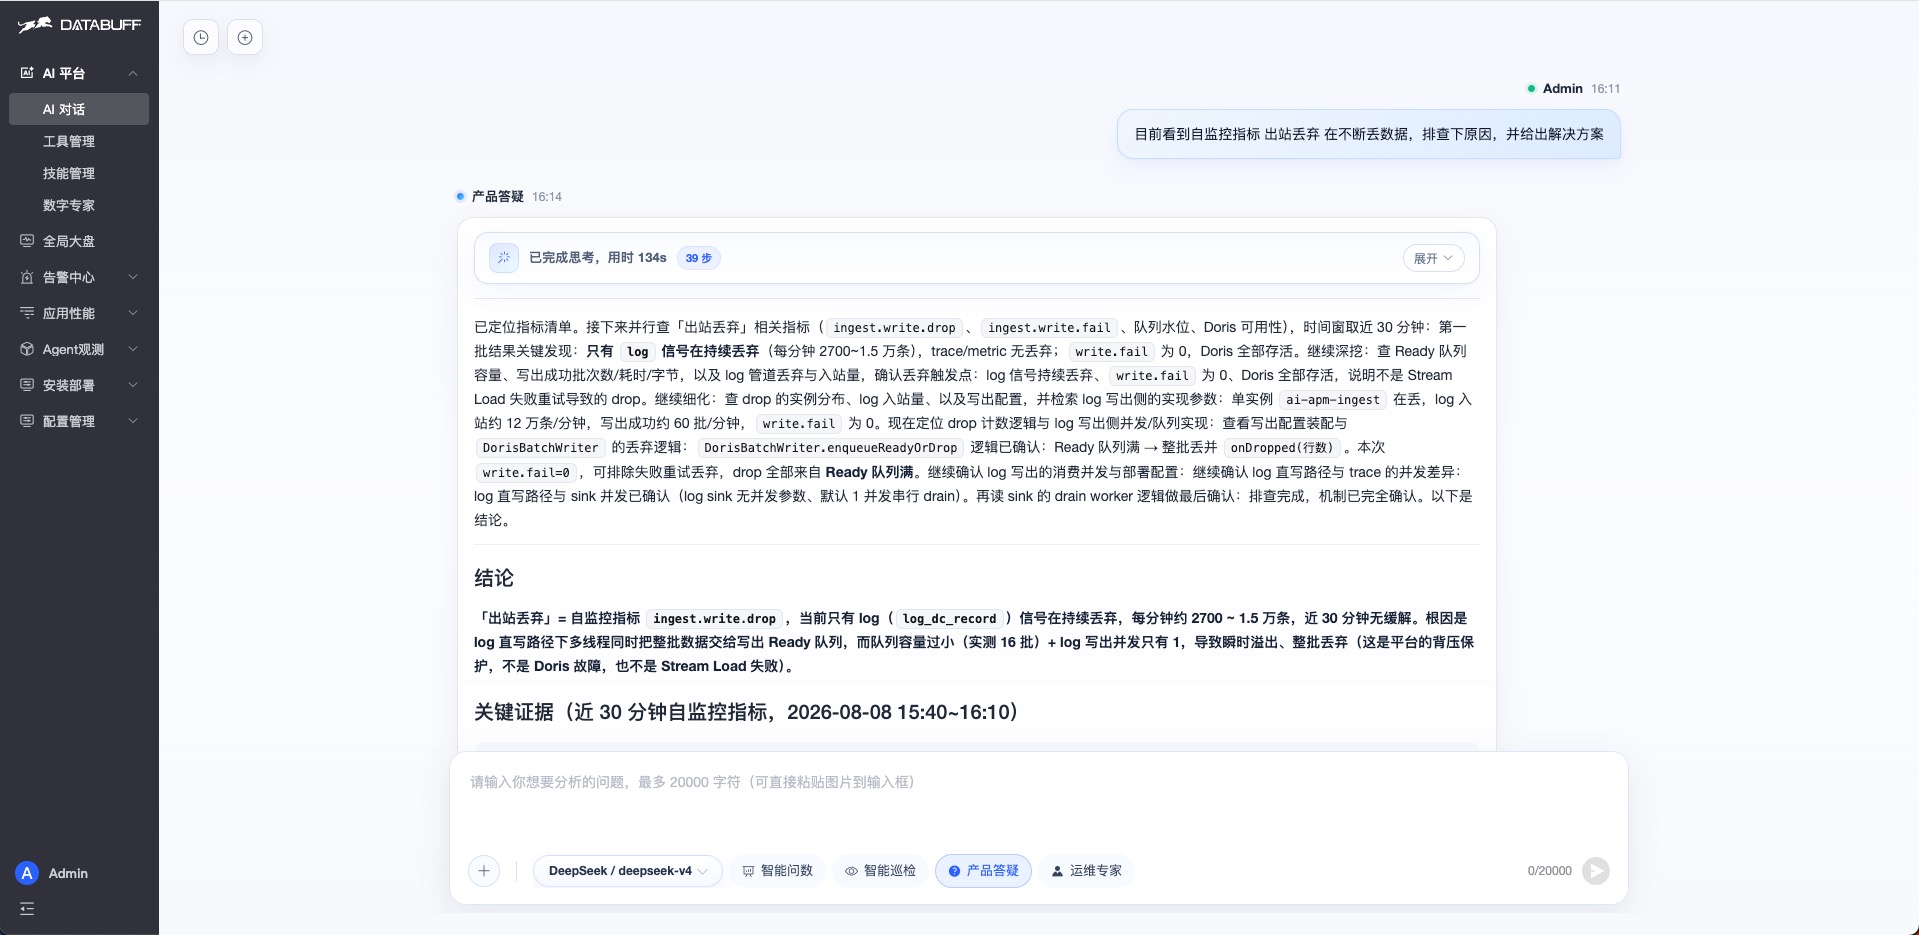
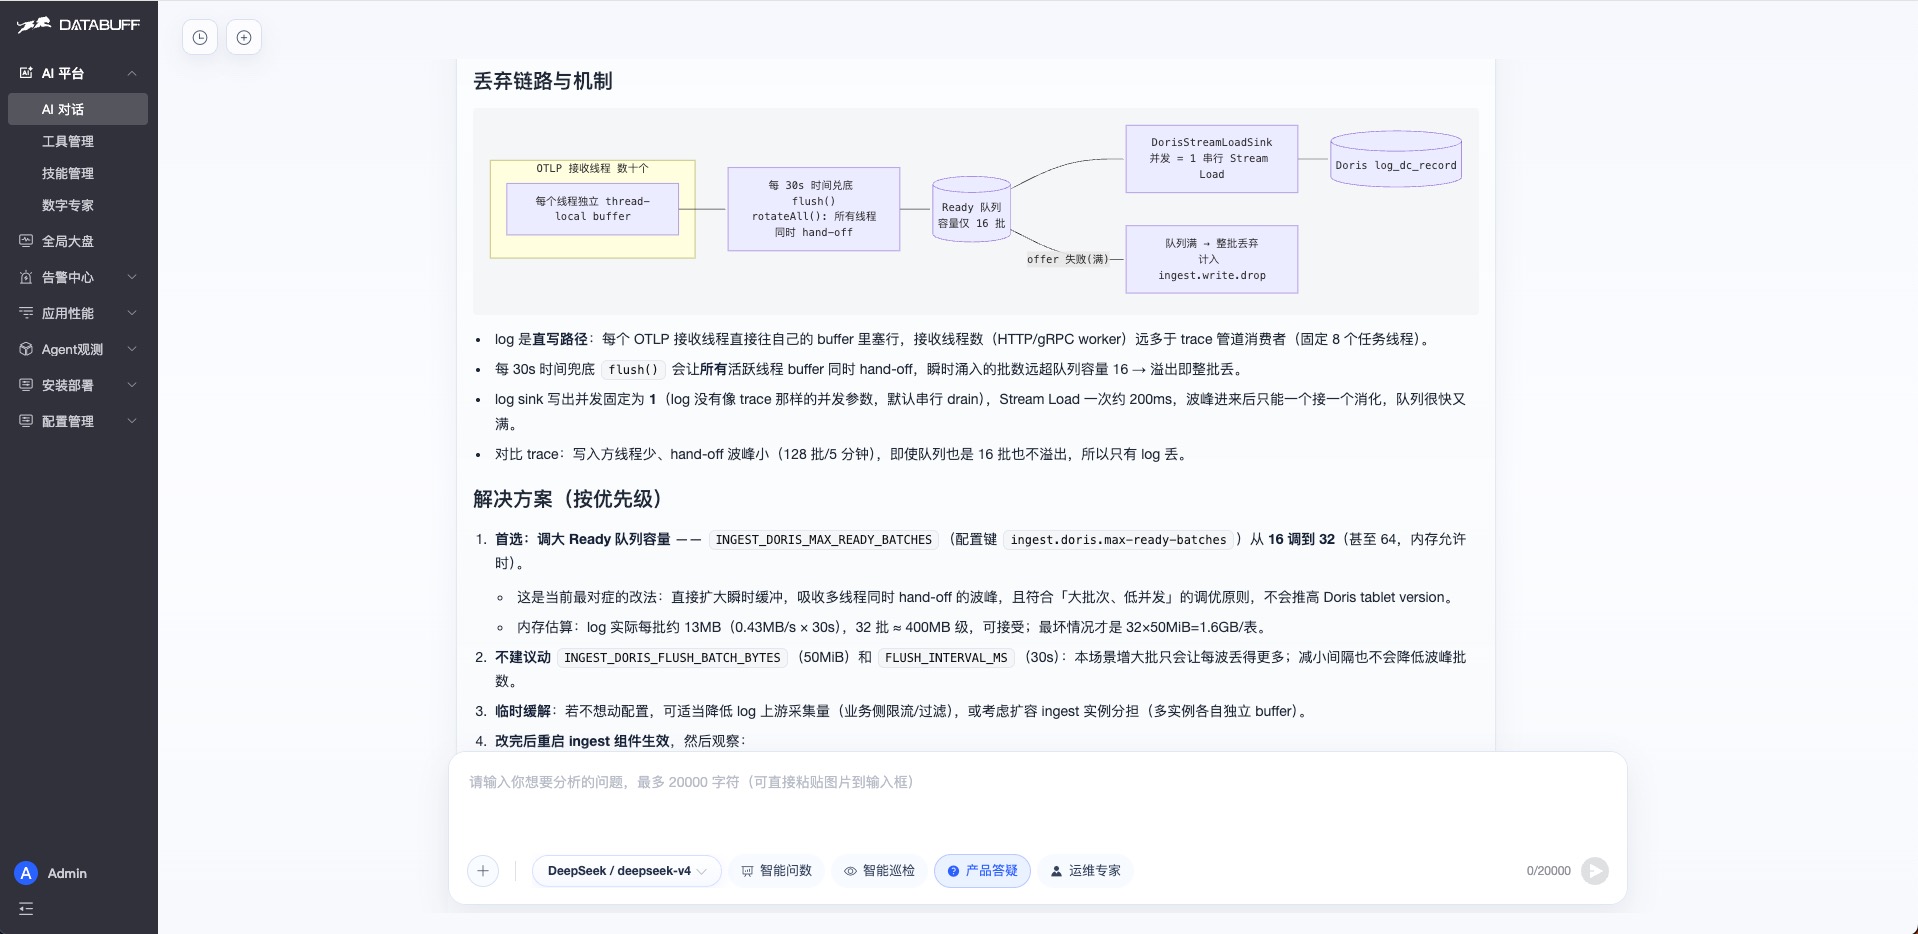
Seeing data loss on the page? Don't guess layer by layer. Ask the product Q&A expert in the AI Platform to investigate. It steps through:
- Rule out "non-issues" (business side normal, Doris storage normal)
- Pinpoint the real root cause (e.g. the write-to-Doris queue is too small, burst traffic overflows and entire batches are dropped)
- Give an evidence-backed conclusion and fix recommendation
Capability 5: Fix itself — the AI changes parameters and restarts for you
The product Q&A expert can apply the fix itself: log into the server → edit config → restart the component → verify. You don't touch a thing.
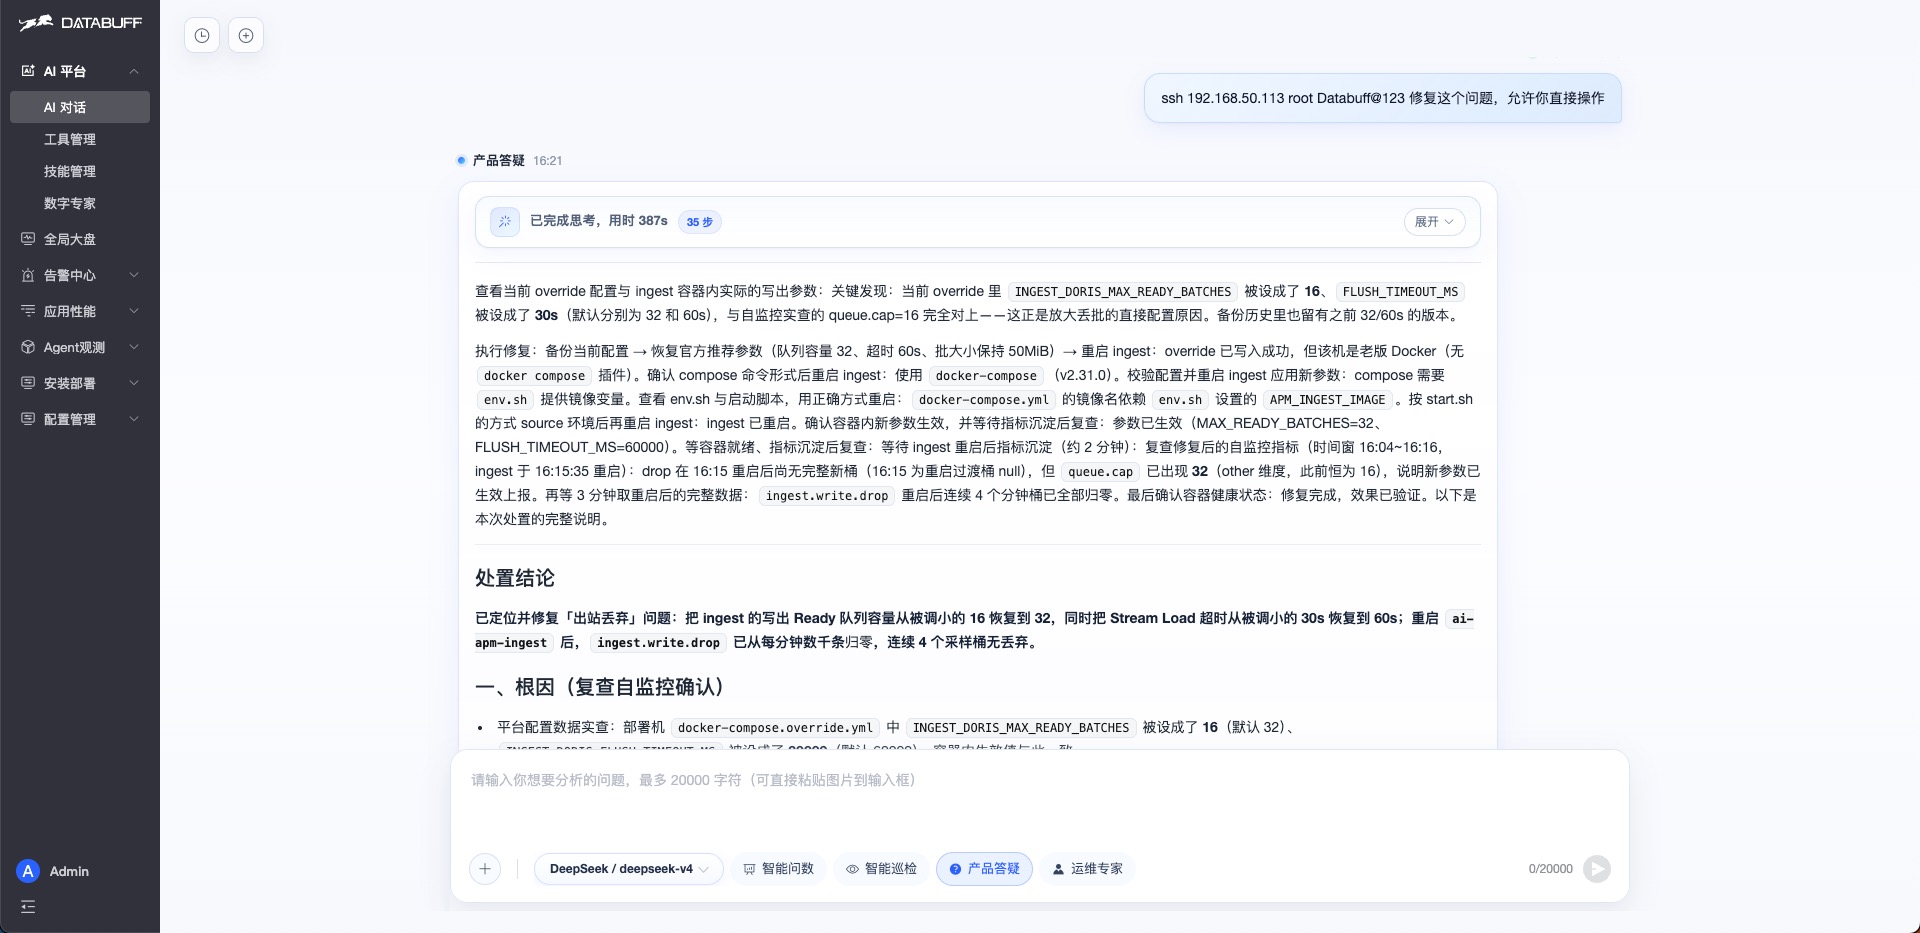
Real case (log data kept dropping):
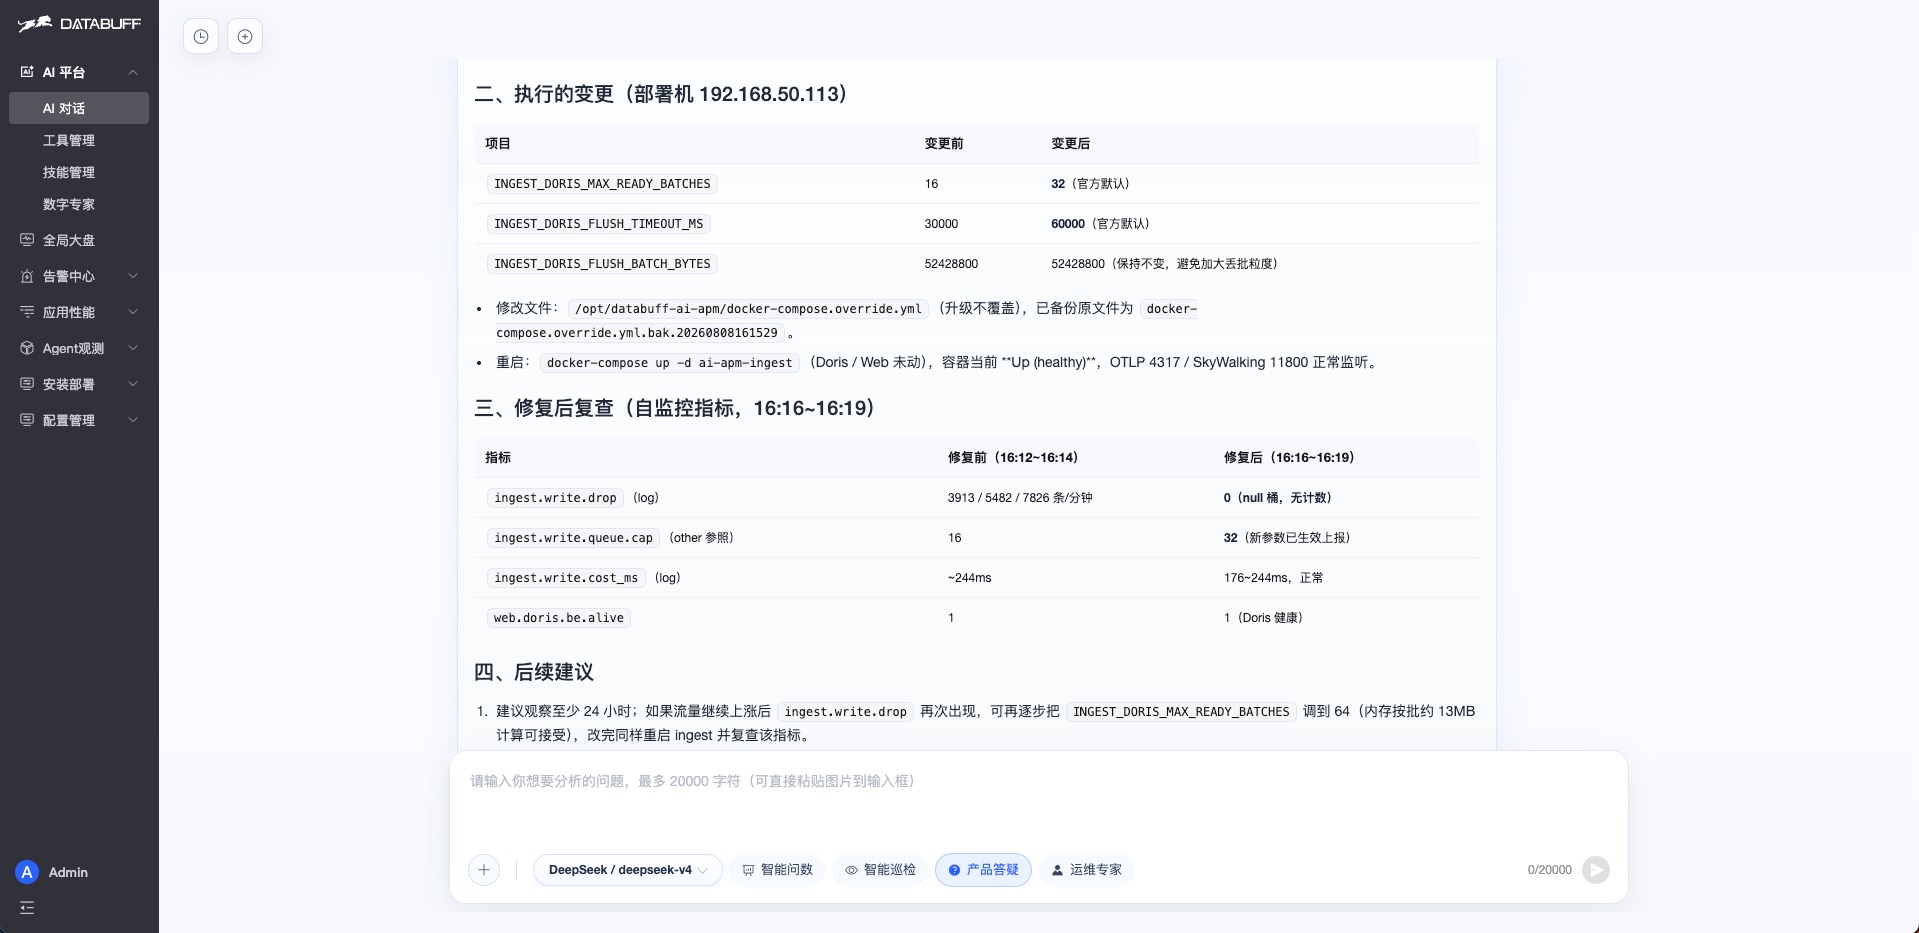
| Parameter | Broken | Adjusted | Effect |
|---|---|---|---|
INGEST_DORIS_MAX_READY_BATCHES | 16 | 32 | Write queue too small, doubled it |
INGEST_DORIS_FLUSH_TIMEOUT_MS | 30s | 60s | Restored default, avoids false failures on large batches |
After the fix, "write drop" returns to zero and the problem is resolved:
Three things to do after install
- Open the Deployment Status page and glance at the four cards
- Let the AI run one inspection and share the report with your team
- When data drops, let the AI diagnose and fix it — don't dig through manuals yourself
Want to go deeper?
Full metric names, computation semantics, and all environment variables are documented in the Platform Self-Monitoring Metric Catalog.